. 2023 May;19(5):1491-1511.
doi: 10.1080/15548627.2022.2139920. Epub 2022 Nov 21.

Ablation of endothelial Atg7 inhibits ischemia-induced angiogenesis by upregulating Stat1 that suppresses Hif1a expression

Affiliations

Ablation of endothelial Atg7 inhibits ischemia-induced angiogenesis by upregulating Stat1 that suppresses Hif1a expression

Hongmin Yao et al. Autophagy. 2023 May.

Abstract

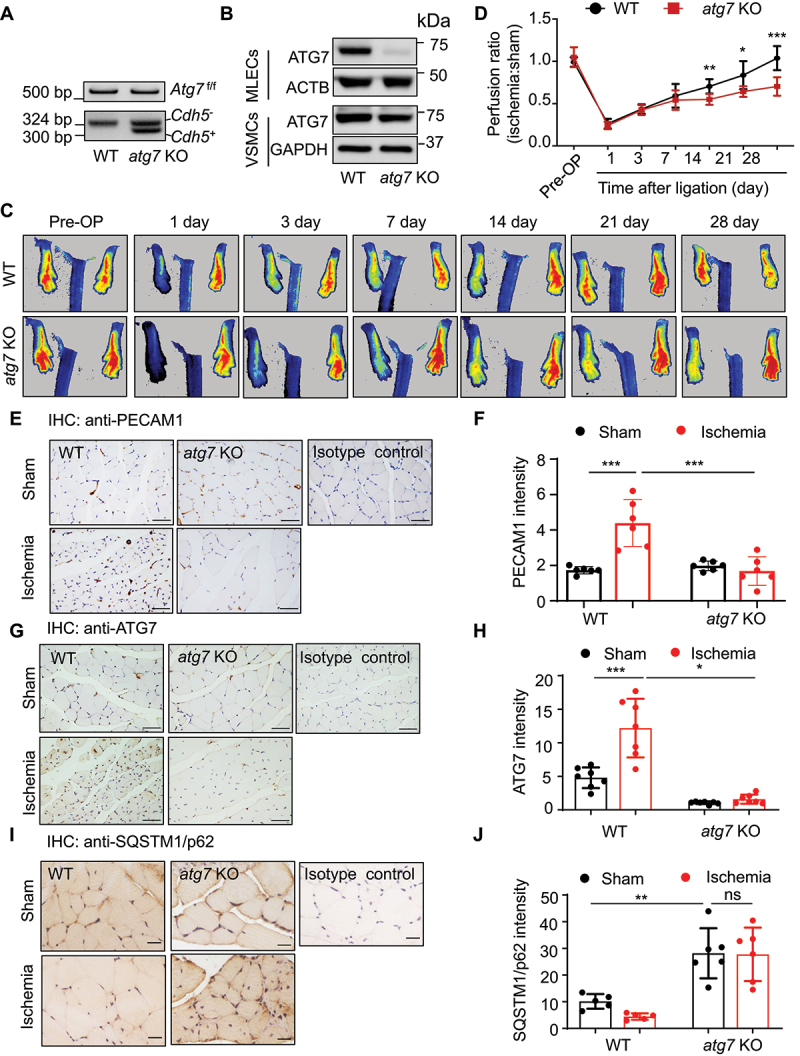
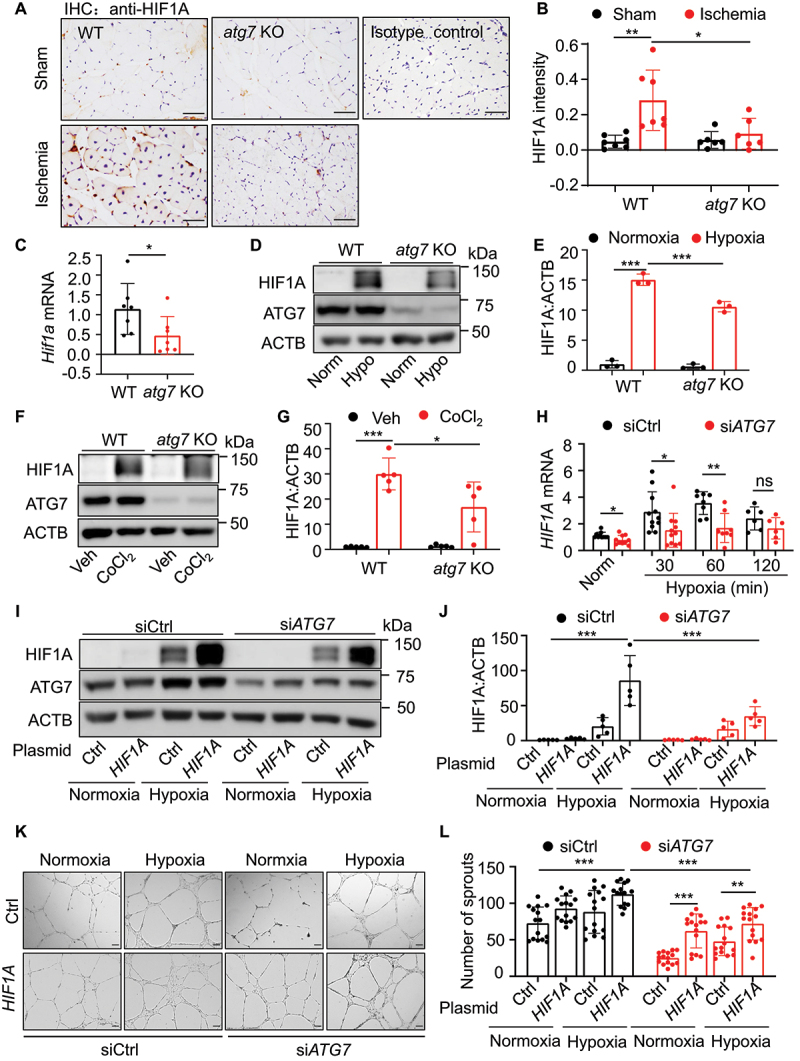
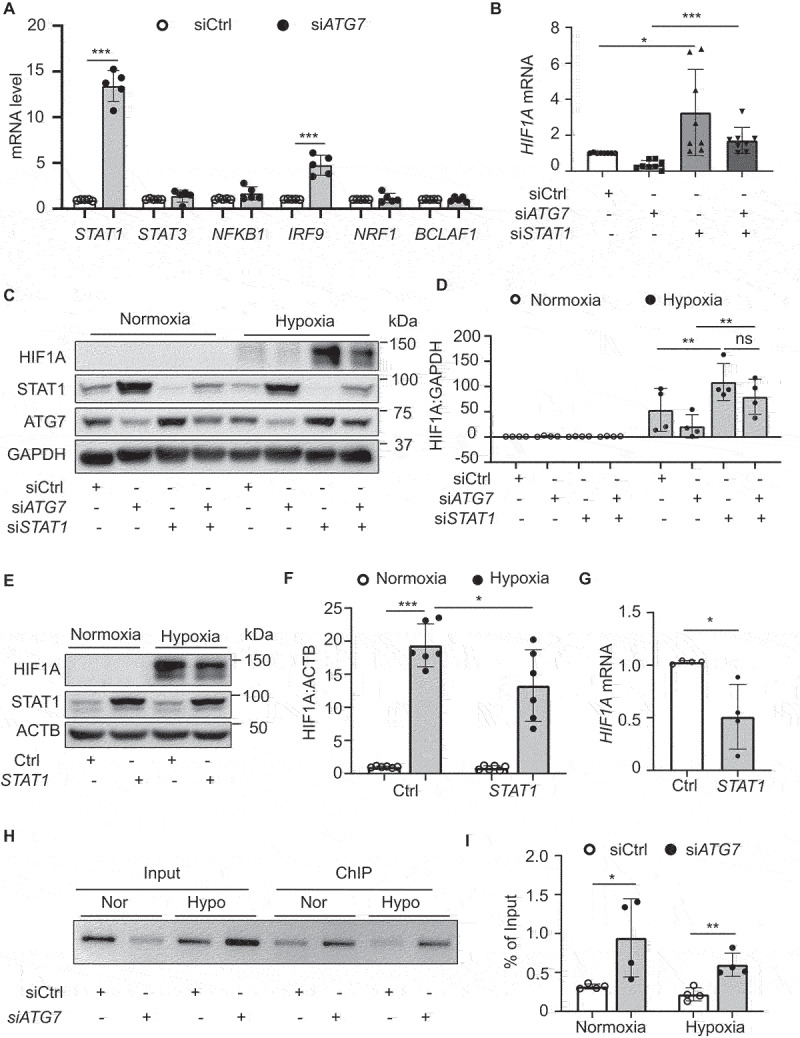
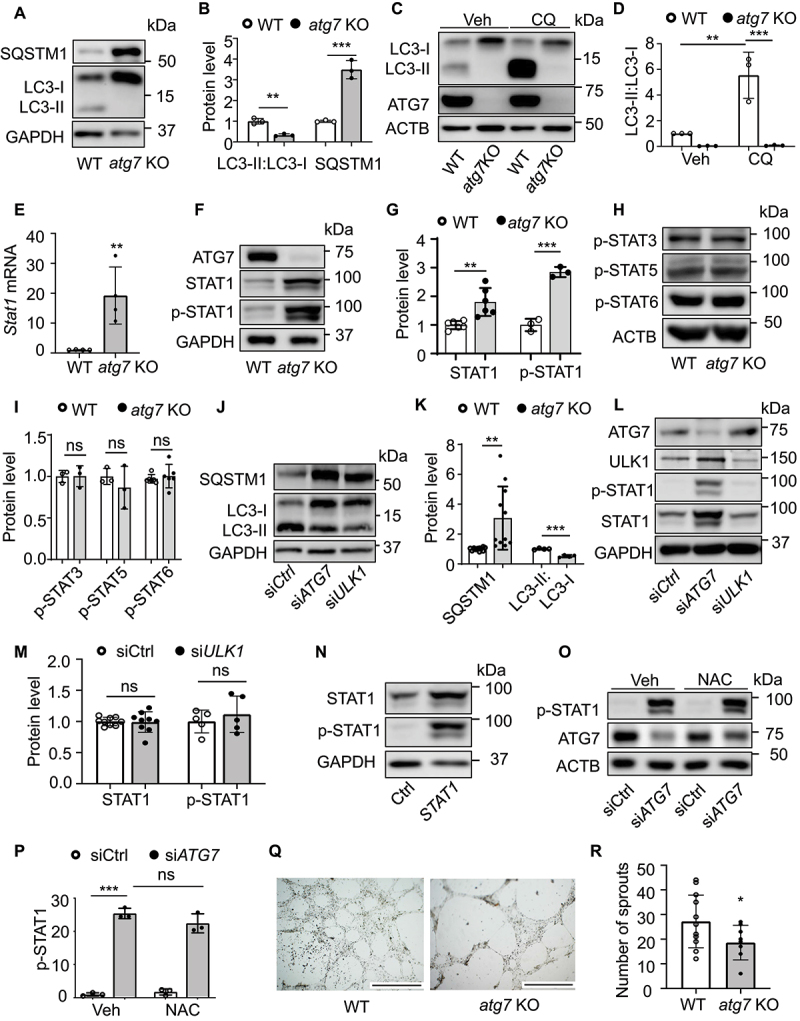
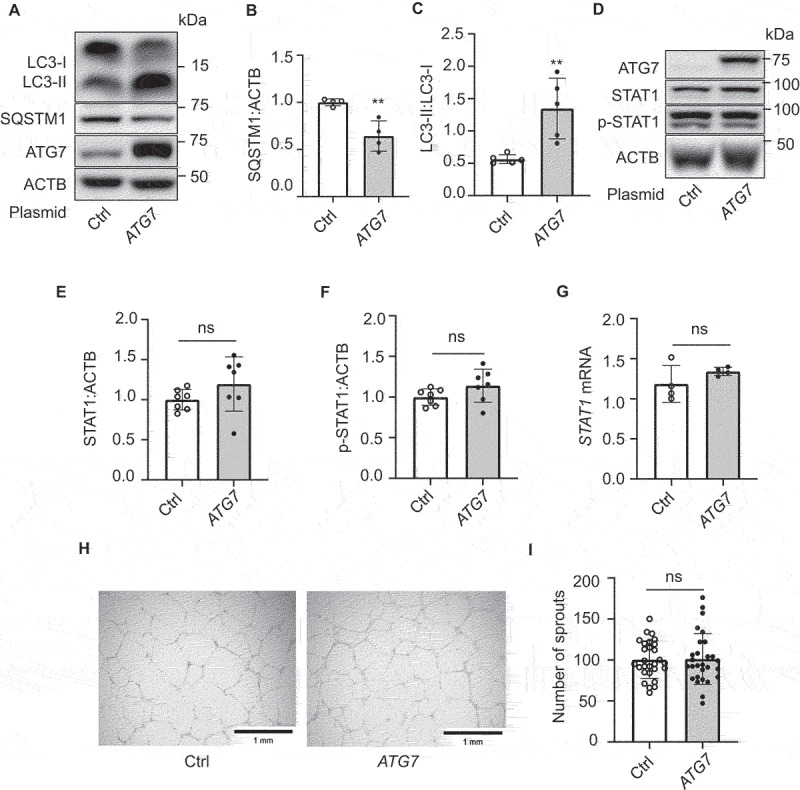
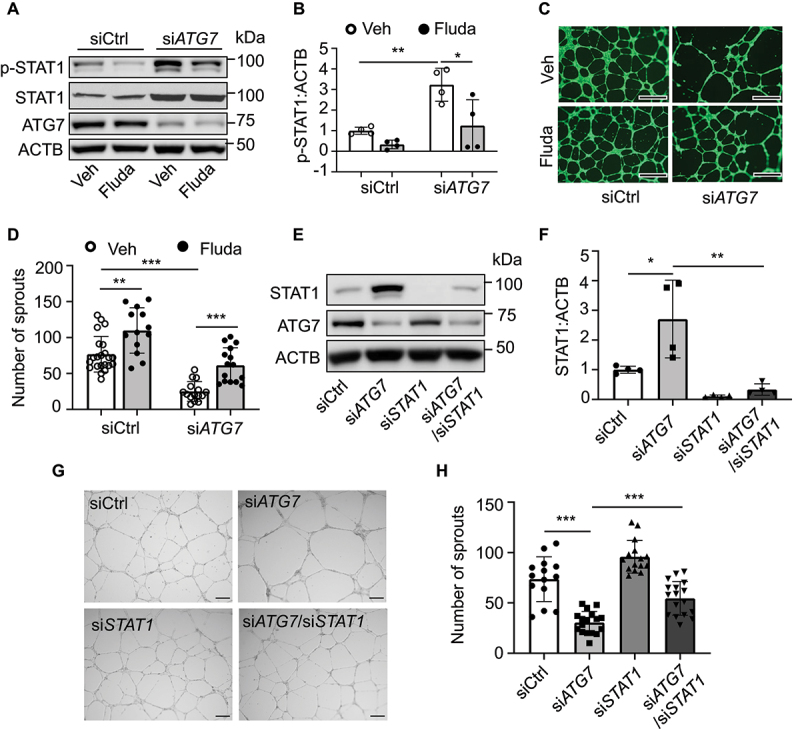
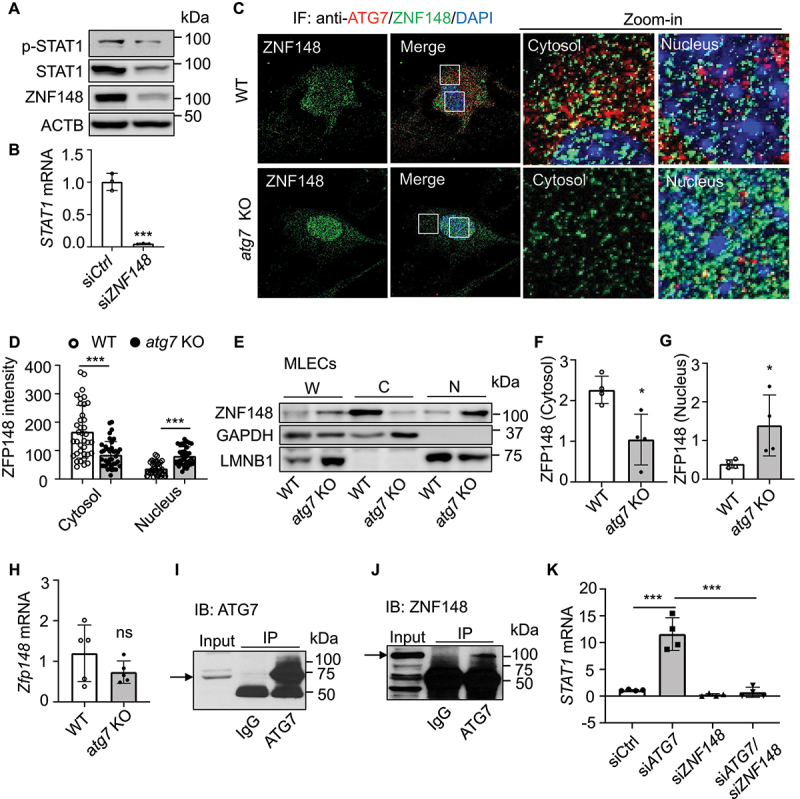
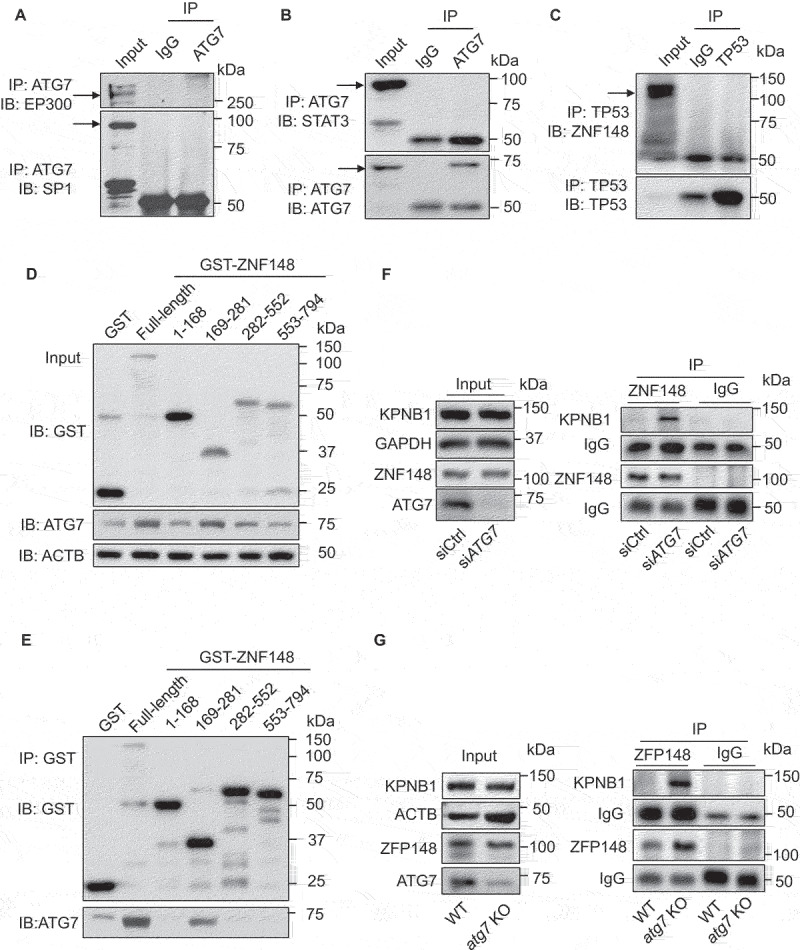
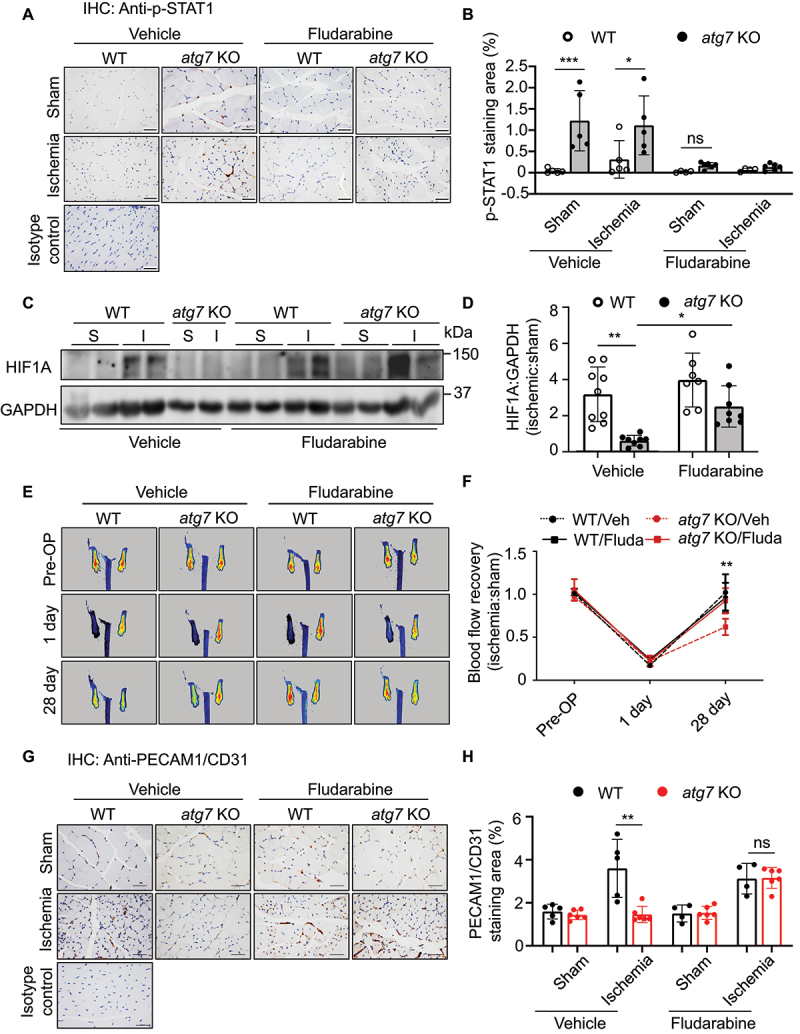
Ischemia-induced angiogenesis is critical for blood flow restoration and tissue regeneration, but the underlying molecular mechanism is not fully understood. ATG7 (autophagy related 7) is essential for classical degradative macroautophagy/autophagy and cell cycle regulation. However, whether and how ATG7 influences endothelial cell (EC) function and regulates post-ischemic angiogenesis remain unknown. Here, we showed that in mice subjected to femoral artery ligation, EC-specific deletion of Atg7 significantly impaired angiogenesis, delayed the recovery of blood flow reperfusion, and displayed reduction in HIF1A (hypoxia inducible factor 1 subunit alpha) expression. In addition, in cultured human umbilical vein endothelial cells (HUVECs), overexpression of HIF1A prevented ATG7 deficiency-reduced tube formation. Mechanistically, we identified STAT1 (signal transducer and activator of transcription 1) as a transcription suppressor of HIF1A and demonstrated that ablation of Atg7 upregulated STAT1 in an autophagy independent pathway, increased STAT1 binding to HIF1A promoter, and suppressed HIF1A expression. Moreover, lack of ATG7 in the cytoplasm disrupted the association between ATG7 and the transcription factor ZNF148/ZFP148/ZBP-89 (zinc finger protein 148) that is required for STAT1 constitutive expression, increased the binding between ZNF148/ZFP148/ZBP-89 and KPNB1 (karyopherin subunit beta 1), which promoted ZNF148/ZFP148/ZBP-89 nuclear translocation, and increased STAT1 expression. Finally, inhibition of STAT1 by fludarabine prevented the inhibition of HIF1A expression, angiogenesis, and blood flow recovery in atg7 KO mice. Our work reveals that lack of ATG7 inhibits angiogenesis by suppression of HIF1A expression through upregulation of STAT1 independently of autophagy under ischemic conditions, and suggest new therapeutic strategies for cancer and cardiovascular diseases.Abbreviations: ATG5: autophagy related 5; ATG7: autophagy related 7; atg7 KO: endothelial cell-specific atg7 knockout; BECN1: beclin 1; ChIP: chromatin immunoprecipitation; CQ: chloroquine; ECs: endothelial cells; EP300: E1A binding protein p300; HEK293: human embryonic kidney 293 cells; HIF1A: hypoxia inducible factor 1 subunit alpha; HUVECs: human umbilical vein endothelial cells; IFNG/IFN-γ: Interferon gamma; IRF9: interferon regulatory factor 9; KPNB1: karyopherin subunit beta 1; MAP1LC3A: microtubule associated protein 1 light chain 3 alpha; MEFs: mouse embryonic fibroblasts; MLECs: mouse lung endothelial cells; NAC: N-acetyl-l-cysteine; NFKB1/NFκB: nuclear factor kappa B subunit 1; PECAM1/CD31: platelet and endothelial cell adhesion molecule 1; RELA/p65: RELA proto-oncogene, NF-kB subunit; ROS: reactive oxygen species; SP1: Sp1 transcription factor; SQSTM1/p62: sequestosome 1; STAT1: signal transducer and activator of transcription 1; ULK1: unc-51 like autophagy activating kinase 1; ulk1 KO: endothelial cell-specific ulk1 knockout; VSMCs: mouse aortic smooth muscle cells; WT: wild type; ZNF148/ZFP148/ZBP-89: zinc finger protein 148.

Keywords: ATG7; Angiogenesis; HIF1A; STAT1; ZNF148/ZFP148/ZBP-89; endothelial cell; ischemia.


Conflict of interest statement

No potential conflict of interest was reported by the author(s).

Figures

Figure 1.
Figure 1.
Endothelial Atg7 deletion impairs blood perfusion recovery and angiogenesis in mouse ischemic hind limbs. (a) Genotyping of WT (wild-type, Atg f/f/cdh5) and atg7 KO (atg7 endothelial cell specific knockout, Atg7 f/f/cdh5+) mice. (b) Western blot analysis of ATG7 in mouse lung endothelial cells (MLECs) and arterial smooth muscle cells (VSMCs) isolated from WT and atg7 KO mice. (c and d) Femoral artery ligation was performed on 8- to 10-week-old WT and atg7 KO mice. Representative images showing blood flow reperfusion assessed by Doppler laser ultrasound after ischemic injury (c). Blood flow was detected by laser Doppler at the indicated time points. The ratio of ischemic:non-ischemic perfusion, N = 7 for each group. * P < 0.05, ** p < 0.01; *** p< 0.001 (d). (e) Representative images of immunostaining for PECAM1/CD31 in gastrocnemius muscles of mice subjected to femoral artery ligation. Scale bar: 50 µm. (f) Quantification of immunohistochemistry staining for PECAM1/CD31. N = 6 for each group, *** p< 0.001. (g) Representative images of immunostaining for ATG7 in gastrocnemius muscles of mice subjected to femoral artery ligation. Scale bar: 50 µm. (h) Quantification of immunohistochemistry staining for ATG7. N = 7 for each group, * p < 0.05, *** p< 0.001. (i) Representative images of immunostaining for SQSTM1/p62 in gastrocnemius muscles of mice subjected to femoral artery ligation. Scale bar: 20 µm. (j) Quantification of immunohistochemistry staining for SQSTM1/p62. N = 5–6 for each group, ** p < 0.01, ns, not significant.
Figure 2.
Figure 2.
Lack of ATG7 inhibits hypoxia-induced HIF1A expression. (a) Representative images of immunostaining for HIF1A in gastrocnemius muscles of mice subjected to 4-week femoral artery ligation. Scale bar: 50 µm. (b) Quantification of the HIF1A staining area in gastrocnemius muscle. N = 6–7, * p < 0.05, ** p< 0.01. (c) Hif1a mRNA level was determined by RT-PCR. N = 7, * p< 0.05. (d and e) MLECs were cultured in hypoxic chamber (1% O2, 5% CO2, 94% N2) for 24 h, HIF1A protein expression was determined by western blot (d) and densitometry (e). N = 3, *** p< 0.001. (f and g) MLECs were treated with CoCl2 for 24 h. HIF1A protein expression was determined by western blot (f) and densitometry (g). N = 5, * p < 0.05, *** p < 0.001. (h) HIF1A mRNA level in HUVECs transfected with siRNA (siCtrl) or ATG7 siRNA (siATG7) was determined by RT-PCR at indicated time points. N = 6–11, * p< 0.05, ** p< 0.01; ns, not significant. (i and j) HUVECs were transfected with siCtrl, siATG7 and MYC-control (Ctrl) or MYC-HIF1A (HIF1A) plasmid for 24 h and then incubated in hypoxia chamber for another 16 h. HIF1A protein expression was analyzed by western blotting (I) and densitometry (j). N = 5, *** p< 0.001. (k) Representative images of tube formation assay from three independent experiments. Scale bar: 500 μm. (l) Quantitative analysis of the number of sprouts. N = 15 fields, ** p < 0.01, *** p < 0.001.
Figure 3.
Figure 3.
Upregulation of STAT1 inhibits HIF1A expression in ATG7-deficient conditions. (a) Expression of genes related to HIF1A expression, including STAT1, STAT3, NFKB1/NFκB, IRF9, NRF1, BCALF1 was determined by RT-PCR in control and ATG7-deficient HUVECs, N = 5, *** p< 0.001. (b) HUVECs were transfected with siCtrl, siATG7, STAT1 siRNA (siSTAT1), or siATG7 and siSTAT1 for 48 h, HIF1A mRNA expression was determined by RT-PCR. N = 8, * p < 0.05, *** p < 0.001. (c) HUVECs were transfected with siCtrl, siATG7, siSTAT1, or siATG7 and siSTAT1 for 24 h, and then incubated in hypoxic chamber for another 16 h. HIF1A protein level was measured by western blot. (d) Densitometric analysis of the western blots. N = 4, ** p < 0.01, ns, not significant. (e) HUVECs were transfected with Flag-control (Ctrl) or Flag-STAT1 (STAT1) plasmid for 24 h, and then incubated in hypoxia chamber for another 16 h. Protein levels of STAT1 and HIF1A were determined by western blot. (f) Quantitative analysis of HIF1A protein levels. N = 6, * p< 0.05, *** p < 0.001. (g) HUVECs were transfected with STAT1 or Ctrl plasmid for 24 h, HIF1A mRNA was determined by RT-PCR. N = 4, * p < 0.05. (h and i) HUVECs were transfected with siCtrl or siATG7 for 48 h and followed by hypoxia stimulation for 1 h. ChIP analysis was performed to determine the association of STAT1 and HIF1A promoter region. (h) RT-PCR products were analyzed by ethidium bromide-stained gel analysis. (I) RT-PCR quantitative analysis. N = 4, * p< 0.05, ** p < 0.01.
Figure 4.
Figure 4.
Deletion of Atg7 increases STAT1 expression but reduces tube formation. (a) The protein levels of SQSTM1/p62 and MAP1LC3A/LC3-II:LC3-I were determined by western blot in MLECs isolated from WT and atg7 KO mice. (b) Densitometric analysis of the blots. N = 3, ** p < 0.01; *** p < 0.001. (c and d) WT and atg7 KO MLECs were treated with or without chloroquine (CQ, 3 µM) for 24 h, MAP1LC3A/LC3-II:LC3-I protein level was detected by western blot. Densitometric analysis of the blots. N = 3, ** p < 0.01, *** p < 0.001. (e) Stat1 mRNA expression was detected by RT-PCR in MLECs isolated from WT and atg7 KO mice. N = 4, ** p < 0.01. (f) STAT1 and phospho-STAT1 (Y701) protein levels were measured by western blot. (g) Quantitative analysis of STAT1 and phosphorylated STAT1 at tyrosine 701 (Y701; p-STAT1) protein expression, N = 3–6, ** p < 0.01, *** p < 0.001. (h) Western blot analysis of phosphorylated STAT3 at serine 727 (S727; p-STAT3), phosphorylated STAT5 at tyrosine 694 (Y694; p-STAT5), and phosphorylated STAT6 at tyrosine 641 (Y641; p-STAT6) in MLECs from WT and atg7 KO mice. (i) Densitometric analysis of the blots. (j) HUVECs were transfected with siCtrl, siATG7, or ULK1 siRNA (siULK1) for 48 h, SQSTM1/p62 and MAP1LC3A/LC3-II:LC3-I protein levels were analyzed by western blot. (k) Quantitative analysis of the blots. N = 4–11, ** p < 0.01. (l) HUVECs were transfected with siCtrl, siATG7, or siULK1 for 48 h, levels of total STAT1 and p-STAT1 (Y701) were measured by western blot. (m) Quantitative analysis of STAT1 and p-STAT1 (Y701) protein expression. N = 4–9, ns, not significant. (n) HUVECs were transfected with control and STAT1 plasmid for 24 h, protein levels of STAT1 and p-STAT1 (Y701) were detected by western blot. (o and p) HUVECs were transfected with siCtrl or siATG7 for 48 h, and the cells were treated with vehicle or N-acetyl-l-cysteine (NAC, 1 mM) for additional 1 h. p-STAT1 (Y701) protein expression was measured by western blot. N = 3, *** p < 0.001, ns, not significant. (q) Tube formation assay was performed in MLECs isolated from WT and atg7 KO mice. Representative images selected from 4 independent experiments. Scale bar: 1 mm. (r) Quantitative analysis of the number of sprouts. N = 12 fields, * p < 0.05.
Figure 5.
Figure 5.
Overexpression of ATG7 does not affect STAT1 protein expression and tube formation. (a) HUVECs were transfected with MYC-control (Ctrl) or MYC-ATG7 (ATG7) plasmid for 24 h. (b and c) SQSTM1/p62 and MAP1LC3A/LC3-II:LC3-I protein expression was measured by western blot. Densitometric analysis of the blots, N = 4–5, ** P < 0.01. (d) STAT1 and phospho-STAT1 (Y701) protein levels were analyzed by western blot. (e and f) Densitometric analysis of the blots, N = 7, ns, not significant. (g) STAT1 mRNA level was determined in by RT-PCR. N = 4, ns, not significant. (h) Tube formation assay was performed 24 h after transfection of Ctrl or ATG7 plasmid, three independent experiments. (i) Quantitative analysis of sprout number, N = 28 fields, ns, not significant. Scale bar: 1 mm.
Figure 6.
Figure 6.
Suppression of STAT1 recovers the potential of tube formation in HUVECs. (a-d) HUVECs were transfected with siCtrl or siATG7 and treated with STAT1 inhibitor, fludarabine phosphate (Fluda, 50 μM) for 24 h. (a) Total STAT1 and p-STAT1 (Y701) protein levels were measured by western blot. (b) Densitometric analysis of p-STAT1 (Y701), N = 4, * p < 0.05, ** p < 0.01. (c) Tube formation assay was performed after the treatment. Scale bar: 1 mm. (d) Quantification of the number of sprouts. Three independent experiments. N = 13–22 fields, ** p< 0.01, *** p< 0.001. (e-h) HUVECs were transfected with siCtrl, siATG7, siSTAT1, or siATG7 and siSTAT1. (e) Protein levels of ATG7 and STAT1 were determined by western blot. (f) The quantification analysis of the blots. N = 4, * p < 0.05, ** p < 0.01. (g) Tube formation assay was performed after the treatment. Scale bar: 1 mm. (h) Quantification of the number of sprouts. Three independent experiments. N = 14–16 fields, *** p< 0.001.
Figure 7.
Figure 7.
Lack of ATG7 increases ZNF148/ZFP148/ZBP-89 nuclear translocation and STAT1 expression. (a) Western blot analysis of STAT1, p-STAT1 (Y701), and ZNF148/ZBP-89 in HUVECs transfected with siCtrl or ZNF148 siRNA (siZNF148). (b) STAT1 mRNA level was analyzed by RT-PCR. N = 3, *** p < 0.001. (c and d) Representative images of immunofluorescence staining of ZFP148/ZNF148 (C). Quantitative analysis of immunofluorescence intensity of ZFP148/ZNF148. Four independent experiments. N = 37–39 cells, *** p < 0.001 (D). (e) ZFP148/ZNF148 protein expression was measured by western blot in whole cell lysates (W), cytosol (C), and nuclear (N) fractions in MLECs isolated form WT and atg7 KO mice. (f and g) Quantitative analysis of nuclear ZFP148/ZNF148 protein levels in cell fractions, N = 4, * p < 0.05. (h) Zfp148 mRNA level was detected by RT-PCT in WT and atg7 KO MLECs. N = 5; ns, not significant. (i and j) The interaction between ATG7 and ZNF148/ZBP-89 was detected by immunoprecipitation (IP) and western blot (IB). N = 3. (k) HUVECs were transfected with siCtrl, siATG7, siZNF148, or siATG7 and siZNF148 for 48 h. STAT1 mRNA level was measured by RT-PCR. N = 4, *** p < 0.001.
Figure 8.
Figure 8.
Lack of ATG7 increases the binding between ZNF148/ZFP148/ZBP-89 and KPNB1. (a and b) Determine the potential interacting proteins with ATG7 in HUVECs. ATG7 was immunoprecipitated by ATG7 antibody, and EP300, SP1, and STAT3 were determined by western blotting. (c) Cell lysates were prepared from cultured HUVECs, TP53 was immunoprecipitated, and ZNF148/ZBP-89 was detected by western blot. N = 3. (d and e) HEK 293 T cells were transfected with MYC-ATG7 plasmid and GST-control (GST) or GST fused with ZNF148/ZBP-89 full length or ZNF148/ZBP-89 truncations (amino acids 1–168, 169–281, 282–552, 553–794), respectively. Binding region of ZNF148/ZBP-89 on ATG7 was determined by GST immunoprecipitation. N = 4. (f) HEK 293 T cells were transfected with siCtrl or siATG7 for 48 h, the interaction of ZNF148/ZBP-89 and KPNB1 was determined by immunoprecipitation and western blot. N = 3. (g) The interaction of ZFP148/ZNF148 and KPNB1 in MLECs isolated from WT and atg7 KO mice was determined by immunoprecipitation and western blot. N = 3.
Figure 9.
Figure 9.
Inhibition of STAT1 by fludarabine recovers blood flow in ischemic hind limbs of atg7 KO mice. Femoral artery ligation was performed in 8- to 10-week-old WT and atg7 KO mice. Fludarabine phosphate was administrated 1 week post ligation (100 mg/kg, i.p., once every other day). Blood flow was detected by Laser Doppler Imaging at the indicated time points. (a) Immunohistochemical staining of p-STAT1 (Y701) in the gastrocnemius muscular tissue. (b) Quantification of p-STAT1 (Y701)-positive staining area. N = 4–6, * p < 0.05, *** p < 0.001, ns, not significant. (c) Western blot analysis was used to determine HIF1A protein expression in gastrocnemius muscular tissue in WT and atg7 KO mice. (d) Densitometry analysis quantification of western blot, the ratio of ischemic limb to sham-surgery limb, N = 7–9, * p< 0.05, ** p< 0.01. S: Sham, I: Ischemia. (e) Representative images showing blood flow reperfusion assessed by Doppler laser ultrasound after ischemic injury. (f) The ratio of ischemic:non-ischemic perfusion, N = 4–7, ** p < 0.01. (g) Immunohistochemical staining of PECAM1/CD31 in the gastrocnemius muscular tissue. (h) Quantitative analysis of the ratio of PECAM1/CD31-positive staining area to muscular area, N = 4–6, ** p < 0.01; ns, not significant.

References

    1. Potente M, Gerhardt H, Carmeliet P.. Basic and therapeutic aspects of angiogenesis. Cell. 2011. Sep 16; 146(6):873–887. - PubMed
    1. Folkman J. Angiogenesis in cancer, vascular, rheumatoid and other disease. Nat Med. 1995. Jan;1(1):27–31. - PubMed
    1. Inampudi C, Akintoye E, Ando T, et al. Angiogenesis in peripheral arterial disease. Curr Opin Pharmacol. 2018. Apr;39:60–67. - PubMed
    1. Melincovici CS, Bosca AB, Susman S, et al. Vascular endothelial growth factor (VEGF) - key factor in normal and pathological angiogenesis. Rom J Morphol Embryol. 2018;59(2):455–467. - PubMed
    1. Zhu HF, Wan D, Luo Y, et al. Catalpol increases brain angiogenesis and up-regulates VEGF and EPO in the rat after permanent middle cerebral artery occlusion. Int J Biol Sci. 2010. Aug 20;6(5):443–453. - PMC - PubMed

Publication types