. 2022 Oct 27:11:e79924.
doi: 10.7554/eLife.79924.

HIV skews the SARS-CoV-2 B cell response towards an extrafollicular maturation pathway

Collaborators, Affiliations

HIV skews the SARS-CoV-2 B cell response towards an extrafollicular maturation pathway

Robert Krause et al. Elife. .

Abstract

Background: HIV infection dysregulates the B cell compartment, affecting memory B cell formation and the antibody response to infection and vaccination. Understanding the B cell response to SARS-CoV-2 in people living with HIV (PLWH) may explain the increased morbidity, reduced vaccine efficacy, reduced clearance, and intra-host evolution of SARS-CoV-2 observed in some HIV-1 coinfections.

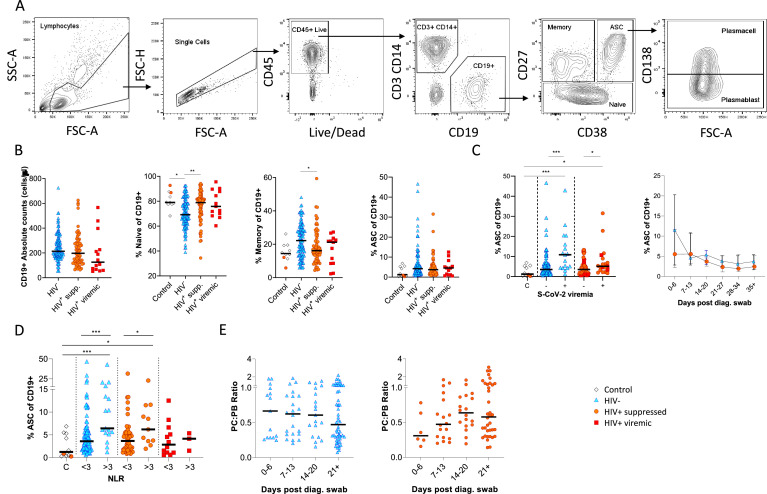
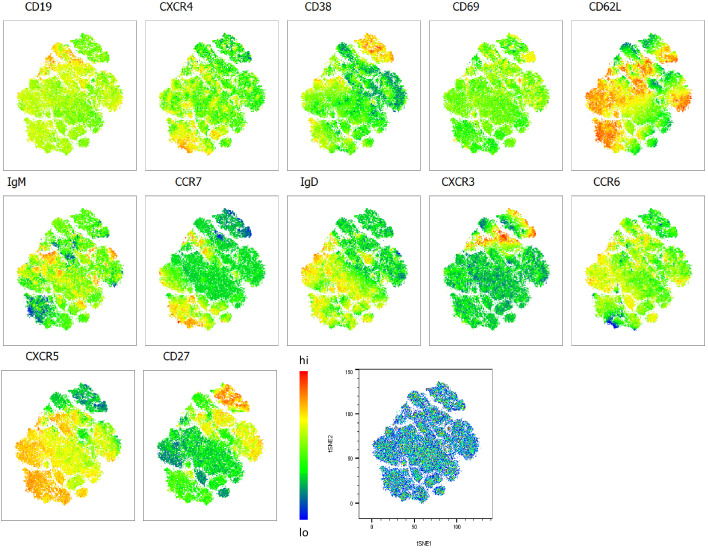
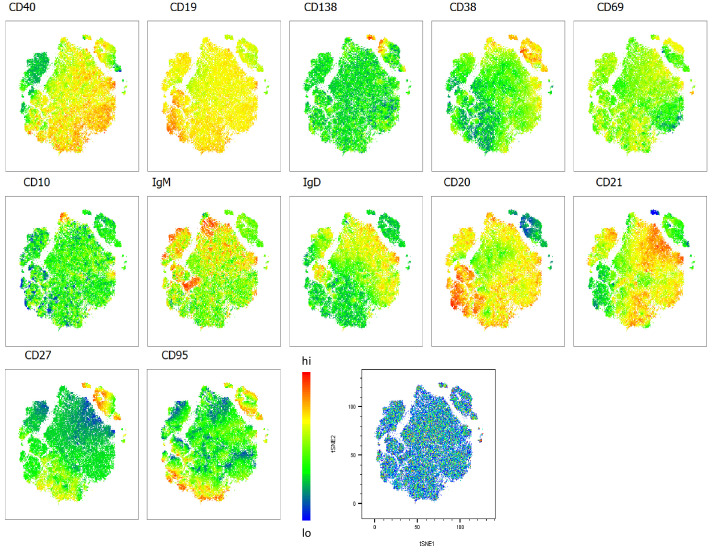
Methods: We compared B cell responses to COVID-19 in PLWH and HIV negative (HIV-ve) patients in a cohort recruited in Durban, South Africa, during the first pandemic wave in July 2020 using detailed flow cytometry phenotyping of longitudinal samples with markers of B cell maturation, homing, and regulatory features.

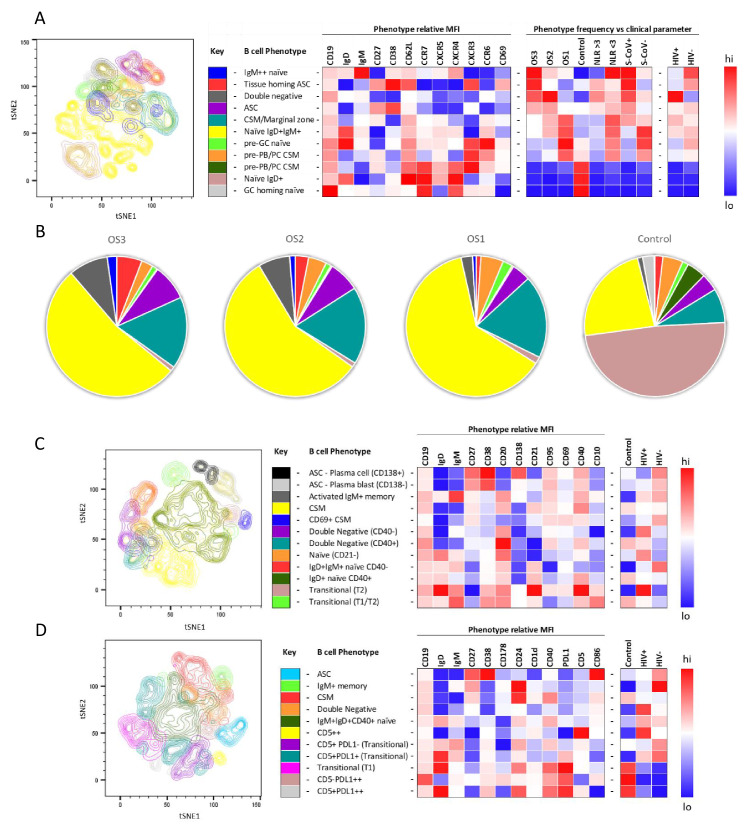
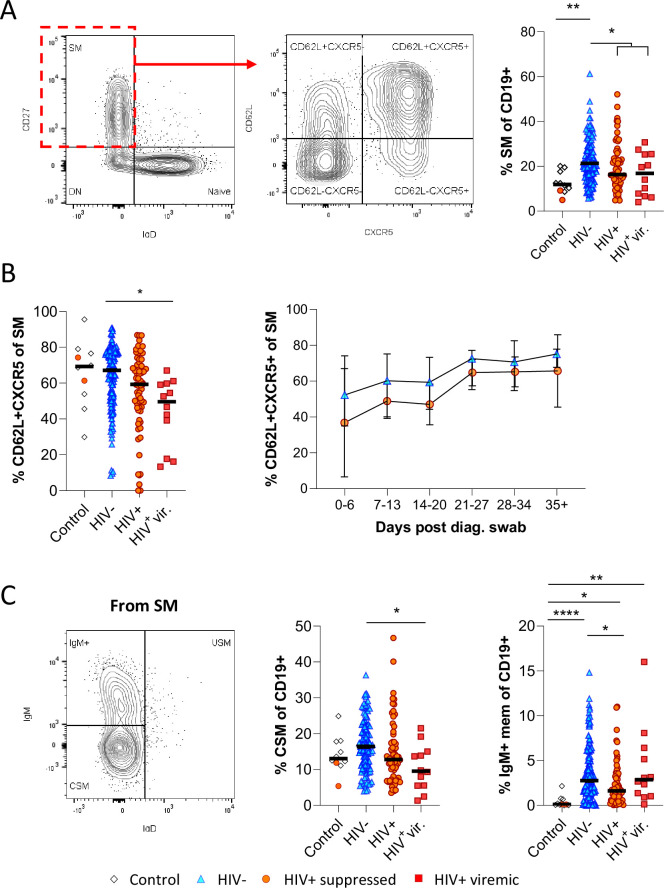
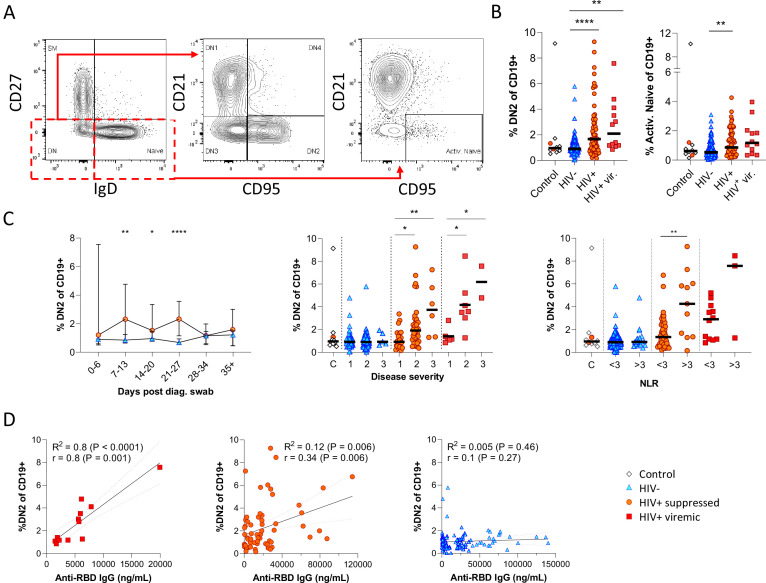
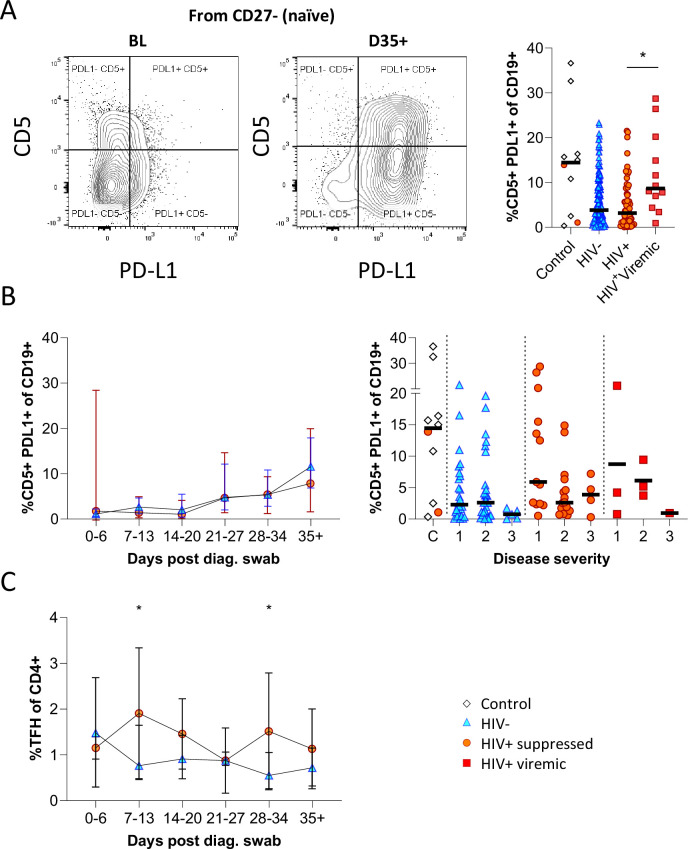
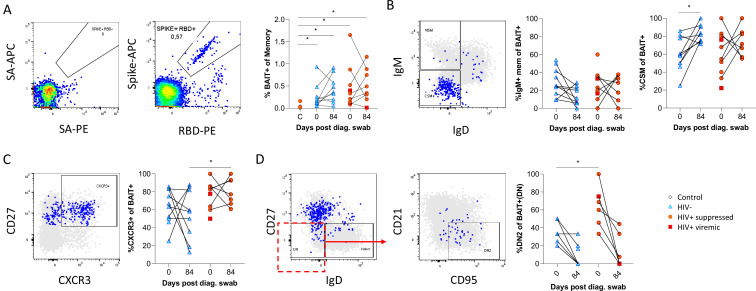
Results: This revealed a coordinated B cell response to COVID-19 that differed significantly between HIV-ve and PLWH. Memory B cells in PLWH displayed evidence of reduced germinal centre (GC) activity, homing capacity, and class-switching responses, with increased PD-L1 expression, and decreased Tfh frequency. This was mirrored by increased extrafollicular (EF) activity, with dynamic changes in activated double negative (DN2) and activated naïve B cells, which correlated with anti-RBD-titres in these individuals. An elevated SARS-CoV-2-specific EF response in PLWH was confirmed using viral spike and RBD bait proteins.

Conclusions: Despite similar disease severity, these trends were highest in participants with uncontrolled HIV, implicating HIV in driving these changes. EF B cell responses are rapid but give rise to lower affinity antibodies, less durable long-term memory, and reduced capacity to adapt to new variants. Further work is needed to determine the long-term effects of HIV on SARS-CoV-2 immunity, particularly as new variants emerge.

Funding: This work was supported by a grant from the Wellcome Trust to the Africa Health Research Institute (Wellcome Trust Strategic Core Award [grant number 201433/Z/16/Z]). Additional funding was received from the South African Department of Science and Innovation through the National Research Foundation (South African Research Chairs Initiative [grant number 64809]), and the Victor Daitz Foundation.

Keywords: B cell; COVID-19; HIV; RBD; SARS-CoV-2; epidemiology; global health; human; immunology; inflammation; spike.


Conflict of interest statement

RK, JS, HS, DM, FK, YG, AN, YZ, IG, MB, KK, MM, NM, DR, OL, JJ, DS, IW, AS, HK, TN, AL No competing interests declared, WH Reviewing editor, eLife

Figures

Figure 1.
Figure 1.. Canonical B cell phenotype frequencies vary with HIV status but still mount robust antibody-secreting cell (ASC) responses.
(A) Gating strategy to identify CD19+ B cells within the peripheral blood mononuclear cell (PBMC) compartment. B cells were further gated on CD27 and CD38 to identify CD27+ Memory, CD27- Naïve, and CD27+CD38++ ASC. (B) Absolute B cell counts were calculated from patient total lymphocyte counts, followed by percent Naïve, Memory, and ASC fractions of the CD19+ parent population. These data represent the total combined frequencies over all time points per patient group. (C) The ASC response associated with SARS-CoV-2 viremia and was tracked longitudinally up to day 35 post diagnosis. Error bars indicate standard deviation (HIV- n = 37; HIV+ n = 33). (D) A neutrophil-lymphocyte ratio (NLR) served as a proxy of inflammation and associated with the ASC as well as plasmablast and plasma cell responses. Statistical analyses were performed using the Kruskal-Wallis H test for multiple comparisons and Mann-Whitney for SARS-CoV-2 viremia or NLR comparisons within groups. p Values are denoted by *≤0.05; **<0.01; ***<0.001, and ****<0.0001.
Figure 1—figure supplement 1.
Figure 1—figure supplement 1.. Individual patient longitudinal antibody-secreting cell (ASC) responses.
Figure 2.
Figure 2.. tSNE analysis of the B cell phenotypes and frequencies relative to COVID-19 clinical parameters including disease severity, neutrophil lymphocyte ratio, SARS-CoV-2 viremia, and HIV status.
A total of 80,000 CD19+ B cells, all sampled at baseline, from four patient groups (20,000 cells per group) were used in an unbiased tSNE analysis. Patients were grouped by decreasing disease severity according to an ordinal scale ranging from 3 to 1 (OS3 to 1) and a healthy control group. There was an equal contribution from people living with HIV (PLWH) and HIV-ve patients per group except for the control group. Three B cell phenotyping panels were used, focusing on homing (A, B), maturation (C), and regulatory (D) markers. Each panel included an anchor panel of CD19, IgD, IgM, CD27, and CD38. The key to the colouring of the different tSNE clusters is included alongside with a description of the phenotype. The phenotype is then depicted as a heatmap of the median fluorescence intensity (MFI) of each surface marker within that cluster, followed by a heatmap of the cluster frequency relative to ordinal scale (OS3 to 1); neutrophil-lymphocyte ratio (NLR) cut-off of 3.0 to separate moderate and mild inflammation, SARS-CoV-2 viremia (S-CoV), and HIV status. (B) The frequency of each B cell phenotypic cluster identified by tSNE depicted as pie charts, separated based on disease severity (OS3 to 1) and controls.
Figure 2—figure supplement 1.
Figure 2—figure supplement 1.. Heatmap overlays B cell compartment tSNE plots focusing on homing markers.
A total of 80,000 CD19+ B cells were used in an unbiased tSNE analysis of the B cell compartment with increasing disease severity ranked by ordinal scale 1–3 (OS1 to 3) and in healthy controls (Control). This means a total of 20,000 CD19+ B cells were contributed by each group. The B cell homing marker expression is represented as a heatmap with high (red) to low (blue) fluorescence intensity depicted.
Figure 2—figure supplement 2.
Figure 2—figure supplement 2.. Heatmap overlays B cell compartment tSNE plots focusing on maturation markers.
A total of 80,000 CD19+ B cells were used in an unbiased tSNE analysis of the B cell compartment with increasing disease severity ranked by ordinal scale 1–3 (OS1 to 3) and in healthy controls (Control). This means a total of 20,000 CD19+ B cells were contributed by each group. The B cell maturation marker expression is represented as a heatmap with high (red) to low (blue) fluorescence intensity depicted.
Figure 2—figure supplement 3.
Figure 2—figure supplement 3.. Heatmap overlays B cell compartment tSNE plots focusing on regulatory markers.
A total of 80,000 CD19+ B cells were used in an unbiased tSNE analysis of the B cell compartment with increasing disease severity ranked by ordinal scale 1–3 (OS1 to 3) and in healthy controls (Control). This means a total of 20,000 CD19+ B cells were contributed by each group. The B cell regulatory marker expression is represented as a heatmap with high (red) to low (blue) fluorescence intensity depicted.
Figure 3.
Figure 3.. Reduced germinal centre homing and class switching of memory B cells in HIV viremic COVID-19 patients.
(A) Gating strategy for total switched memory (SM; CD27+ IgD-) and homing to germinal centres (CD62L+ CXCR5+) and comparison of SM with respect to HIV status. (B) Germinal centre homing capacity relative to HIV status and longitudinal comparison. Error bars indicate standard deviation (HIV- n = 37; HIV+ n = 33). (C) The SM was further gated on IgM and IgD to identify IgM+ memory and class switched (IgM-IgD-) B cells. Both responses were compared with respect to HIV status. Statistical analyses were performed using the Kruskal-Wallis H test for multiple comparisons. p Values are denoted by *≤0.05; **<0.01; ***<0.001, and ****<0.0001.
Figure 3—figure supplement 1.
Figure 3—figure supplement 1.. Individual patient longitudinal switched memory germinal centre (GC) homing responses.
Figure 4.
Figure 4.. Pronounced extrafollicular B cell activation in people living with HIV (PLWH).
(A) Naïve (CD27- IgD+) and double negative (DN; CD27- IgD-) B cell activation was measured as a CD21- CD95+ phenotype. The respective activated populations are thus DN2 and activated naïve. (B) Prevalence of the DN2 and activated naïve phenotypes with respect to HIV status. (C) The DN2 frequencies were tracked longitudinally and with respect to disease severity (ordinal scale 1–3) and neutrophil-lymphocyte ratio (NLR), respectively. Error bars indicate standard deviation (HIV- n = 37; HIV+ n = 33). (D) Spearman non-parametric correlation of the DN2 B cell response relative to the anti-receptor binding domain (RBD) antibody titre. Statistical analyses were performed using the Kruskal-Wallis H test for multiple comparisons and Mann-Whitney for disease severity or NLR comparisons within groups. p Values are denoted by *≤0.05; **<0.01; ***<0.001, and ****<0.0001.
Figure 4—figure supplement 1.
Figure 4—figure supplement 1.. Extended phenotyping of double negative (DN) B cells.
Gating DN B cells for CD21 vs. CXCR5 revealed two dominant populations being either double positive or negative for both markers (A). CD11c and CD95 surface expression on DN B cells correlated positively (B). The frequency of DN2 and active naïve B cells were related to SARS-CoV-2 viral load (C).
Figure 4—figure supplement 2.
Figure 4—figure supplement 2.. Individual patient longitudinal DN2 and activated naïve B cell responses and detailed analysis of the activated naïve B cell response.
Individual longitudinal DN2 (A (i)) and activated naïve (A (ii)) B cell responses. (B) The activated naïve B cell frequencies were tracked longitudinally and with respect to disease severity (ordinal scale 1–3) and neutrophil-lymphocyte ratio (NLR), respectively. Error bars indicate standard deviation (HIV- n = 37; HIV+ n = 33). (C) Spearman non-parametric correlation of the activated naïve B cell response relative to the anti-receptor binding domain (RBD) antibody titre. Statistical analyses were performed using the Kruskal-Wallis H test for multiple comparisons and Mann-Whitney for disease severity or NLR comparisons within groups. p Values are denoted by *≤0.05; **<0.01; ***<0.001, and ****<0.0001.
Figure 5.
Figure 5.. CD5+ PD-L1+ regulatory B cells contract during early response to infection.
(A) Baseline (BL) and day 35 (D35+) example plots of a patient’s CD5+ PD-L1+ regulatory B cell response. These cells were gated from the total naïve (CD27-) B cell population and their frequencies compared relative to HIV status. (B) This response was tracked longitudinally and relative to disease severity (ordinal scale 1–3) and controls denoted as ‘C’. In (C) the corresponding CD4+ T follicular helper (Tfh) response was tracked longitudinally. Error bars indicate standard deviation (HIV- n = 37; HIV+ n = 33). Statistical analyses were performed using the Kruskal-Wallis H test for multiple comparisons and Mann-Whitney for disease severity. p Values are denoted by *≤0.05; **<0.01; ***<0.001, and ****<0.0001.
Figure 5—figure supplement 1.
Figure 5—figure supplement 1.. Individual patient longitudinal CD5+ PDL1+ B cell and T follicular helper (Tfh) responses.
Figure 6.
Figure 6.. SARS-CoV-2 spike and receptor binding domain (RBD)-specific B cell responses highlight an upregulated extrafollicular response in people living with HIV (PLWH).
The ancestral D614G viral spike (Spike-APC) and receptor binding domain (RBD-PE) proteins were used as baits to detect SARS-CoV-2-specific B cells with SA-APC and SA-PE used as controls (A). The bait-specific B cells were then overlaid onto an IgM vs. IgD plot (B). The extent of IgM-only memory and class switched memory (CSM) B cells were compared at both baseline (day 0) and day 84 post diagnosis. (C) Similarly, the level of CXCR3 expression was assessed. (D) The extent of double negative (DN) B cell activation (CD21- CD95+) was compared regarding HIV status at both time points. Statistical analyses were performed using Wilcoxon and Mann-Whitney tests. p Values are denoted by *≤0.05; **<0.01; ***<0.001, and ****<0.0001.

References

    1. Amu S, Ruffin N, Rethi B, Chiodi F. Impairment of B-cell functions during HIV-1 infection. AIDS. 2013;27:2323–2334. doi: 10.1097/QAD.0b013e328361a427. - DOI - PubMed
    1. Austin JW, Buckner CM, Kardava L, Wang W, Zhang X, Melson VA, Swanson RG, Martins AJ, Zhou JQ, Hoehn KB, Fisk JN, Dimopoulos Y, Chassiakos A, O’Dell S, Smelkinson MG, Seamon CA, Kwan RW, Sneller MC, Pittaluga S, Doria-Rose NA, McDermott A, Li Y, Chun T-W, Kleinstein SH, Tsang JS, Petrovas C, Moir S. Overexpression of T-bet in HIV infection is associated with accumulation of B cells outside germinal centers and poor affinity maturation. Science Translational Medicine. 2019;11:eaax0904. doi: 10.1126/scitranslmed.aax0904. - DOI - PMC - PubMed
    1. Bautista D, Vásquez C, Ayala-Ramírez P, Téllez-Sosa J, Godoy-Lozano E, Martínez-Barnetche J, Franco M, Angel J. Differential expression of igm and igd discriminates two subpopulations of human circulating igm+igd+CD27+ B cells that differ phenotypically, functionally, and genetically. Frontiers in Immunology. 2020;11:736. doi: 10.3389/fimmu.2020.00736. - DOI - PMC - PubMed
    1. Bhaskaran K, Rentsch CT, MacKenna B, Schultze A, Mehrkar A, Bates CJ, Eggo RM, Morton CE, Bacon SCJ, Inglesby P, Douglas IJ, Walker AJ, McDonald HI, Cockburn J, Williamson EJ, Evans D, Forbes HJ, Curtis HJ, Hulme WJ, Parry J, Hester F, Harper S, Evans SJW, Smeeth L, Goldacre B. HIV infection and COVID-19 death: a population-based cohort analysis of UK primary care data and linked national death registrations within the opensafely platform. The Lancet. HIV. 2021;8:e24–e32. doi: 10.1016/S2352-3018(20)30305-2. - DOI - PMC - PubMed
    1. Cagigi A, Mowafi F, Phuong Dang LV, Tenner-Racz K, Atlas A, Grutzmeier S, Racz P, Chiodi F, Nilsson A. Altered expression of the receptor-ligand pair CXCR5/CXCL13 in B cells during chronic HIV-1 infection. Blood. 2008;112:4401–4410. doi: 10.1182/blood-2008-02-140426. - DOI - PubMed

Publication types

Substances