. 2022 Oct 27:11:e79647.
doi: 10.7554/eLife.79647.

Wide-ranging consequences of priority effects governed by an overarching factor

Affiliations

Wide-ranging consequences of priority effects governed by an overarching factor

Callie R Chappell et al. Elife. .

Abstract

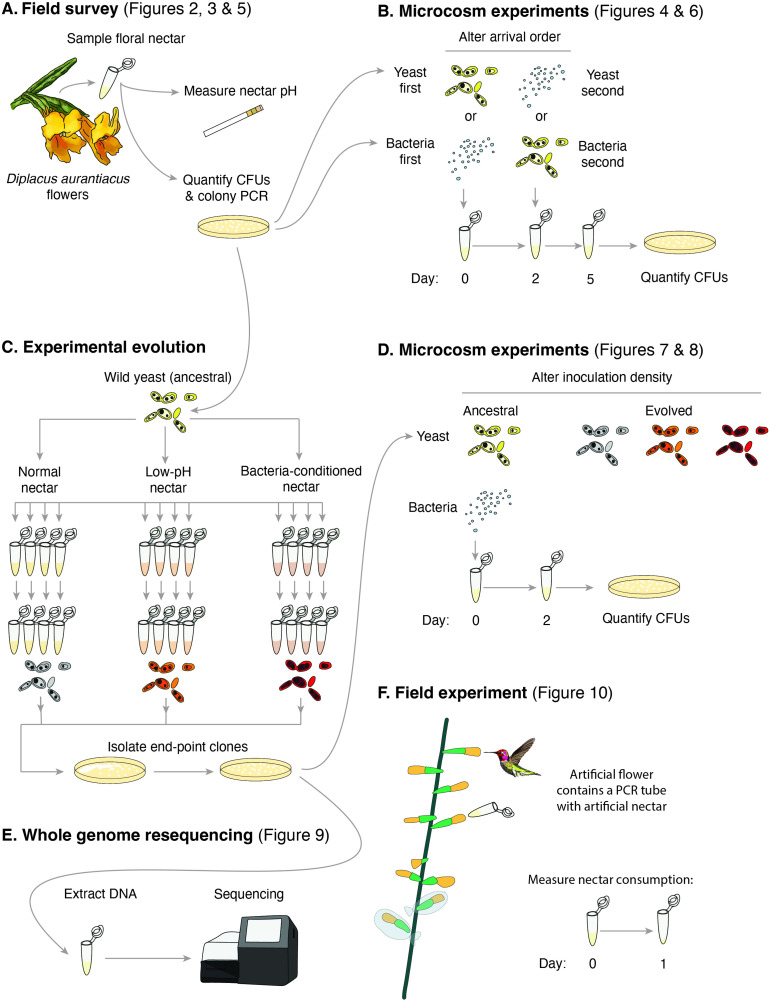
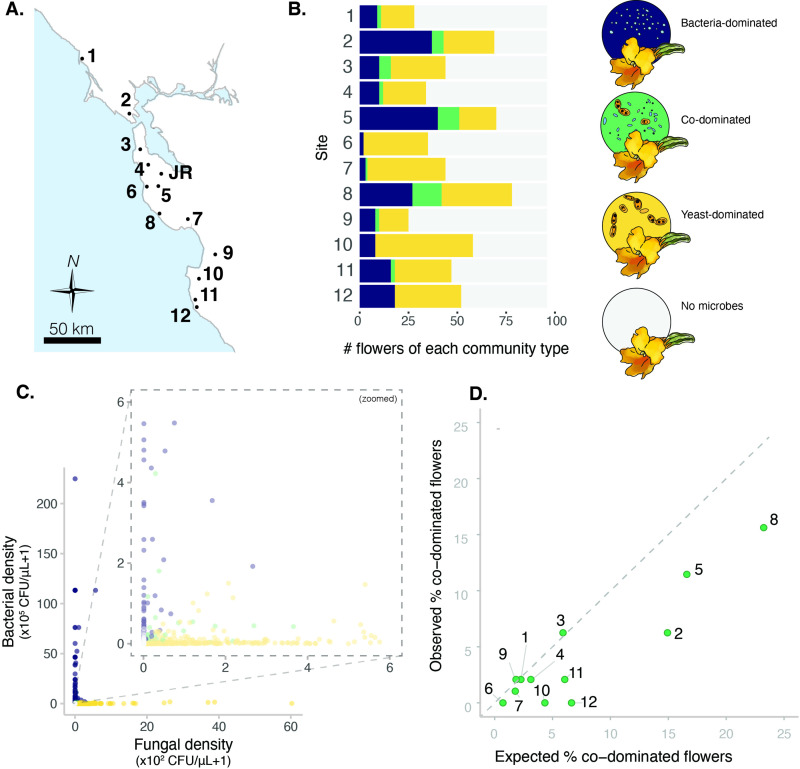
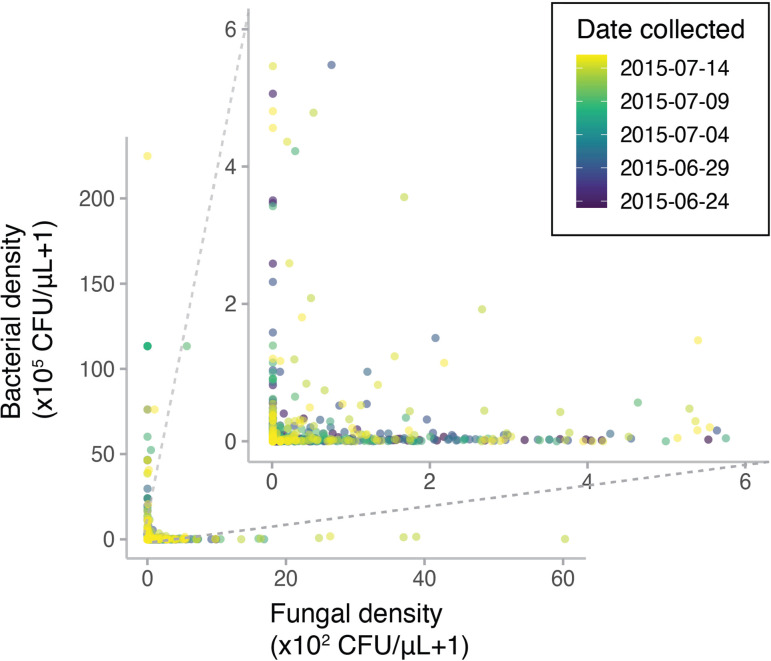
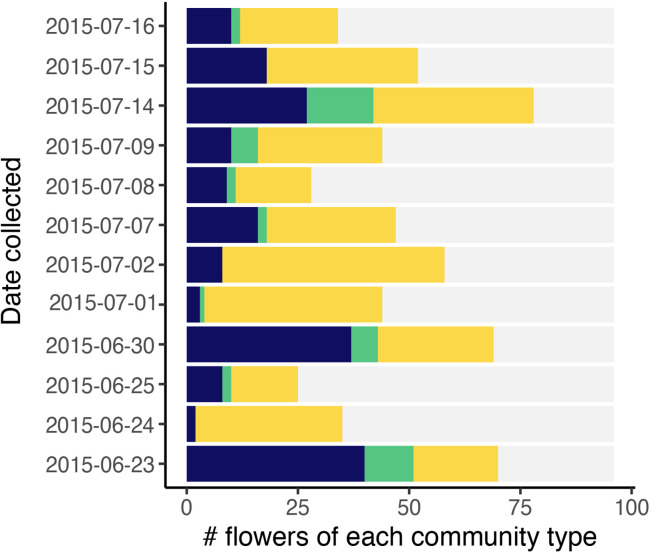
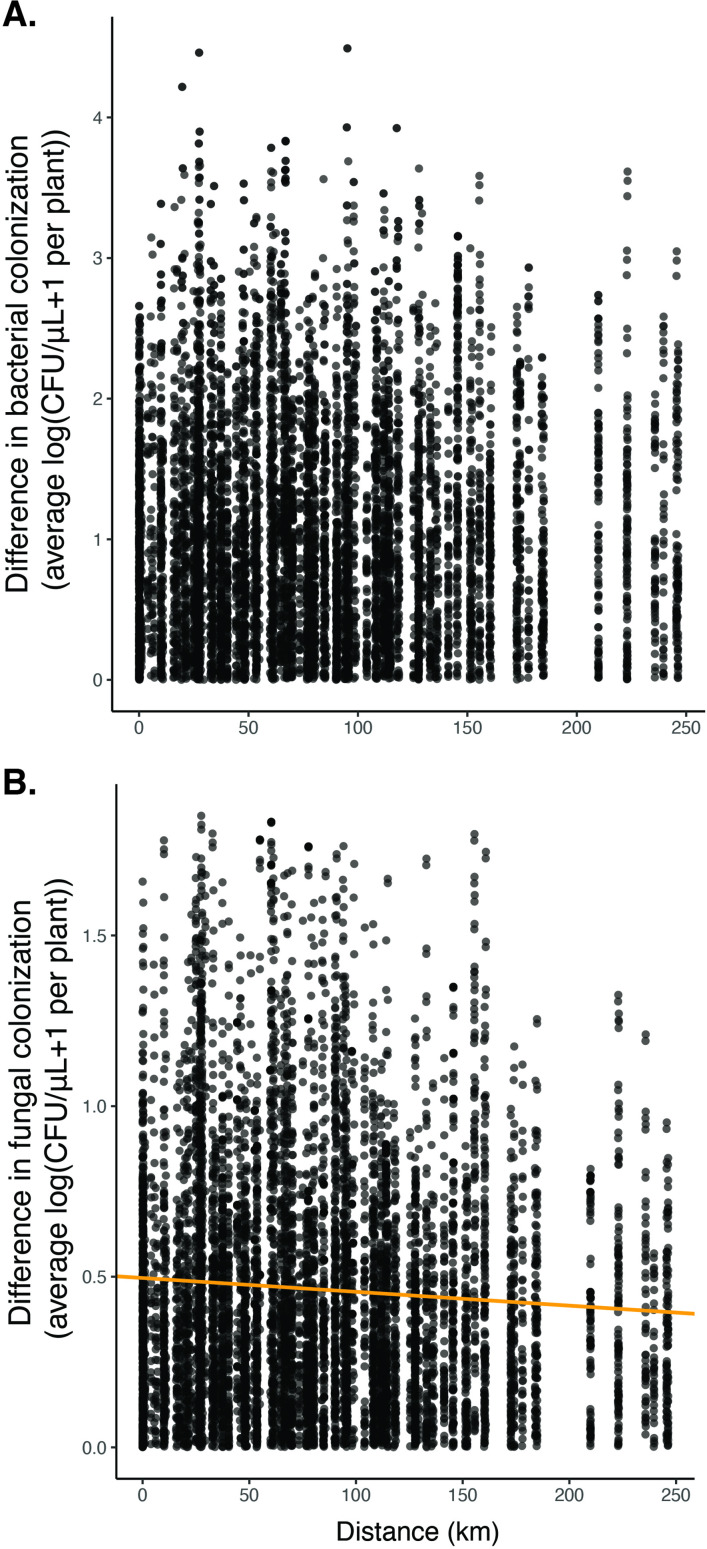
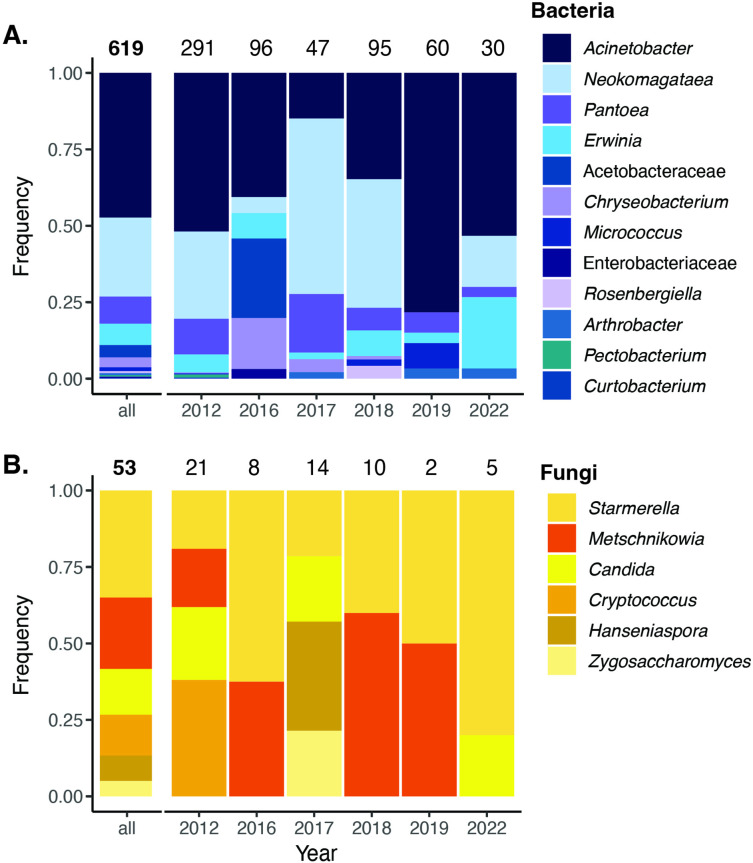
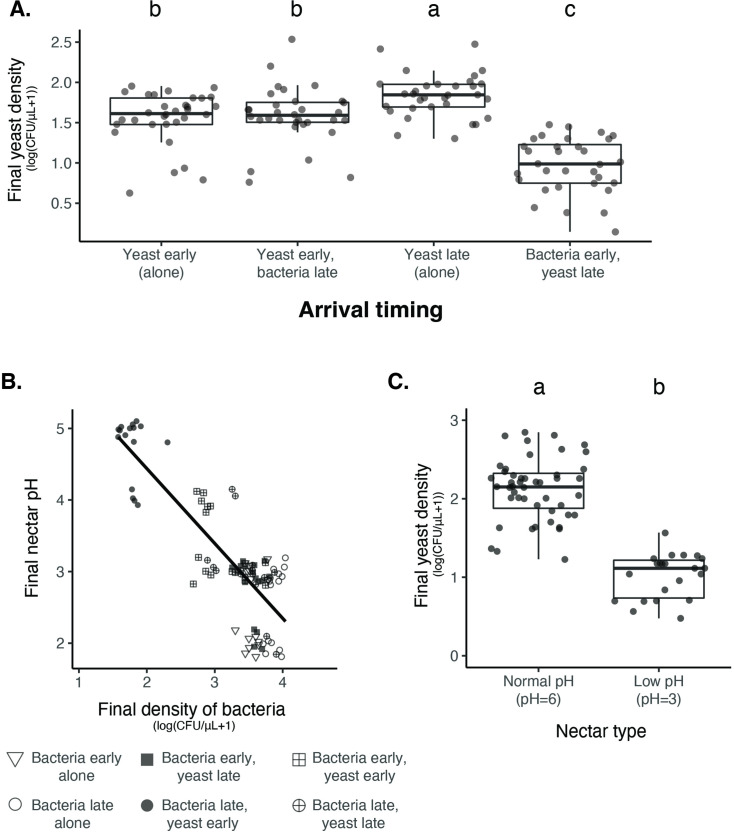
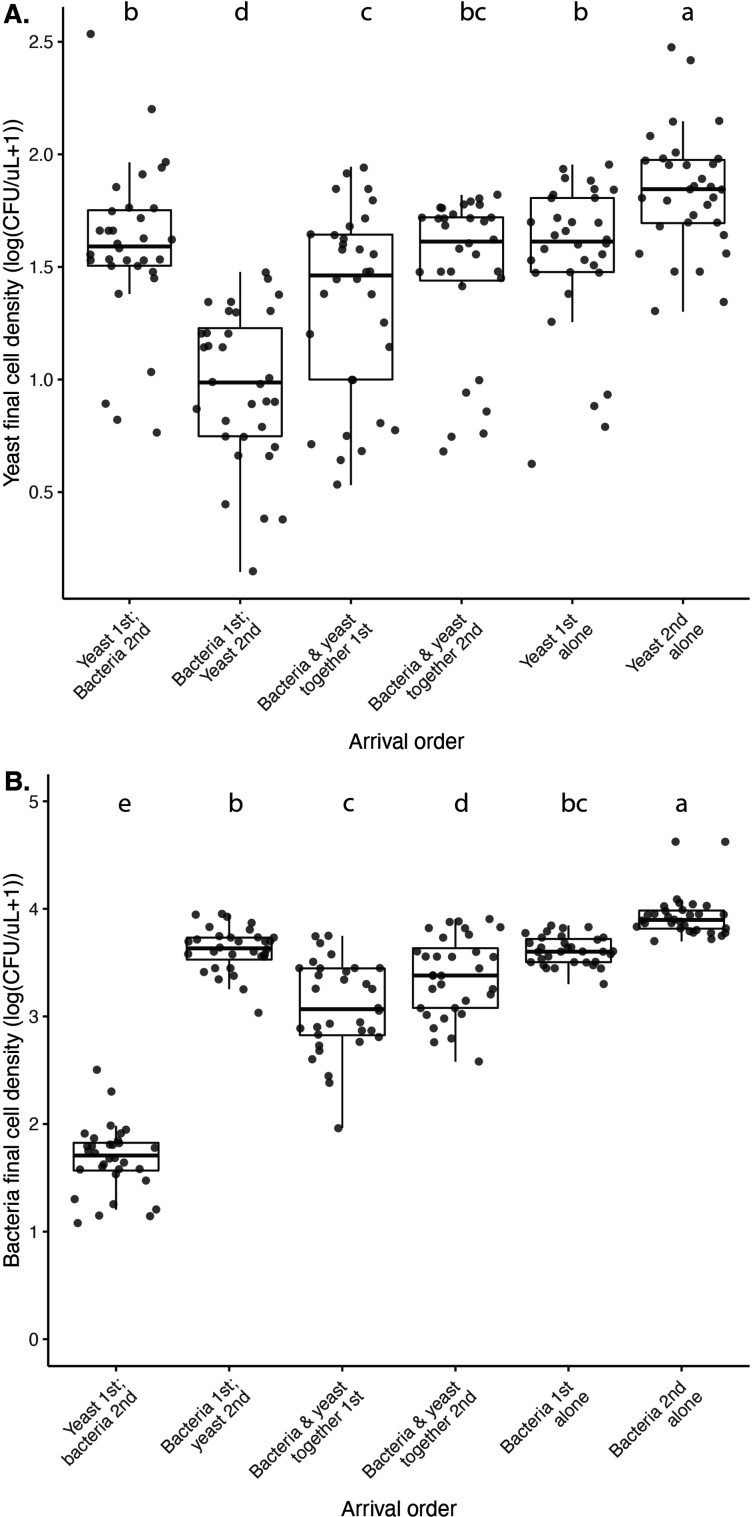
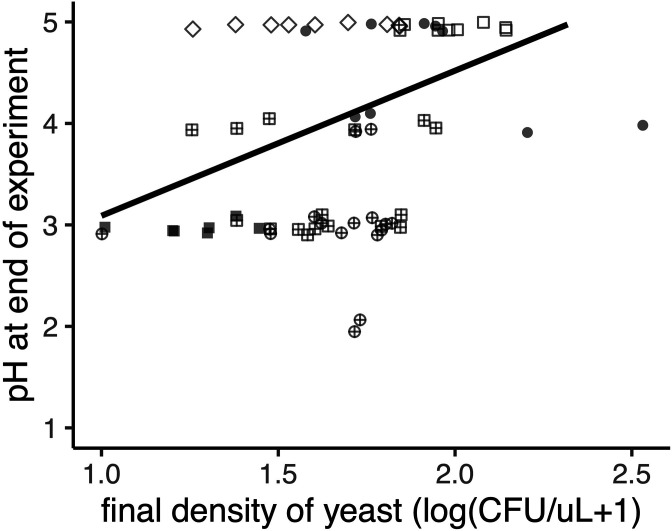
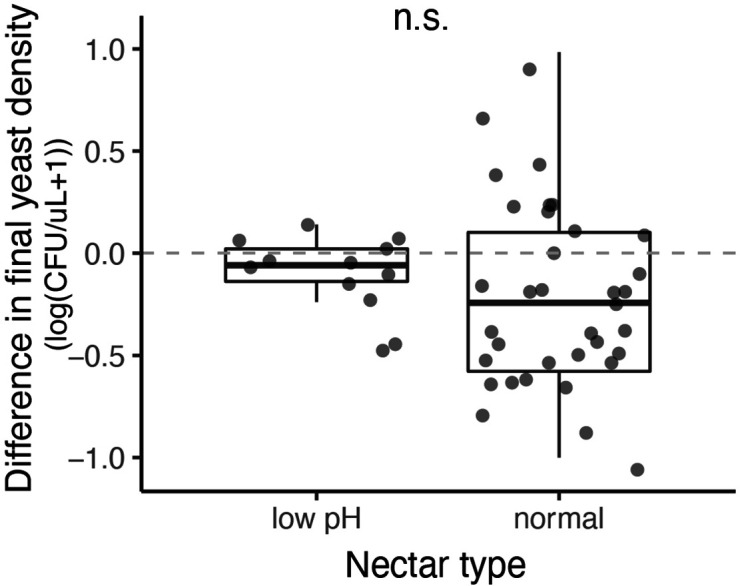
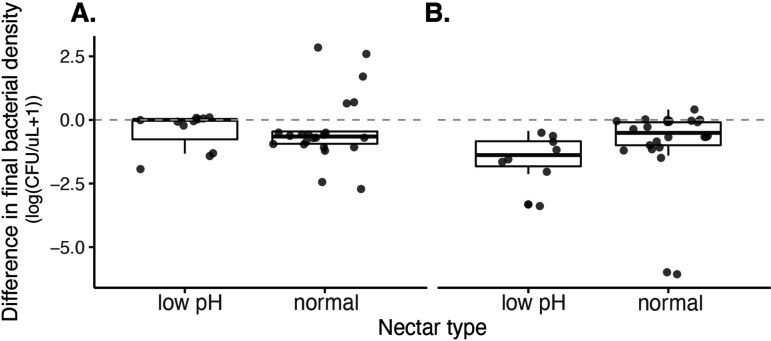
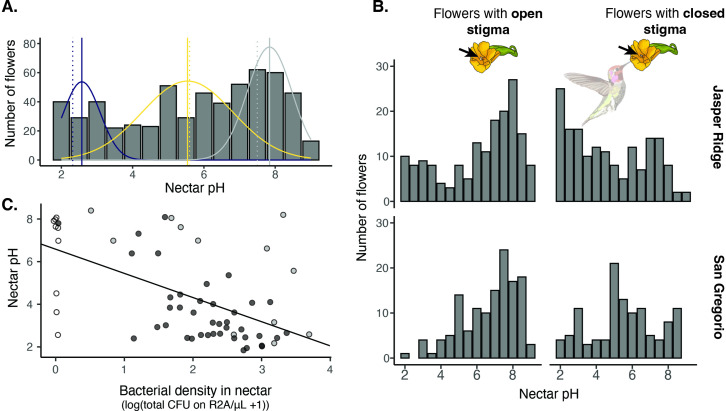
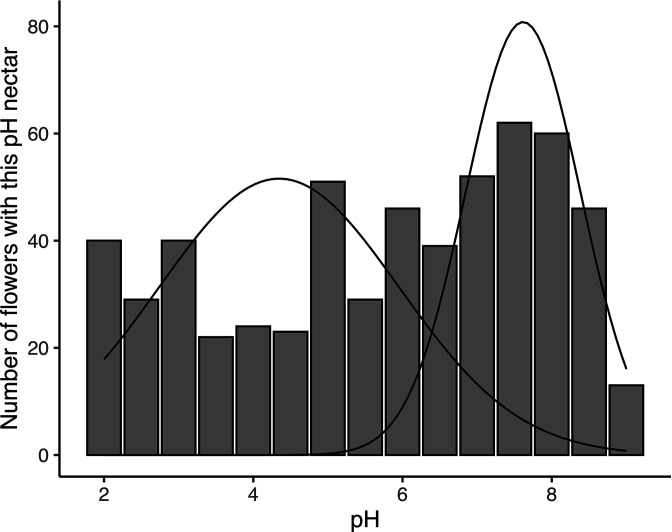
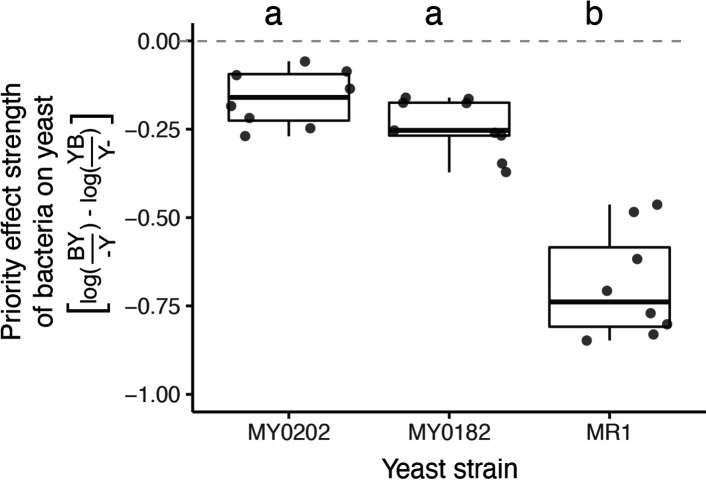
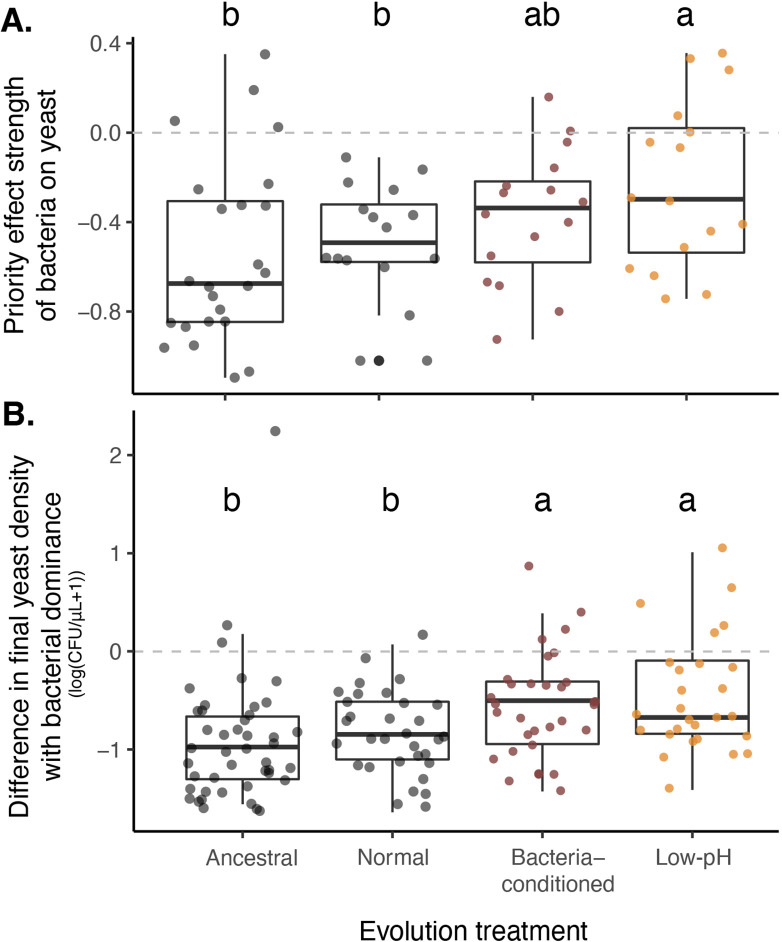
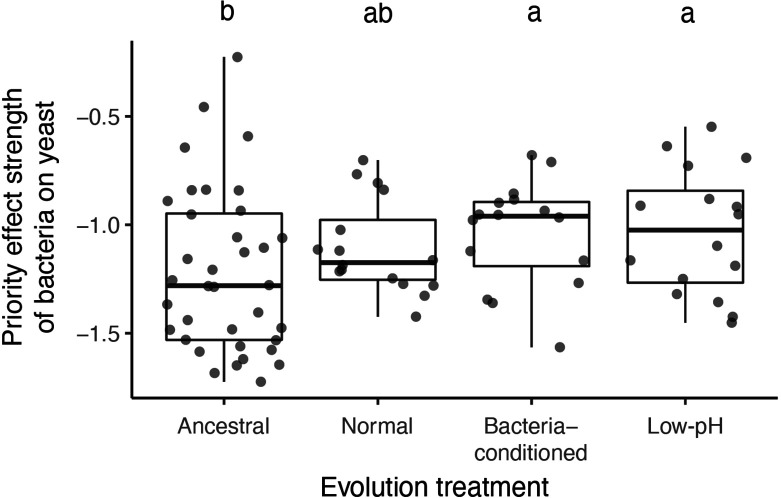
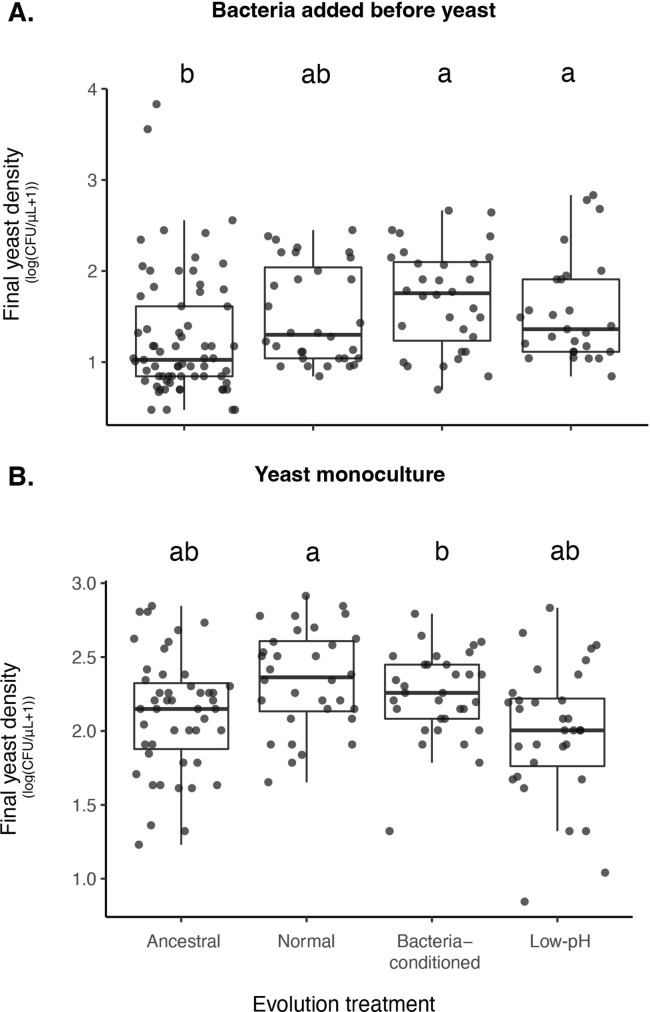
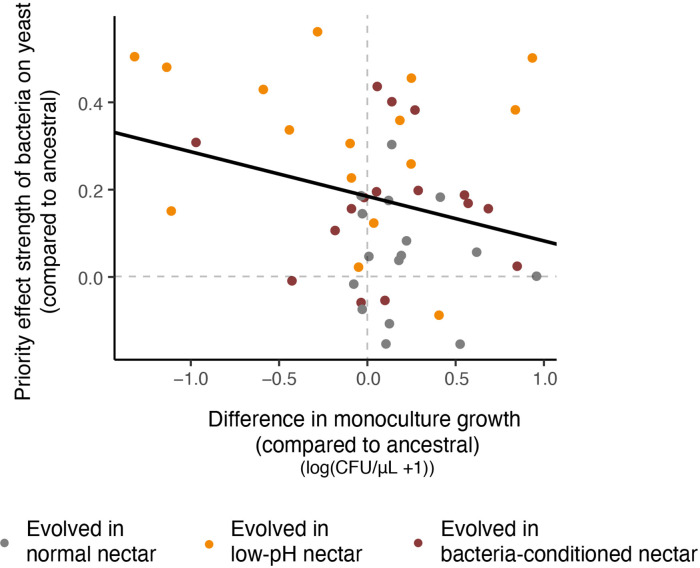
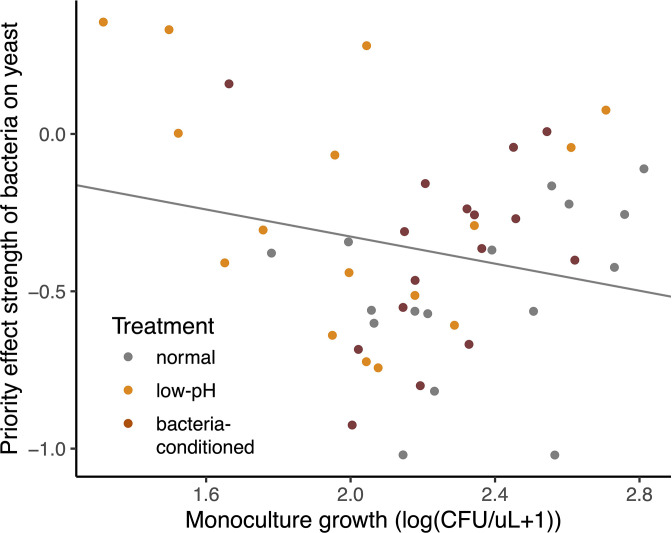
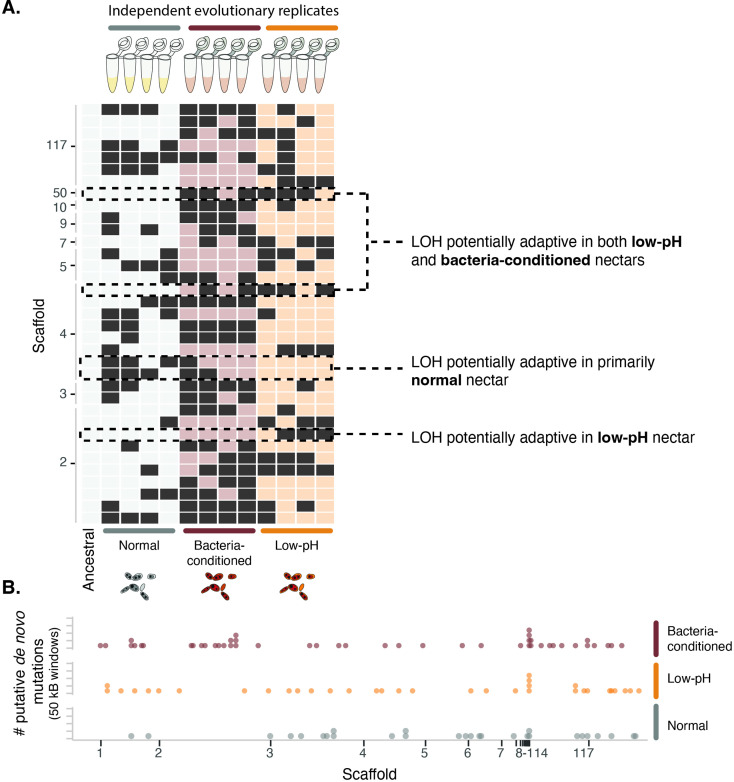
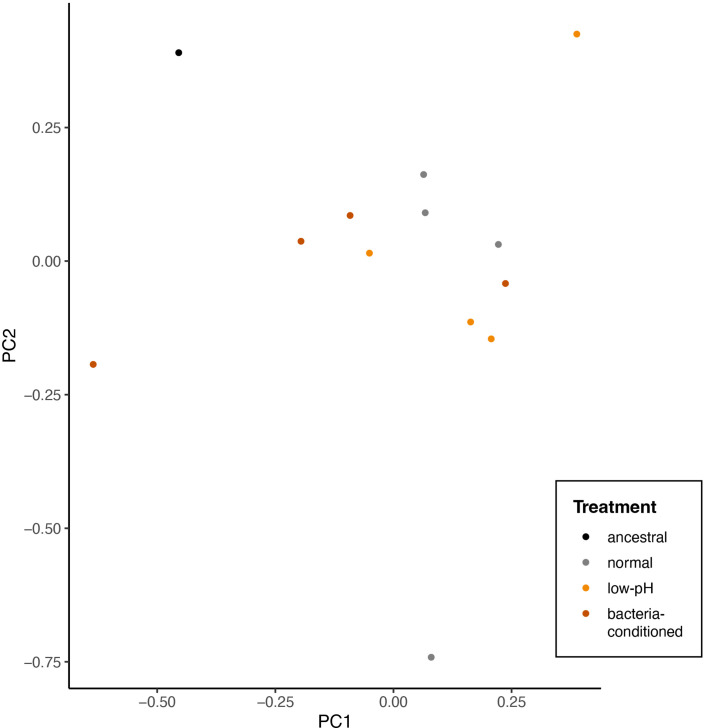
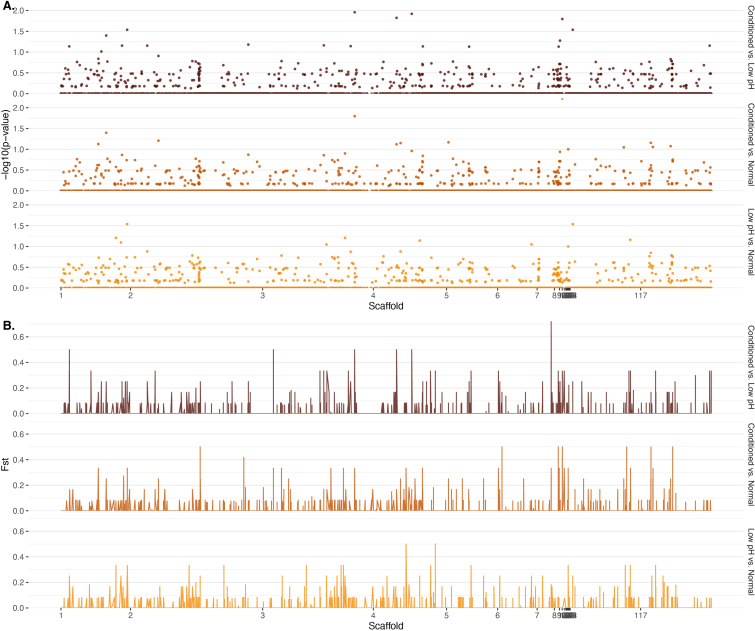
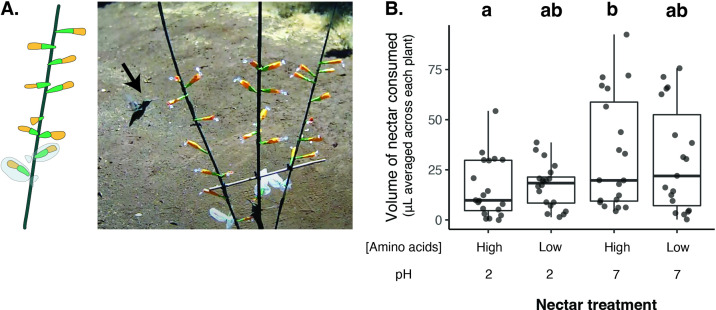
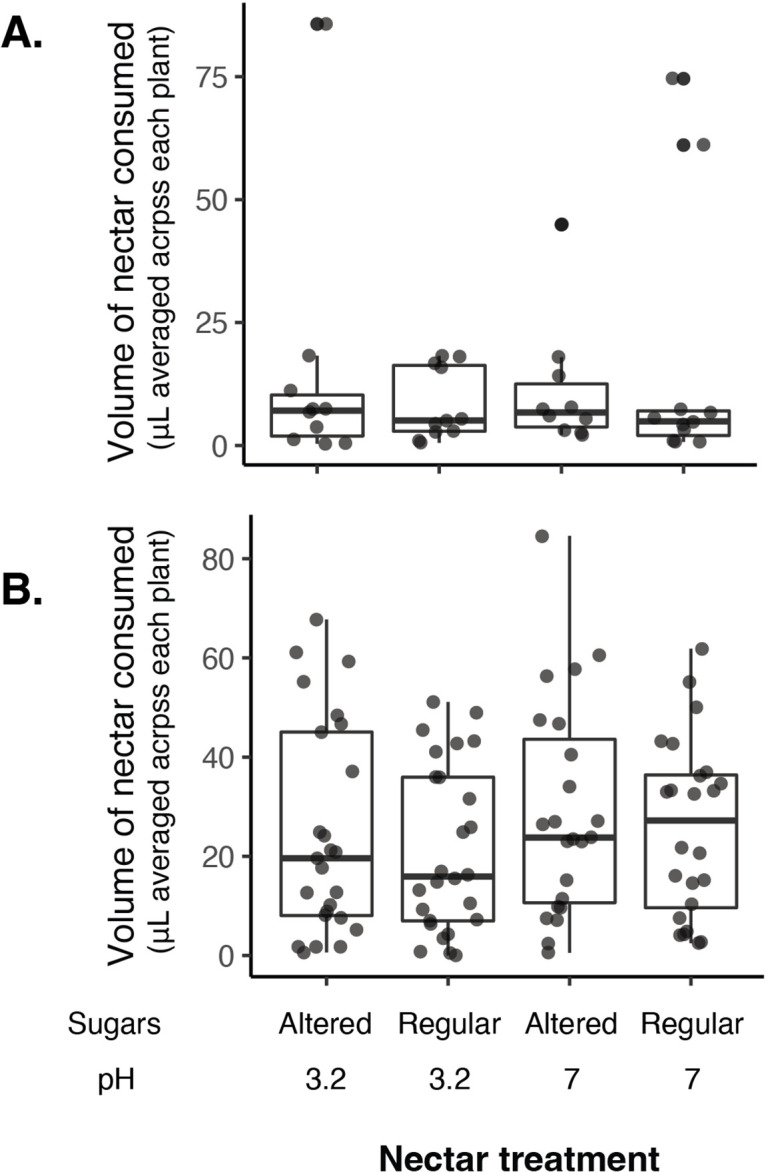
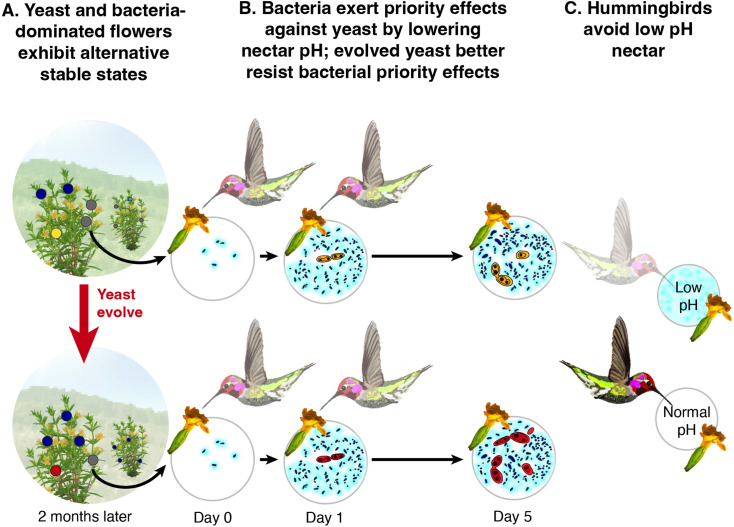
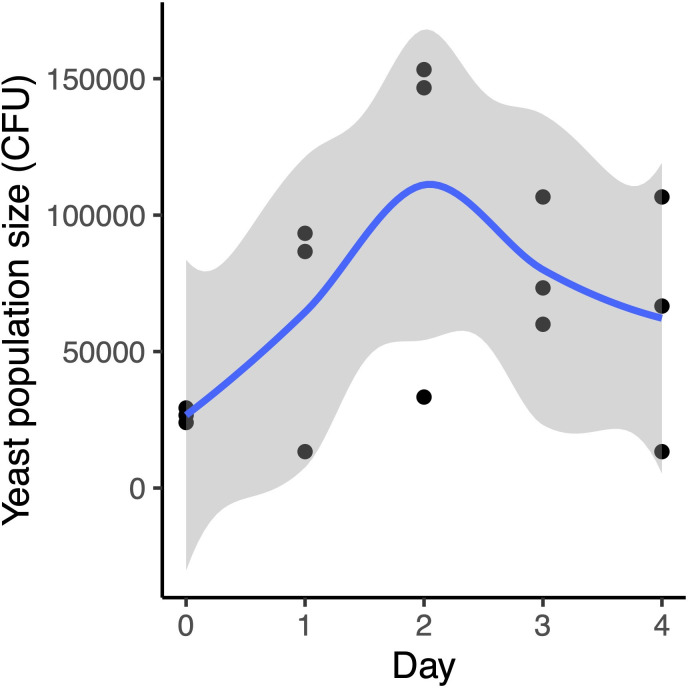
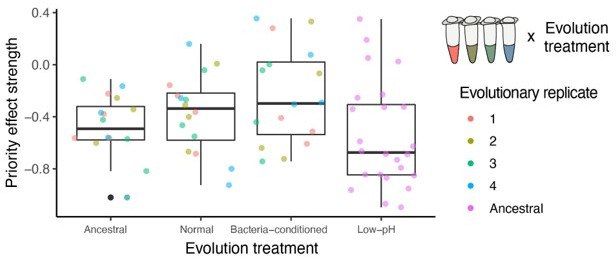
Priority effects, where arrival order and initial relative abundance modulate local species interactions, can exert taxonomic, functional, and evolutionary influences on ecological communities by driving them to alternative states. It remains unclear if these wide-ranging consequences of priority effects can be explained systematically by a common underlying factor. Here, we identify such a factor in an empirical system. In a series of field and laboratory studies, we focus on how pH affects nectar-colonizing microbes and their interactions with plants and pollinators. In a field survey, we found that nectar microbial communities in a hummingbird-pollinated shrub, Diplacus (formerly Mimulus) aurantiacus, exhibited abundance patterns indicative of alternative stable states that emerge through domination by either bacteria or yeasts within individual flowers. In addition, nectar pH varied among D. aurantiacus flowers in a manner that is consistent with the existence of these alternative stable states. In laboratory experiments, Acinetobacter nectaris, the bacterium most commonly found in D. aurantiacus nectar, exerted a strongly negative priority effect against Metschnikowia reukaufii, the most common nectar-specialist yeast, by reducing nectar pH. This priority effect likely explains the mutually exclusive pattern of dominance found in the field survey. Furthermore, experimental evolution simulating hummingbird-assisted dispersal between flowers revealed that M. reukaufii could evolve rapidly to improve resistance against the priority effect if constantly exposed to A. nectaris-induced pH reduction. Finally, in a field experiment, we found that low nectar pH could reduce nectar consumption by hummingbirds, suggesting functional consequences of the pH-driven priority effect for plant reproduction. Taken together, these results show that it is possible to identify an overarching factor that governs the eco-evolutionary dynamics of priority effects across multiple levels of biological organization.

Keywords: acinetobacter nectaris; calypte anna; community assembly; diplacus aurantiacus; eco-evolutionary dynamics; ecology; evolutionary biology; metacommunity; metschnikowia reukaufii; pollination; priority effect; rapid evolution.


Conflict of interest statement

CC, MD, MB, LC, SH, FB, YC, KE, LG, DH, VH, CK, SM, NR, TF No competing interests declared

Figures

Figure 1.
Figure 1.. Schematic of the approaches taken in this study.
(A) Field survey to characterize the distribution of yeast and bacteria in flowers as well as nectar pH of Diplacus aurantiacus, (B) initial microcosm experiments to assess strength of priority effects and identify nectar pH as a potential driver, (C) experimental evolution to study adaptation to low-pH and bacteria-conditioned nectar, (D) secondary microcosm experiments to study the effect of adaptation to nectar environments, (E) whole genome resequencing to identify genomic differences between evolved strains, and (F) field experiments to study the effect of low pH on nectar consumption by pollinators.
Figure 2.
Figure 2.. Sites vary in regional dominance of bacteria and yeast.
(A) Ninety-six Diplacus aurantiacus flowers were harvested from each of 12 field sites in and around the San Francisco Peninsula in California, USA (Figure 2—source data 1) with (B) variable numbers of flowers classified as bacteria-dominated (blue), fungi-dominated (yellow), co-dominated (green) flowers, or flowers where microbes were too rare to determine (grey) (n=1152). (C) Flowers are often dominated by bacteria or yeast, but rarely both. Each point represents a floral community and inset plot represents zoomed-in version of the plot behind it (n=1152). (D) Co-dominated flowers were observed less frequently than expected. In panel D, each point represents a site, with the numbers indicating the site numbers shown in panels A and B. In panel A, the location of Jasper Ridge Biological Preserve (JR) is also indicated (n=12).
Figure 2—figure supplement 1.
Figure 2—figure supplement 1.. Preliminary association between flow cytometry cell counts (populations identified by forward and side scatter) and colony forming units of A. nectaris growing on tryptic soy agar with cycloheximide.
Figure 2—figure supplement 2.
Figure 2—figure supplement 2.. Diplacus aurantiacus flowers were harvested from 12 field sites in and around the San Francisco Peninsula (California, USA) at various dates in June and July 2015 with variable densities of bacteria and yeast (n=1152).
Points are colored by the date each flower was sampled.
Figure 2—figure supplement 3.
Figure 2—figure supplement 3.. Classification of flowers into bacteria-dominated (blue), yeast-dominated (yellow), co-dominated (green), or microbes too rare to determine (grey).
Each point represents a floral community. Bars are ordered by the date sampled (n=1152).
Figure 2—figure supplement 4.
Figure 2—figure supplement 4.. We found no significant relationship between distance and the difference in bacterial colonization (A, n=8775, p=0.07, R2=0.0003) and a slightly negative association between distance and the difference in fungal colonization (B, n=8775, p<0.05, R2=0.004).
These results suggest that there was no obvious overall spatial pattern in whether flowers were dominated by yeast or bacteria.
Figure 3.
Figure 3.. Cultured bacteria and yeast from a 6year survey.
Cultured nectar bacteria (A) and yeast (B) from a 6-year survey of D. aurantiacus nectar at Jasper Ridge identified by colony PCR. The number placed at the top of each bar indicates the number of colony samples analyzed. Single fungal colonies were isolated on yeast mold agar (YMA) with supplemented 100 mg/L of the antibacterial chloramphenicol. Single bacterial colonies were either isolated on Reasoner’s 2A agar (R2A) supplemented with 20% sucrose and 100 mg/L of the antifungal cycloheximide (2012–2018), or tryptic soy agar (TSA) supplemented with 100 mg/L of the antifungal cycloheximide (2019–2022).
Figure 4.
Figure 4.. Nectar bacteria exert negative priority effects against nectar yeast, potentially due to reduction in nectar pH.
(A) Metschnikowia reukaufii (strain MR1) yeast population density after five days of growth with alternating arrival order with Acinetobacter nectaris bacteria or growth alone with inoculation on either the first or third day (arriving early or late) of the experiment (n=128). (B) Final pH of nectar after 5 days of bacterial growth; higher densities of bacteria are associated with lower pH. The shape of each point represents the treatments represented in panel A. Points are jittered on the y-axis (n=96). (C) Low pH (pH = 3) nectar depresses yeast growth when grown in low-density monoculture (n=72). In box plots (panels A and C), treatments that share the same letter placed above their boxes were statistically indistinguishable from one another.
Figure 4—figure supplement 1.
Figure 4—figure supplement 1.. M. reukaufii yeast and A. nectaris bacteria exhibit negative priority effects against each other, as evidenced by growth in microcosm experiments where arrival order is altered.
Statistical analysis for significance codes are in Figure 4—source data 2 for yeast (a) and bacteria (b). Letters shown above each box (each treatment) indicate statistical significance as in Figure 4.
Figure 4—figure supplement 2.
Figure 4—figure supplement 2.. Yeast increases nectar pH (p<0.05, Spearman rank correlation).
The shape of each point represents the various treatments (described in Figure 3B), where yeast first, then bacteria (‘YB’) are filled circles, bacteria first followed by yeast (‘BY’) are filled squares, early arriving bacteria and yeast (‘YB-’) are cross-hatched squares, late arriving bacteria and yeast (‘BY-’) are cross-hatched circles, late arriving yeast (‘-Y’) are open squares, early arriving yeast (‘Y-’) are open diamonds, late arriving bacteria (‘-B’) are open circles, and early arriving bacteria (‘B-’) are triangles. Points are slightly jittered on the y axis.
Figure 4—figure supplement 3.
Figure 4—figure supplement 3.. We found no effect of nectar type (pH=3, pH=6) on the growth of M. reukaufii, when grown in monoculture at a high density (approximately 10,000 cells/µL).
M. reukaufii growth was calculated by subtracting the initial from final cell density. Positive values represent instances of population growth whereas negative values represent instances of population decline.
Figure 4—figure supplement 4.
Figure 4—figure supplement 4.. We found no effect of nectar type (pH=3, pH=6) on the growth of A. nectaris when grown in monoculture at a low density (approximately 10 cells/µL) (A) or high density (approximately 10,000 cells/µL) (B).
A. nectaris growth was calculated by subtracting the initial from final cell density. Positive values represent instances of population growth whereas negative values represent instances of population decline.
Figure 5.
Figure 5.. Field survey of nectar pH in D. aurantiacus.
(A) Distribution of nectar pH in individual D. aurantiacus flowers collected at Jasper Ridge and San Gregorio (n=576 flowers from which we were able to extract a sufficient amount of nectar to measure pH; 21% of flowers sampled, i.e.,152 of 728 flowers, had too little nectar for pH measurement). The tri-modal distributions represent the prediction from a 3-part mixture model, with the modes indicated by solid vertical lines. Dashed vertical lines indicate experimental pH measurements from Vannette et al., 2013, where bacteria (blue dashed vertical line) and yeast (yellow dashed vertical line) were grown in field-collected D. aurantiacus nectar (control as grey dashed vertical line), and pH was measured after four days of growth. (B) Distributions of nectar pH amongD. aurantiacus flowers with open and closed stigmas (a closed stigma indicatesvisitation by a pollinator in D. aurantiacus; Fetscher and Kohn, 1999) shown separately for Jasper Ridge and San Gregorio (site 6). At Jasper Ridge, 71/233 and 37/204 flowers with closed and open stigma, respectively, had too little nectar to measure pH. At San Gregorio, 31/145 and 13/146 flowers with closed and open stigma, respectively, had too little nectar to measure pH. (C) Association between bacterial density in individual flowers and nectar pH (n=62). White points represent flowers where no microbes were cultured on R2A, but some colonies were present on TSA. Grey points represent flowers where yellow colonies were present on R2A at a greater density than other colonies on R2A. Preliminary data suggest that these yellow colonies represent non-acidifying bacteria such as Pseudomonas. Black points represent flowers with colonies on R2A that do not fit into either of the prior categories. The regression line was shown for all data.
Figure 5—figure supplement 1.
Figure 5—figure supplement 1.. Expectation-maximization (EM) algorithm-based mixture model of nectar pH from D.aurantiacus flowers harvested from Jasper Ridge and San Gregorio in June-July 2022.
Figure 5—figure supplement 2.
Figure 5—figure supplement 2.. Distribution of nectar pH for flowers harvested from Jasper Ridge and San Gregorio separated by anther status.
Anthers from each flower were categorized from 1 (youngest) to 4 (oldest) as a rough estimate of the flower’s age (Tsuji et al., 2016). Missing anthers were classified as 0. An anther categorized as a 1 displayed a bright yellow appearance with no brown spots, an anther of 2 was a mix of yellow and golden brown, an anther of 3 was only golden brown, and an anther of 4 was dark brown and wrinkled.
Figure 6.
Figure 6.. M. reukaufii strains differ in susceptibility to bacterial priority effects.
Three strains of M. reukaufii were differentially affected by early arrival of bacteria (n=25). For each strain, we calculated the strength of priority effects using a metric that compares growth between varying initial inoculation densities with a competitor and alone. BY and YB represents initial dominance by bacteria or yeast (e.g. BY represents bacteria arriving early and yeast arriving late). Y- and -Y represent the comparable growth of yeast at either density (early or late) alone. Letters shown above each box (each treatment) indicate statistical significance as in Figure 4.
Figure 7.
Figure 7.. Yeast evolved with bacterial niche modification were more resistant to bacterial priority effects.
(A) Yeast evolved in low-pH nectar was less affected by bacterial priority effects than other treatments, especially compared to ancestral yeast and yeast evolved in normal nectar (n=72). Consequently, (B) yeast evolved in bacteria-like nectar (both bacteria-conditioned and low-pH) was less negatively affected by initial bacterial dominance, relative to their growth alone, than ancestral yeast or yeast evolved in normal nectar (n=168). Letters shown above each box (each treatment) indicate statistical significance as in Figure 4.
Figure 7—figure supplement 1.
Figure 7—figure supplement 1.. We calculated an additional priority effect metric, which corroborated our main result.
This metric is calculated by taking the natural logarithm of growth ratio between different initial dominance:PE = log(BYYB). Letters shown above each box (each treatment) indicate statistical significance as in Figure 4.
Figure 7—figure supplement 2.
Figure 7—figure supplement 2.. Effects of evolution treatments and bacterial addition on yeast density.
(A) Yeast evolved in bacteria-conditioned and low-pH nectars were better able to grow than ancestral yeast when bacteria were dominant (BY bacterial priority effects treatment). (B) This difference in growth was not due to a difference in intrinsic growth rate (-Y monoculture treatment). Letters shown above each box (each treatment) indicate statistical significance as in Figure 4.
Figure 8.
Figure 8.. Relationship between resistance to priority effects and monoculture growth.
Strains that could more strongly resist priority effects by bacteria were poor at growing in monoculture (upper left quadrant). Conversely, strains that were more affected by bacterial priority effects were better able to grow in monoculture (upper right quadrant). Each point in the plot represents an evolved strain, plotted with respect to the ancestral strain grown in that round of the experiment (centered on the origin) (n=60).
Figure 8—figure supplement 1.
Figure 8—figure supplement 1.. Negative relationship between the strength of priority effects of bacteria and yeast on their monoculture growth rate at a low density, with round of the experiment (week) as a random effect (LMM: n=48, p=0.006).
Note that this data is not adjusted for differences between ancestral strains within rounds, as in Figure 7.
Figure 9.
Figure 9.. Yeast evolved to synthetic nectar.
(A) Heat map depicting treatment-specific loss of heterozygosity (LOH). Columns represent individual samples (independent evolutionary trajectories) and rows represent single sites with LOH. White or light red/orange boxes indicate sites without LOH, while dark grey boxes represent a site with LOH. Sites selected for the figure exhibited FST >0.3 and permutation-derived p-value <0.1 when comparing the ancestral strain and one of the evolved clones at that site. Boxes with dashed lines are highlighted examples of sites that are potentially adaptive in low-pH nectar, both low-pH and bacteria-conditioned nectar, and normal nectar but not the other two nectar types. (B) Distribution of putative de novo mutations across the genome in 50 kB windows and separated by treatment. Dots represent the sum of putative de novo mutations in a 50 kB window, per treatment (n=146).
Figure 9—figure supplement 1.
Figure 9—figure supplement 1.. Principal components analysis of single nucleotide polymorphisms that differ between evolved and any ancestral strain (2319 sites).
Points represent individual end-point clones (individuals) and are colored by evolution treatment (ancestral in black, neutral in grey, evolved in low-pH nectar in orange, and evolved in bacteria-conditioned nectar in dark red) (perMANOVA, p=0.19, n=12).
Figure 9—figure supplement 2.
Figure 9—figure supplement 2.. Genome-wide differentiation by (A) computed p-values for observed patterns of loss of heterozygosity (LOH) and (B) Weir-Cockerham estimator of FST.
Figure 10.
Figure 10.. Low nectar pH reduces nectar consumption by flower-visiting animals.
(A) Photo of field experiment setup: hummingbird visits artificial flowers containing PCR tubes of nectar attached to a garden stake. See this link for video: https://www.youtube.com/watch?v=LbD2r43dvnQ or refer to Rich Media (Figure 10—video 1) (B) Flower-visiting animals consumed less nectar from flowers containing low pH/high amino-acid nectar than high pH/high amino acid nectar (n=79). Letters shown above each box (each treatment) indicate statistical significance as in Figure 4.
Figure 10—figure supplement 1.
Figure 10—figure supplement 1.. No difference in the volume of nectar consumed by nectar treatment in 2016 (A) or 2018 (B) when nectar sugars were altered with pH.
Figure 11.
Figure 11.. pH is an eco-evolutionary driver of priority effects in nectar microbes.
(A) Field observations show that nectar yeast and bacteria in individual flowers exhibit alternative stable states, where some flowers are either dominated by bacteria (dark blue), yeast (yellow (ancestral) or red (evolved)) or lack significant microbial growth (gray). (B) Laboratory experiments identify negative priority effects between bacteria (dark blue) and yeast (yellow (ancestral) or red (evolved)) that lead to alternative states; for example, where early arriving bacteria lower the pH of nectar (depicted here in light blue), limiting the growth of later arriving yeast. Experimentally evolved nectar yeast (red) was less affected by bacterial priority effects, supporting pH as the key mechanism by which nectar bacteria inhibit yeast growth. (C) A field experiment shows one functional outcome of bacterial dominance in nectar: low nectar pH decreases nectar consumption by pollinators. Graphics modified from Chappell and Fukami, 2018.
Appendix 2—figure 1.
Appendix 2—figure 1.. M. reukaufii growth over four days in experimental microcosms.
Author response image 1.

References

    1. Aizenberg-Gershtein Y, Izhaki I, Santhanam R, Kumar P, Baldwin IT, Halpern M. Pyridine-type alkaloid composition affects bacterial community composition of floral nectar. Scientific Reports. 2015;5:11536. doi: 10.1038/srep11536. - DOI - PMC - PubMed
    1. Álvarez-Martín P, Flórez AB, Hernández-Barranco A, Mayo B. Interaction between dairy yeasts and lactic acid bacteria strains during milk fermentation. Food Control. 2008;19:62–70. doi: 10.1016/j.foodcont.2007.02.003. - DOI
    1. Álvarez-Pérez S, Lievens B, Fukami T. Yeast-bacterium interactions: the next frontier in nectar research. Trends in Plant Science. 2019;24:393–401. doi: 10.1016/j.tplants.2019.01.012. - DOI - PubMed
    1. Baldwin MW, Toda Y, Nakagita T, O’Connell MJ, Klasing KC, Misaka T, Edwards SV, Liberles SD. Sensory biology. evolution of sweet taste perception in hummingbirds by transformation of the ancestral umami receptor. Science. 2014;345:929–933. doi: 10.1126/science.1255097. - DOI - PMC - PubMed
    1. Beasley DE, Koltz AM, Lambert JE, Fierer N, Dunn RR. The evolution of stomach acidity and its relevance to the human microbiome. PLOS ONE. 2015;10:e0134116. doi: 10.1371/journal.pone.0134116. - DOI - PMC - PubMed

Publication types