. 2022 Dec 20;13(6):e0174222.
doi: 10.1128/mbio.01742-22. Epub 2022 Oct 27.

FtsK, a DNA Motor Protein, Coordinates the Genome Segregation and Early Cell Division Processes in Deinococcus radiodurans

Affiliations

FtsK, a DNA Motor Protein, Coordinates the Genome Segregation and Early Cell Division Processes in Deinococcus radiodurans

Shruti Mishra et al. mBio. .

Abstract

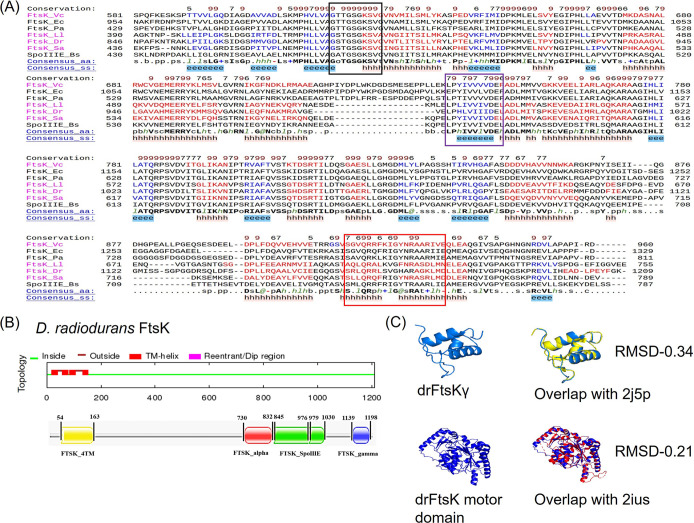
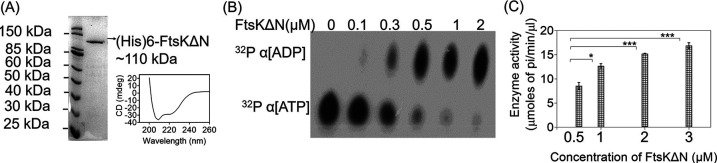
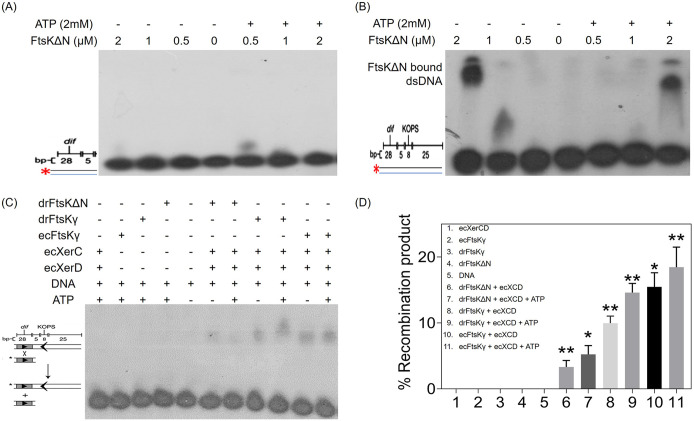
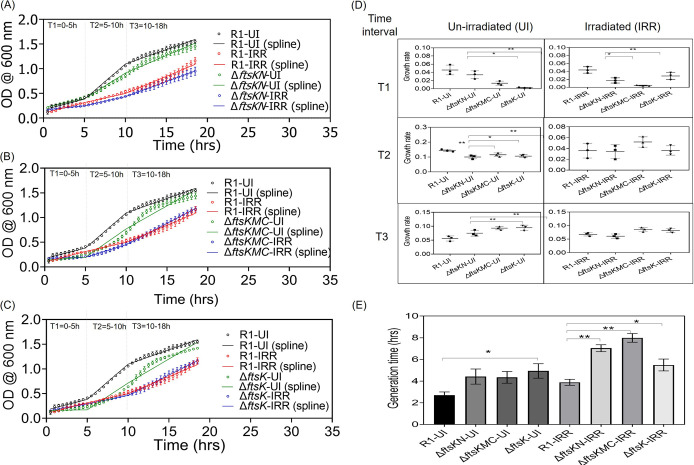
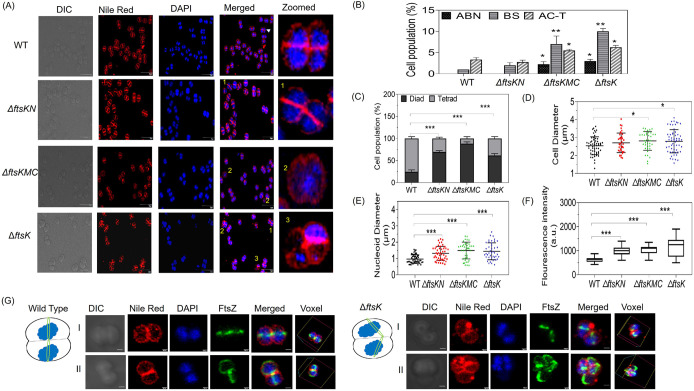
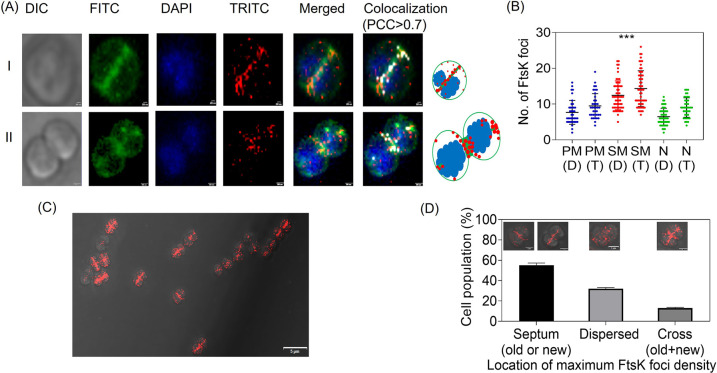
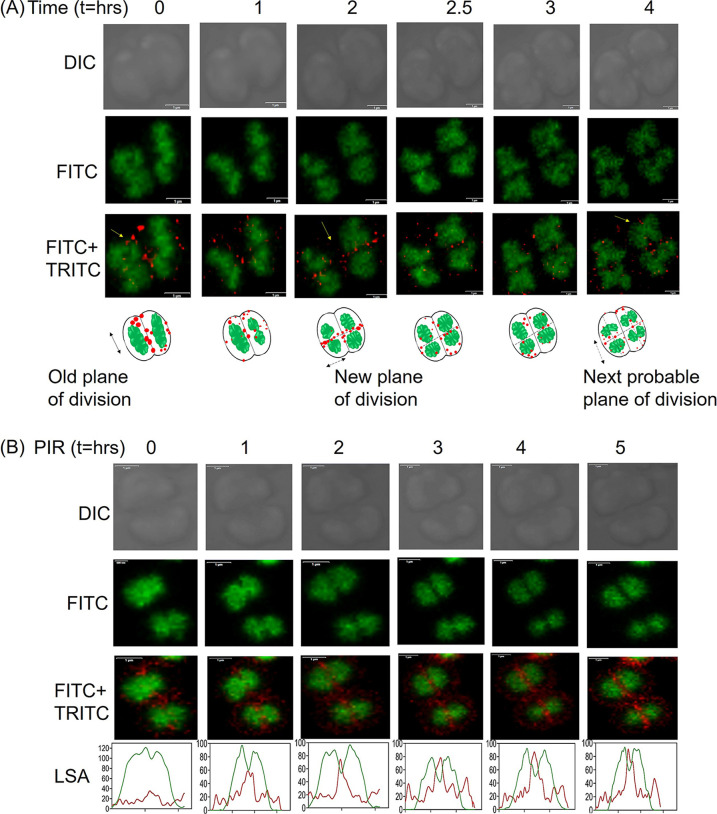
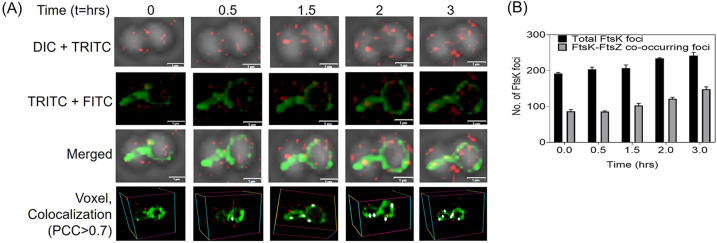
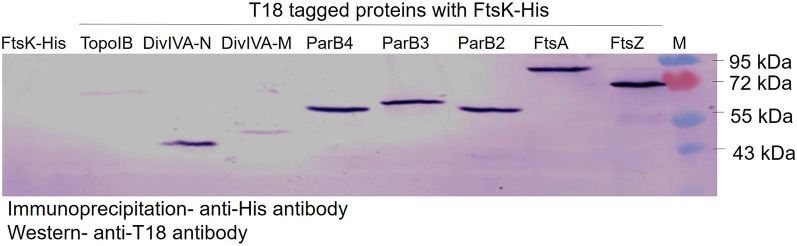
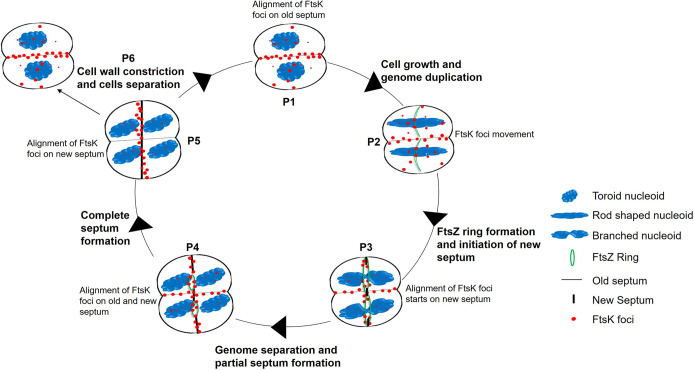
Filament temperature-sensitive mutant K (FtsK)/SpoIIIE family proteins are DNA translocases known as the fastest DNA motor proteins that use ATP for their movement on DNA. Most of the studies in single chromosome-containing bacteria have established the role of FtsK in chromosome dimer resolution (CDR), connecting the bacterial chromosome segregation process with cell division. Only limited reports, however, are available on the interdependent regulation of genome segregation and cell division in multipartite genome harboring (MGH) bacteria. In this study, for the first time, we report the characterization of FtsK from the radioresistant MGH bacterium Deinococcus radiodurans R1 (drFtsK). drFtsK shows the activity characteristics of a typical FtsK/SpoIIIE/Tra family. It stimulates the site-specific recombination catalyzed by Escherichia coli tyrosine recombinases. drFtsK interacts with various cell division and genome segregation proteins of D. radiodurans. Microscopic examination of different domain deletion mutants of this protein reveals alterations in cellular membrane architecture and nucleoid morphology. In vivo localization studies of drFtsK-RFP show that it forms multiple foci on nucleoid as well as on the membrane with maximum density on the septum. drFtsK coordinates its movement with nucleoid separation. The alignment of its foci shifts from old to new septum indicating its cellular dynamics with the FtsZ ring during the cell division process. Nearly, similar positional dynamicity of FtsK was observed in cells recovering from gamma radiation exposure. These results suggest that FtsK forms a part of chromosome segregation, cell envelope, and cell division machinery in D. radiodurans. IMPORTANCE Deinococcus radiodurans show extraordinary resistance to gamma radiation. It is polyploid and harbors a multipartite genome comprised of 2 chromosomes and 2 plasmids, packaged in a doughnut-shaped toroidal nucleoid. Very little is known about how the tightly packed genome is accurately segregated and the next divisional plane is determined. Filament temperature-sensitive mutant K (FtsK), a multifunctional protein, helps in pumping the septum-trapped DNA in several bacteria. Here, we characterized FtsK of D. radiodurans R1 (drFtsK) for the first time and showed it to be an active protein. The absence of drFtsK causes many defects in morphology at both cellular and nucleoid levels. The compact packaging of the deinococcal genome and cell membrane formation is hindered in ftsK mutants. In vivo drFtsK is dynamic, forms foci on both nucleoid and septum, and coordinates with FtsZ for the next cell division. Thus, drFtsK role in maintaining the normal genome phenotype and cell division in D. radiodurans is suggested.

Keywords: DNA translocation; Deinococcus radiodurans; FtsK; bacterial cell division.


Conflict of interest statement

The authors declare no conflict of interest.

Figures

FIG 1
FIG 1
Deinococcal FtsK protein sequence alignment and modeling. (A) Multiple sequence alignment (MSA) of drFtsK with known FtsK/SpoIIIE family proteins. The amino acid sequences of FtsK from Deinococcus radiodurans (FtsK_Dr), SpoIIIE from Bacillus subtilis (SpoIIIE_Bs), FtsK of Escherichia coli (FtsK_Ec), Pseudomonas aeruginosa (FtsK_Pa), Lactococcus lactis (FtsK_Ll), Vibrio cholerae (FtsK_Vc), and Staphylococcus aureus (FtsK_Sa) are collected from NCBI and the homology between sequences is checked by PROMALS3D webserver. MSA of the C-terminal region is depicted here. Boundaries of the conserved motifs in the C-terminal are marked as a black box for the walker A domain (ATP binding P-loop motif), a purple box for the Walker B motif, and a red box for the DNA binding motif. Predicted secondary structures are displayed below the sequences. (B) Different domains present in drFtsK are represented as FTSK_4TM (FtsK_N-terminal region), FtsK_alpha, FtsL_SpoIIIE (αβ motor pump) and FtsK_gamma domain(drFtsKγ). (C) Modeled structures of drFtsKγ and motor domain were aligned with the template structures of E. coli FtsK gamma domain (2j5p) and E. coli FtsK motor domain (2ius), respectively.
FIG 2
FIG 2
The ATPase activity of drFtsK. (A) Polyhistidine tagged fusion protein of N-terminal truncated protein (FtsKΔN) was purified and the purified protein was checked for proper refolding by circular dichroism as described in the methods. (B) ATPase activity of recombinant purified FtsKΔN protein was checked using radiolabeled ATP [32P]-αATP. Different concentrations of the protein were incubated with radiolabeled nucleotide and reaction products were separated on PEI-Cellulose F+ TLC. The autoradiogram shows the hydrolysis of 32P-α[ATP] to 32P-α[ADP]. (C) Quantitative analysis of ATPase activity was done by colorimetric malachite green reagent using increasing protein concentration. Data shown here are the mean+-SD (n = 3) plotted in GraphPad Prizm6. Statistical significance was obtained by Student's t test. The P-values attained at 95% confidence intervals are depicted as (***) for <0.001 and (*) for <0.05.
FIG 3
FIG 3
DNA binding activity and activation of E. coli tyrosine recombinases by deinococcal FtsKΔN protein. Purified recombinant FtsKΔN protein was checked for DNA binding activity with [γ -32P] ATP labeled dsDNA containing E. coli dif- 40 bp (A), E. coli dif and KOPS- 72 bp (B) in the presence/absence of ATP. Autoradiograms show EMSA gels where no interaction of drFtsKΔN is seen with only E. coli dif sequence but interaction with E. coli dif and KOPS is seen. A schematic representation of the recombination reaction substrate (short radiolabeled dif containing dsDNA sequence) and product (long dif + KOPS containing dsDNA sequence) as described earlier is given (31) (C). Autoradiogram showing site-specific recombination reaction by E. coli tyrosine recombinases XerC and XerD (ecXerCD). Recombination products were obtained in those reactions where FtsK (drFtsKΔN/drFtsKγ/ecFtsKγ) was present with EcXerCD. Band intensities obtained by densitometric analysis of the autoradiogram were used to calculate % recombination product in each reaction (D). Data shown here are the mean+-SD (n = 3) and statistical significance was found using the Student's t test. The P-values attained at 95% confidence intervals are depicted as (*) for <0.05 and (**) for 0.05-0.001.
FIG 4
FIG 4
Effect of deinococcal FtsK deletion on the growth of D. radiodurans. Cell survival studies of different deletion mutants of ftsk-ΔftsKN (A), ΔftsKMC (B), and ΔftsK (C) were monitored under un-irradiated conditions (normal) and after gamma irradiation treatment (6kGy). The growth data (circles) were fitted by a linear spline regression model (lines). The dashed vertical lines show the knots dividing the spline modeled growth curve into three intervals- 0 to 5 h (T1), 5 to 10 h (T2), and 10 to 18 h (T3). The difference in the growth rates of wild-type (R1) and different domain deletion mutants under normal and post-irradiation recovery conditions at each time interval was calculated by estimating the slopes of each line segment from the spline regression (D). The generation time (doubling time) of wildtype and ftsk mutants under normal and irradiated conditions was calculated as described in the methodology and plotted (E). Data shown here are the mean+-SD (n = 9) and the statistical significance of the differences was found using the Student's t test. The P-values attained at 95% confidence intervals are depicted as (*) for <0.05 and (**) for 0.05-0.001.
FIG 5
FIG 5
Effect of different domain deletion of drftsK on the phenotype of D. radiodurans cells. Cells at 14 h post subculturing were taken and fluorescence microscopic images show the DIC, TRITC (for Nile Red), DAPI, and merged channels of the wild type (WT), and different mutants of ftsk-ΔftsKMC, ΔftsKN, ΔftsK cells (scale bar-5μm). A significant population of cells in ΔftsKMC, ΔftsK, and ΔftsKN mutants showed a change in tetrad cell morphology, nucleoid arrangement, and septal membrane. Atypical phenotypes obtained are represented as; 1. Bent septum (BS), 2. Abnormal tetrad arrangements (ABN), and 3. Anucleated cells within the tetrad (AC-T) (zoomed cell scale bar- 500 nm) (A). Statistical analysis of these morphologies obtained in ftsK mutants when compared to WT cells is done in 200–300 cells and plotted (B). Other phenotypic changes like percent of diads and tetrads in the cell populations (C), cell diameter (D), nucleoid diameter (E), and nucleoid DAPI fluorescence intensity (F), and were calculated and plotted. The P-values attained at 95% confidence intervals are depicted as (*) for <0.05, (**) for 0.05-0.001, (***) for <0.001. Microscopic images of the cell division septal ring formation by drFtsZ-GFP in WT and ΔftsK mutant cells are depicted along with pictorial representation (scale bar- 500 nm) (G). The images shown here are representative pictures of the experiments conducted at least three times.
FIG 6
FIG 6
Cellular localization of FtsK-RFP expressing under native promoter in D. radiodurans cells. Expression of FtsK-RFP foci (TRITC channel- red) in the cells is seen after nucleoid staining by DAPI (blue) and membrane staining by Vancomycin-BioDIPY (FITC channel- green). FtsK-RFP shows association on the nucleoid as well as on the membrane, both septal and peripheral membrane. Data represented here shows microscopic images of two independent cells along with pictorial images (scale bar- 200 nm and 500 nm for I and II, respectively) (A). White foci show the co-localization of FtsK-RFP with the membrane (PCC > 0.7). Diad and tetrad cells were counted separately for the location of FtsK-RFP foci on the peripheral membrane (PM-D for diad and PM-T for tetrad), on the septal membrane (SM-D for diad and SM-T for tetrad), and on nucleoid (N-D for diad and N-T for tetrad). A significantly high foci density is seen on the septum as analyzed in both diads and tetrads (B). The P-values attained at 95% confidence intervals are depicted as (***) for <0.001. Cells grown in stationary conditions show FtsK-RFP expression in different locations- foci on the old or new septum, dispersed foci, and foci on both old and new septum making a cross pattern (scale bar-5μm) (C). The percentage of cells showing different cellular localization of FtsK-RFP foci in a population of ~200 cells was calculated and plotted (D). The images shown here are representative pictures of the experiments conducted at least three times.
FIG 7
FIG 7
Cellular dynamics of deinococcal FtsK-RFP in normal and post-irradiation conditions. Time-lapse confocal microscopic images show FtsK-RFP (red foci) expressing cells stained with SYTO 9 green dye (green) during the normal condition (A) and during post-irradiation recovery (PIR) (B). The top panels indicate the cell in planar view at different time points (t = hr) in the DIC channel, the middle panels indicate the genome arrangement in the FITC channel and the bottom panels show the same cell with TRITC and FITC channel merged to see FtsK-RFP foci dynamics at different ‘t’ (scale bar-1μm). The dynamics of FtsK-RFP foci is schematically represented under normal condition. During PIR, line scan analysis (LSA) shows the increase in the intensity of FtsK-RFP along the emerging septum.
FIG 8
FIG 8
Co-ordinated cellular dynamics of cell division proteins FtsK and FtsZ in D. radiodurans. Time-lapse fluorescence microscopic images of cells expressing both FtsK-RFP and FtsZ-GFP show the dynamics of both the proteins in dividing cells under normal conditions. The top panel indicates the cell in planar view at different time points (t = hr) in the DIC+TRITC, the middle panels indicate the FITC+TRITC channel and merged images, and the bottom-most panel shows the same cell in voxel view with white foci showing the co-localization of FtsZ and FtsK (PCC > 0.7) (scale bar-1μm). The majority of FtsK-RFP (red) can be seen aligned at the division septa at t = 0.5 h and then moving to position themselves along the almost complete FtsZ ring at t = 3h (A). The total number of FtsK foci and FtsK-FtsZ co-occurring foci in a population of ~75 cells at time points of 0, 0.5 h, 1.5 h, 2 h, and 3 h were calculated and plotted (B).
FIG 9
FIG 9
Interaction studies of deinococcal FtsK. Interaction of drFtsK and other proteins of D. radiodurans by co-immunoprecipitation assay followed by Western blot. His-tagged drFtsK and T18-tagged ParB2, ParB3, ParB4, TopoIB, FtsA, DivIVA, and FtsZ in E. coli strain BL21 were checked for protein-protein interactions by co-immunoprecipitation using antibodies against polyhistidine tag followed by immunoblotting using antibodies against T18 domain of CyaA. His-tagged FtsK expressing cells harboring only the pUT18 vector was taken as a negative control. The experiment was conducted three times and the representative picture was shown.
FIG 10
FIG 10
Schematic model of the dynamics of FtsK in D. radiodurans during cell division. Based on the biochemical assays and cellular localization studies, the probable role and dynamics of FtsK protein in exponentially growing D. radiodurans were proposed. FtsK forms foci on the nucleoid as well as on the membrane. The movement of FtsK can be linked with the different growth phases (P) as described. Initially, a maximum number of FtsK foci are aligned at the septum (P1). As the cell grows and the genome duplicates, FtsK foci move in the cell (P2). With the formation of the FtsZ ring and subsequent initiation of the new septa, the alignment of FtsK starts shifting perpendicularly from the old one to the new one (P3). When a new septum is partially formed, FtsK foci alignment is found on the old as well as new septum (P4). With complete new septum formation, FtsK moves entirely to the new septa before cell wall constriction starts (P5). The whole process repeats in the next cell division. The ATPase activity, sequence-specific DNA binding activity, and cellular interaction of FtsK with other segrosome and divisome proteins may aid in the smooth and coordinated progression of different cellular processes to maintain the genome stability in D. radiodurans.

Similar articles

Cited by

References

    1. Aarsman ME, Piette A, Fraipont C, Vinkenvleugel TM, Nguyen-Distèche M, den Blaauwen T. 2005. Maturation of the Escherichia coli divisome occurs in two steps. Mol Microbiol 55:1631–1645. doi:10.1111/j.1365-2958.2005.04502.x. - DOI - PubMed
    1. Goehring NW, Beckwith J. 2005. Diverse paths to midcell: assembly of the bacterial cell division machinery. Curr Biol 15:R514–R526. doi:10.1016/j.cub.2005.06.038. - DOI - PubMed
    1. Pazos M, Natale P, Vicente M. 2013. A specific role for the ZipA protein in cell division: stabilization of the FtsZ protein. J Biol Chem 288:3219–3226. doi:10.1074/jbc.M112.434944. - DOI - PMC - PubMed
    1. den Blaauwen T, Hamoen LW, Levin PA. 2017. The divisome at 25: the road ahead. Curr Opin Microbiol 36:85–94. doi:10.1016/j.mib.2017.01.007. - DOI - PMC - PubMed
    1. Begg KJ, Dewar SJ, Donachie WD. 1995. A new Escherichia coli cell division gene, ftsK. J Bacteriol 177:6211–6222. doi:10.1128/jb.177.21.6211-6222.1995. - DOI - PMC - PubMed

LinkOut - more resources