. 2023 Feb 6;13(2):312-331.
doi: 10.1158/2159-8290.CD-22-0686.

Distinct Mechanisms of Mismatch-Repair Deficiency Delineate Two Modes of Response to Anti-PD-1 Immunotherapy in Endometrial Carcinoma

Affiliations

Distinct Mechanisms of Mismatch-Repair Deficiency Delineate Two Modes of Response to Anti-PD-1 Immunotherapy in Endometrial Carcinoma

Ryan D Chow et al. Cancer Discov. .

Abstract

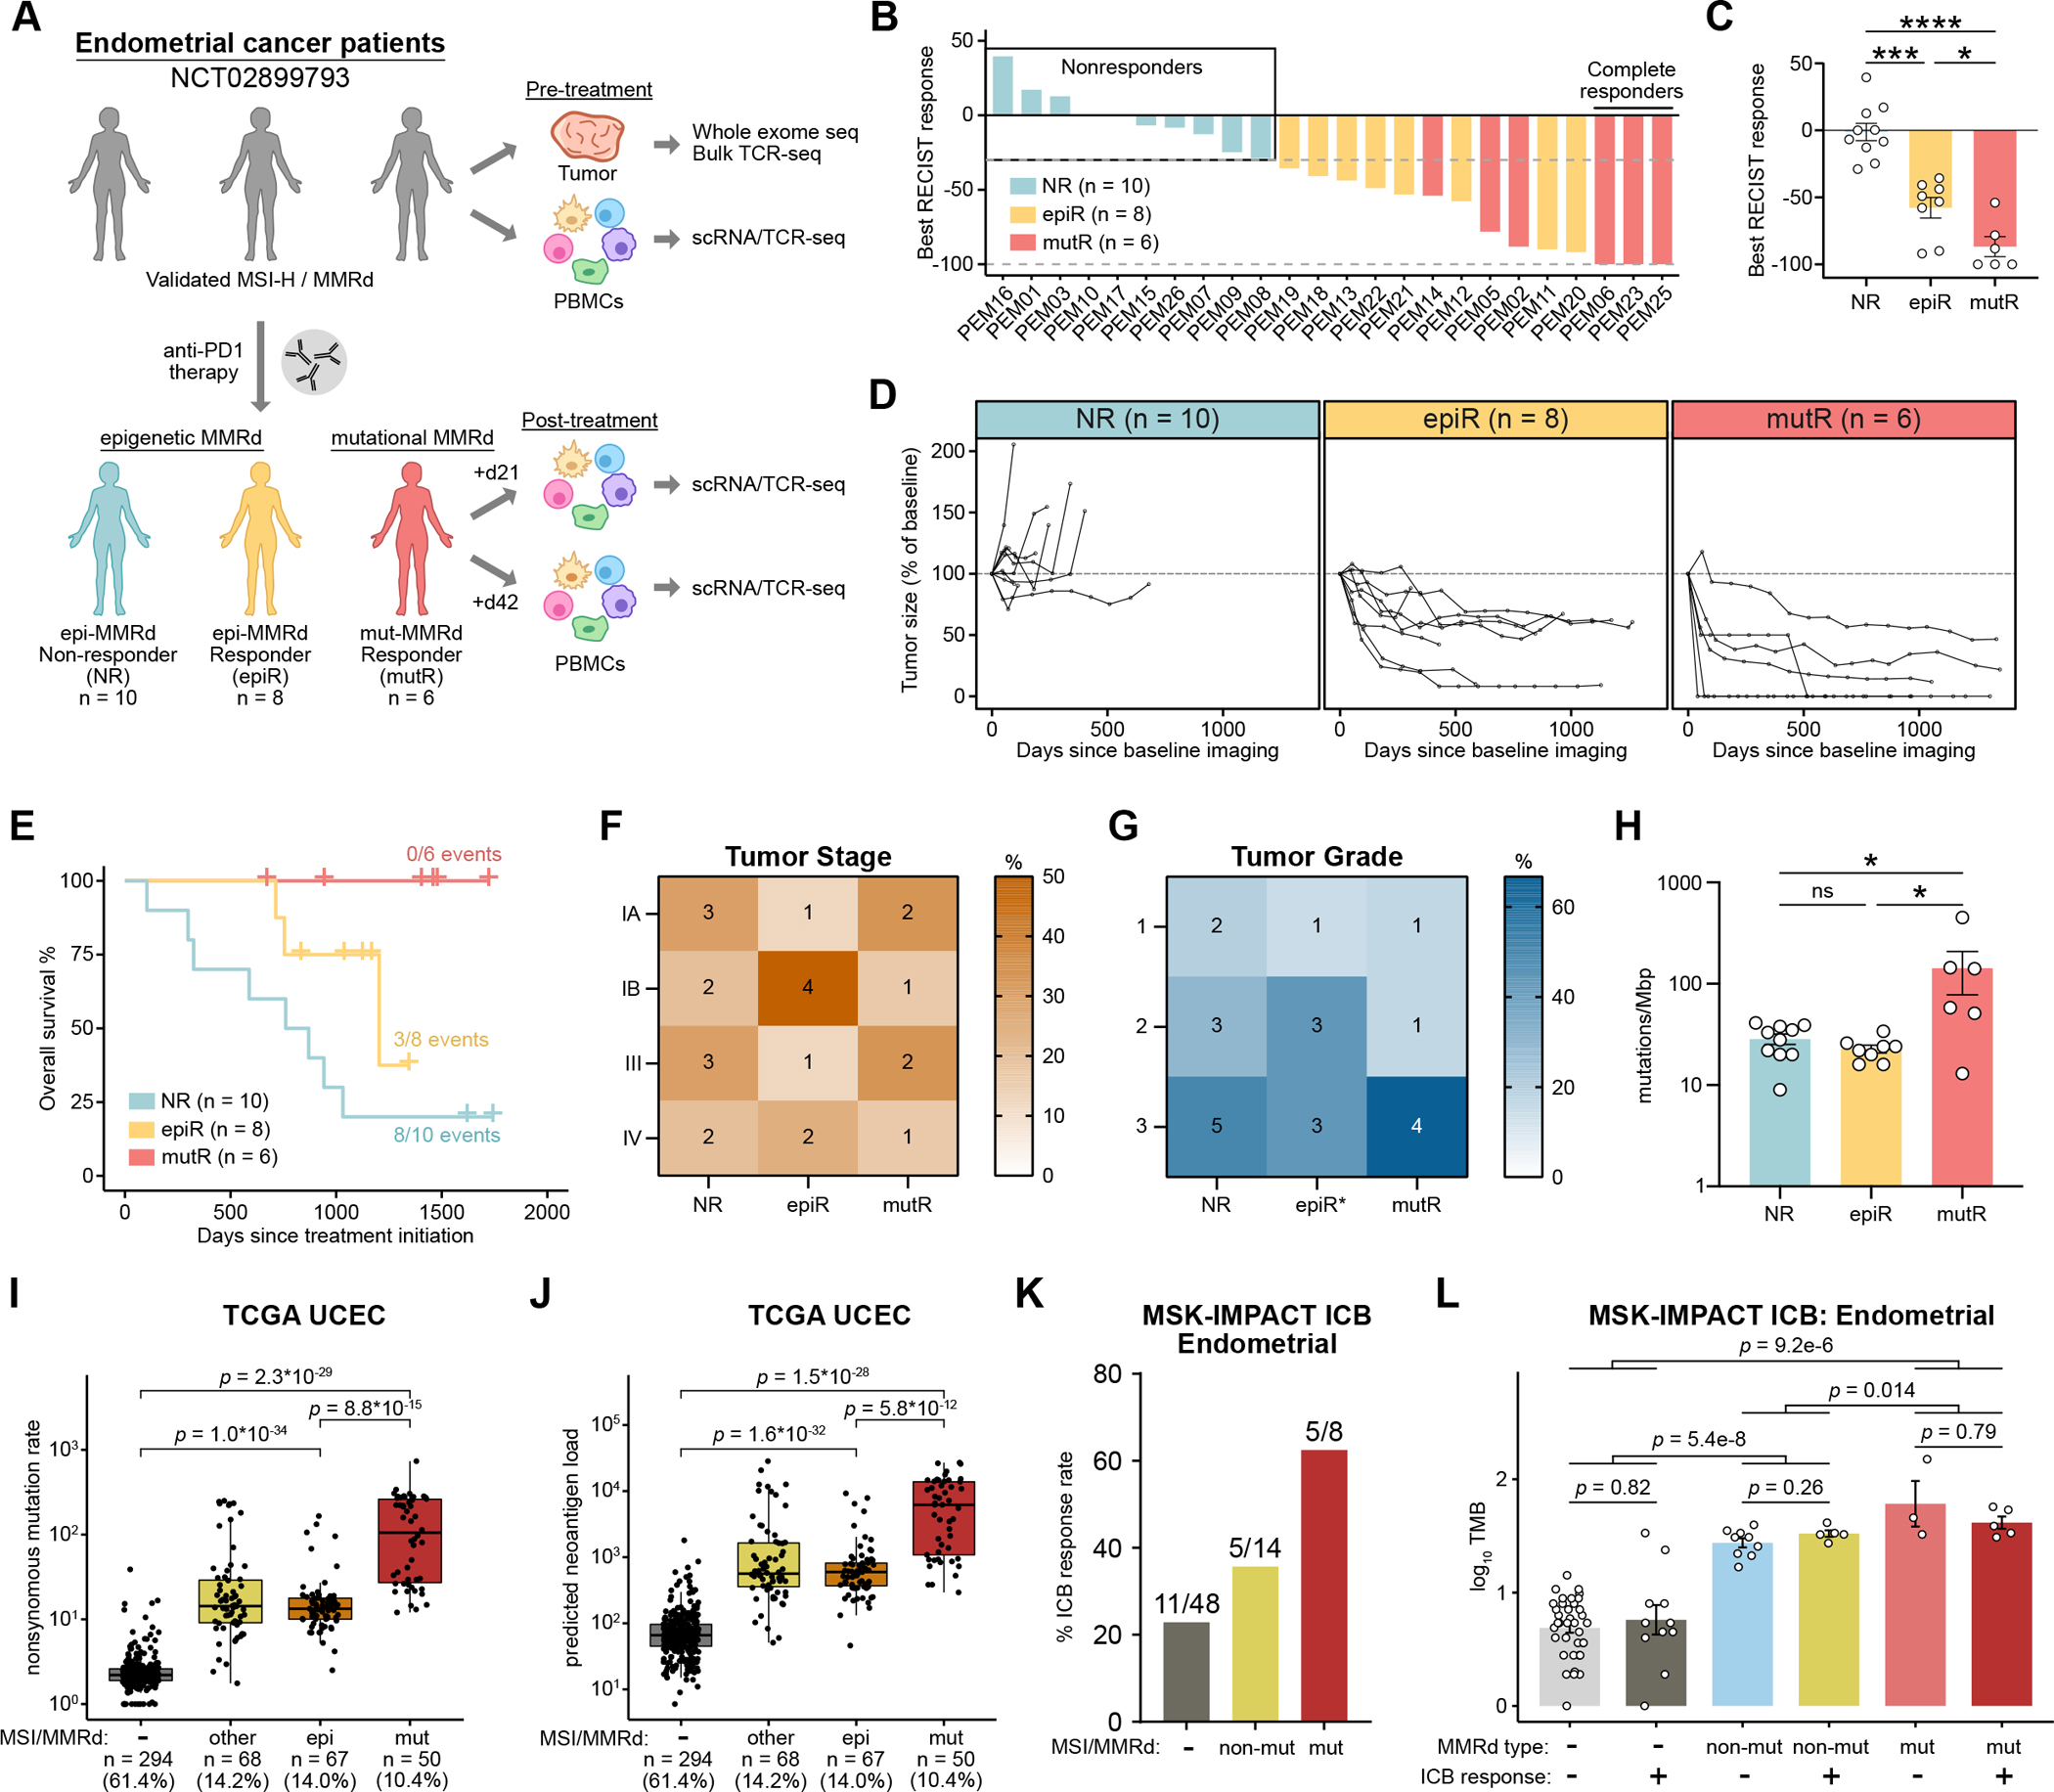
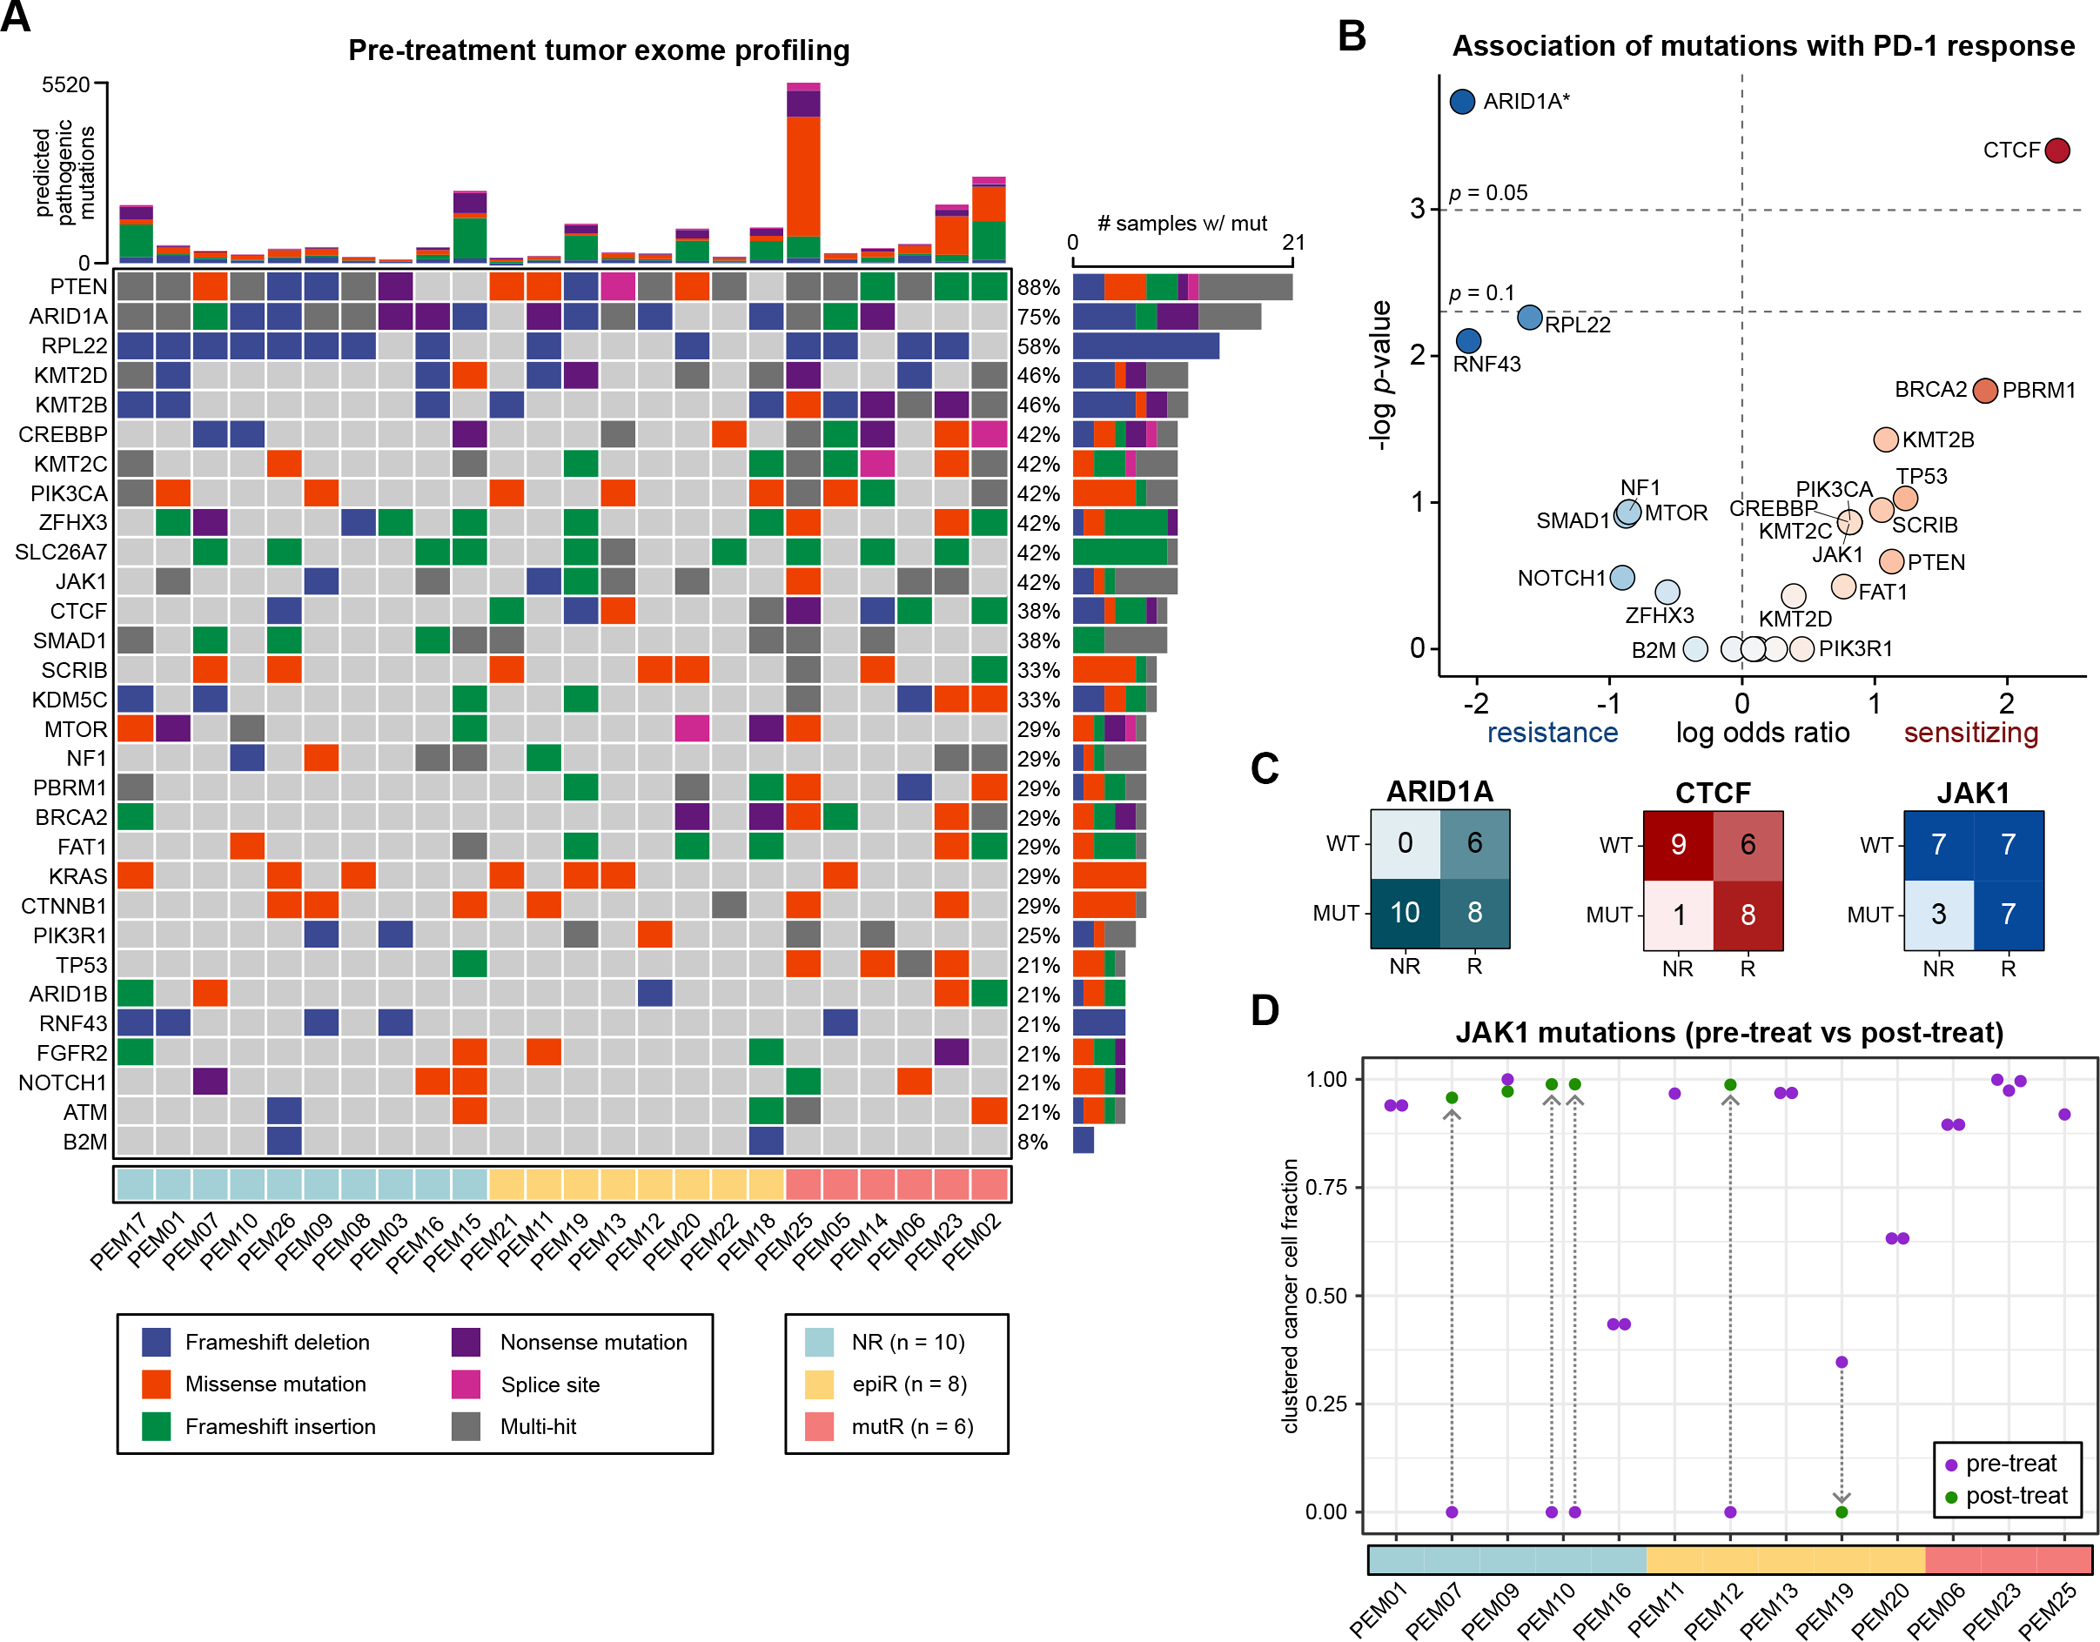
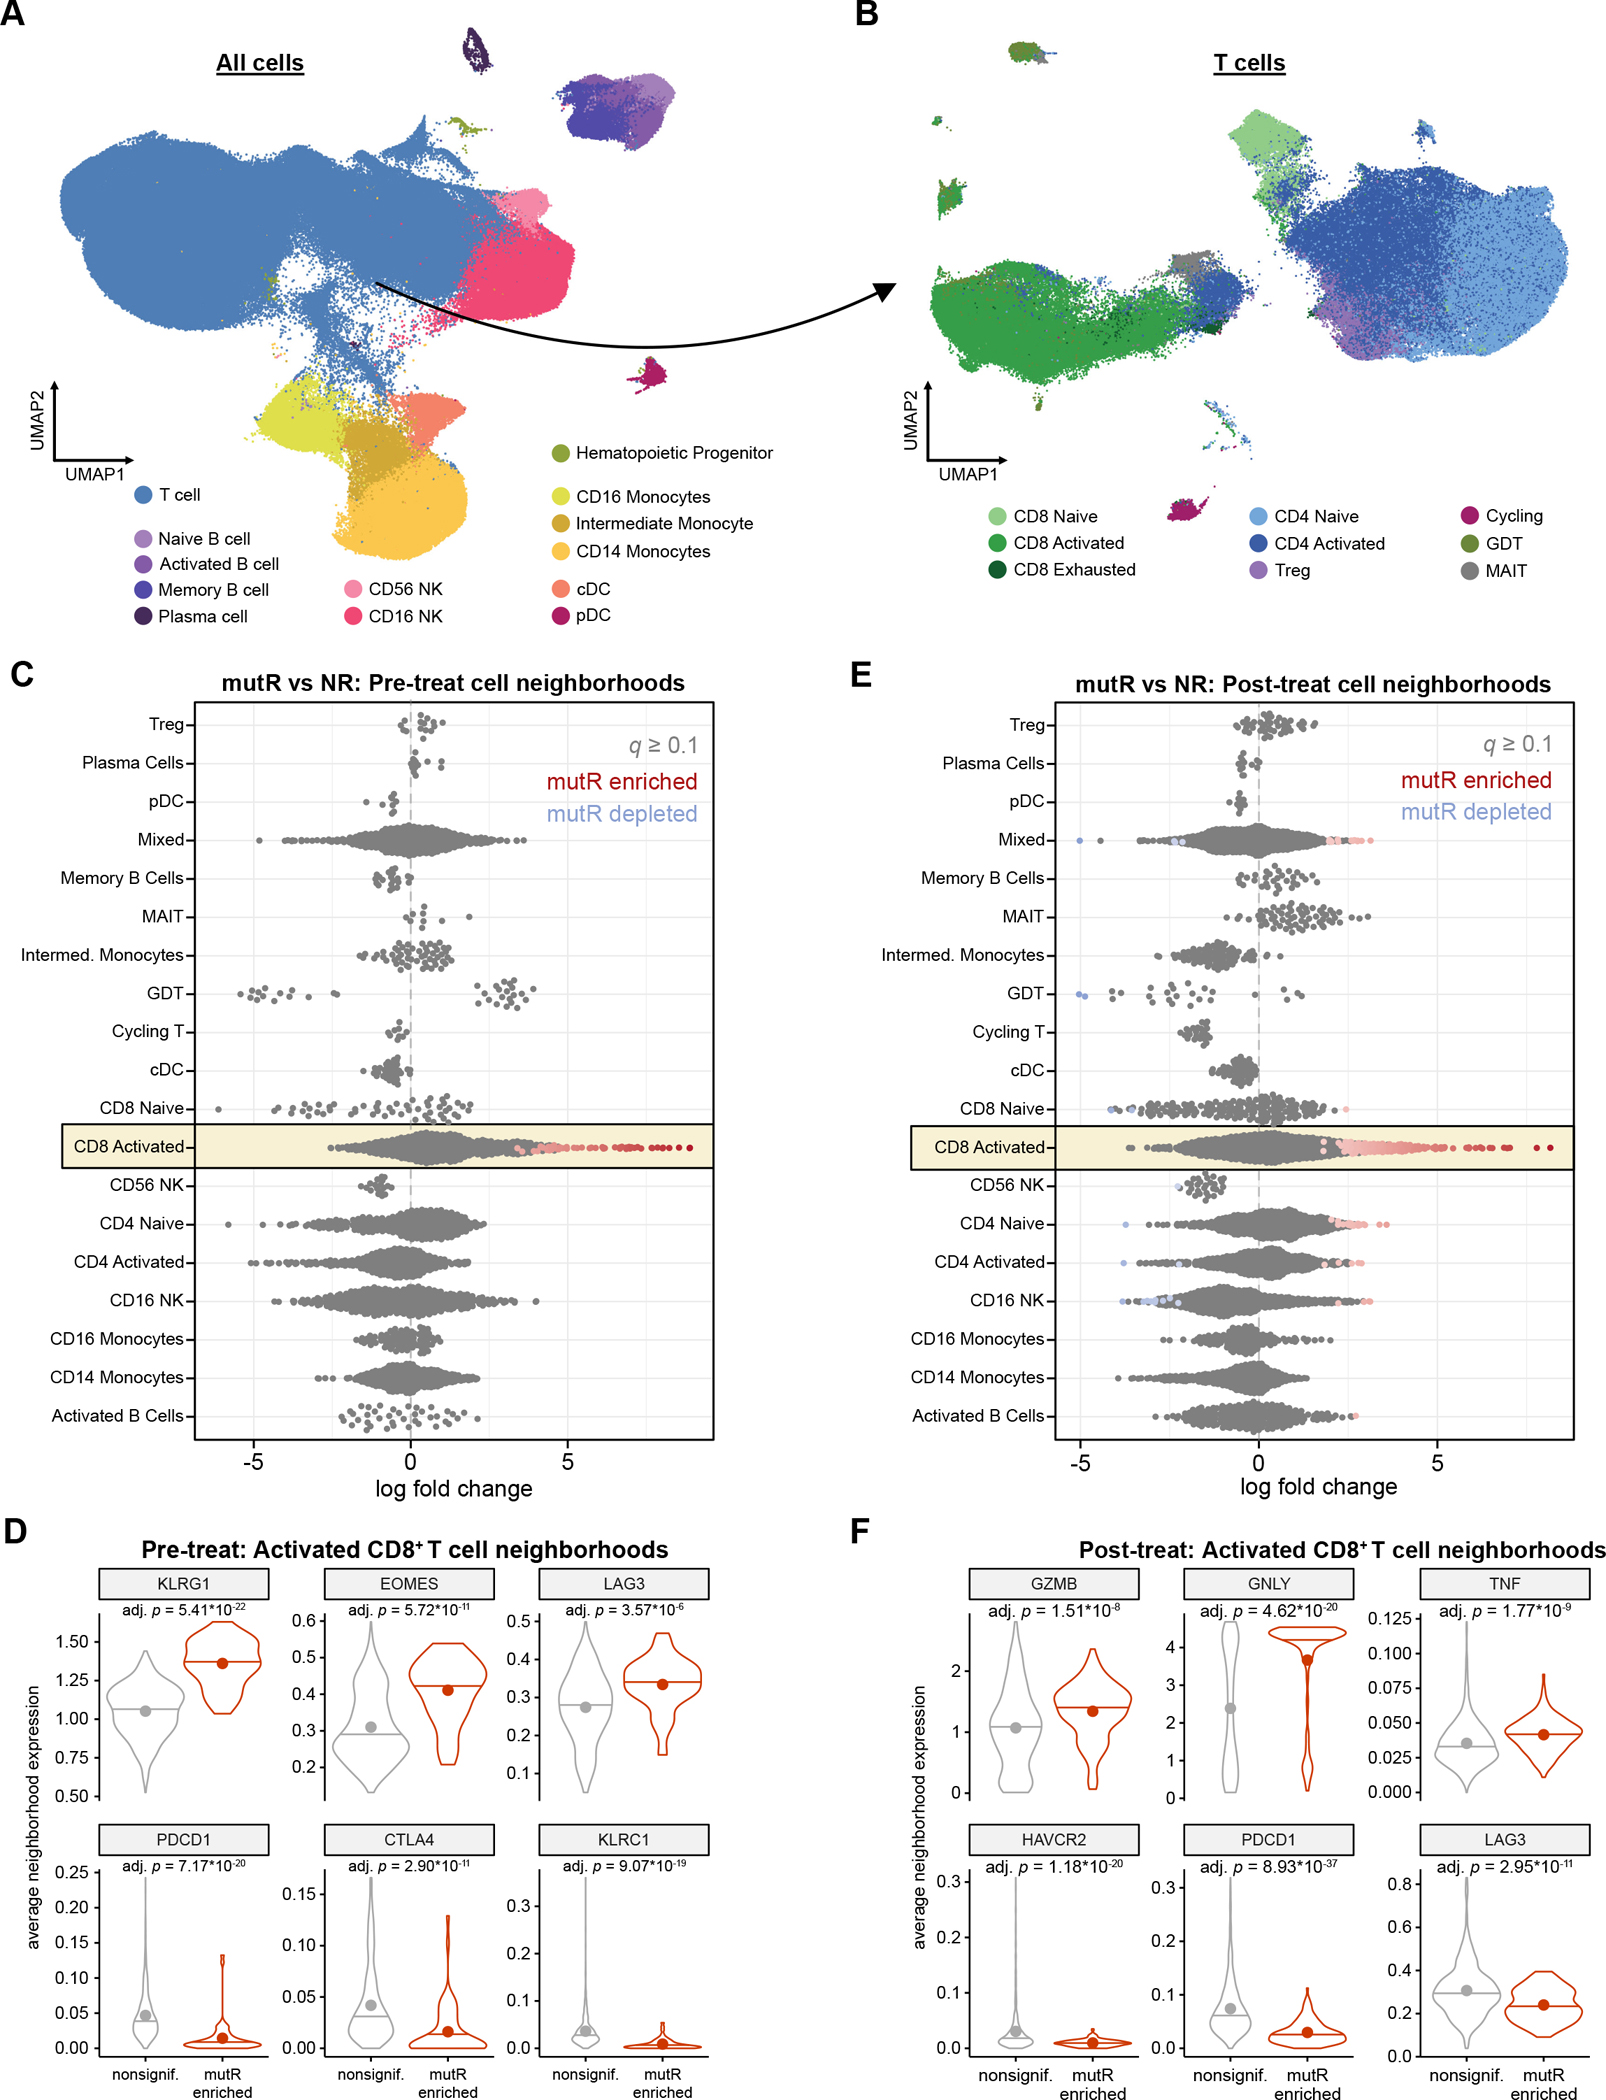
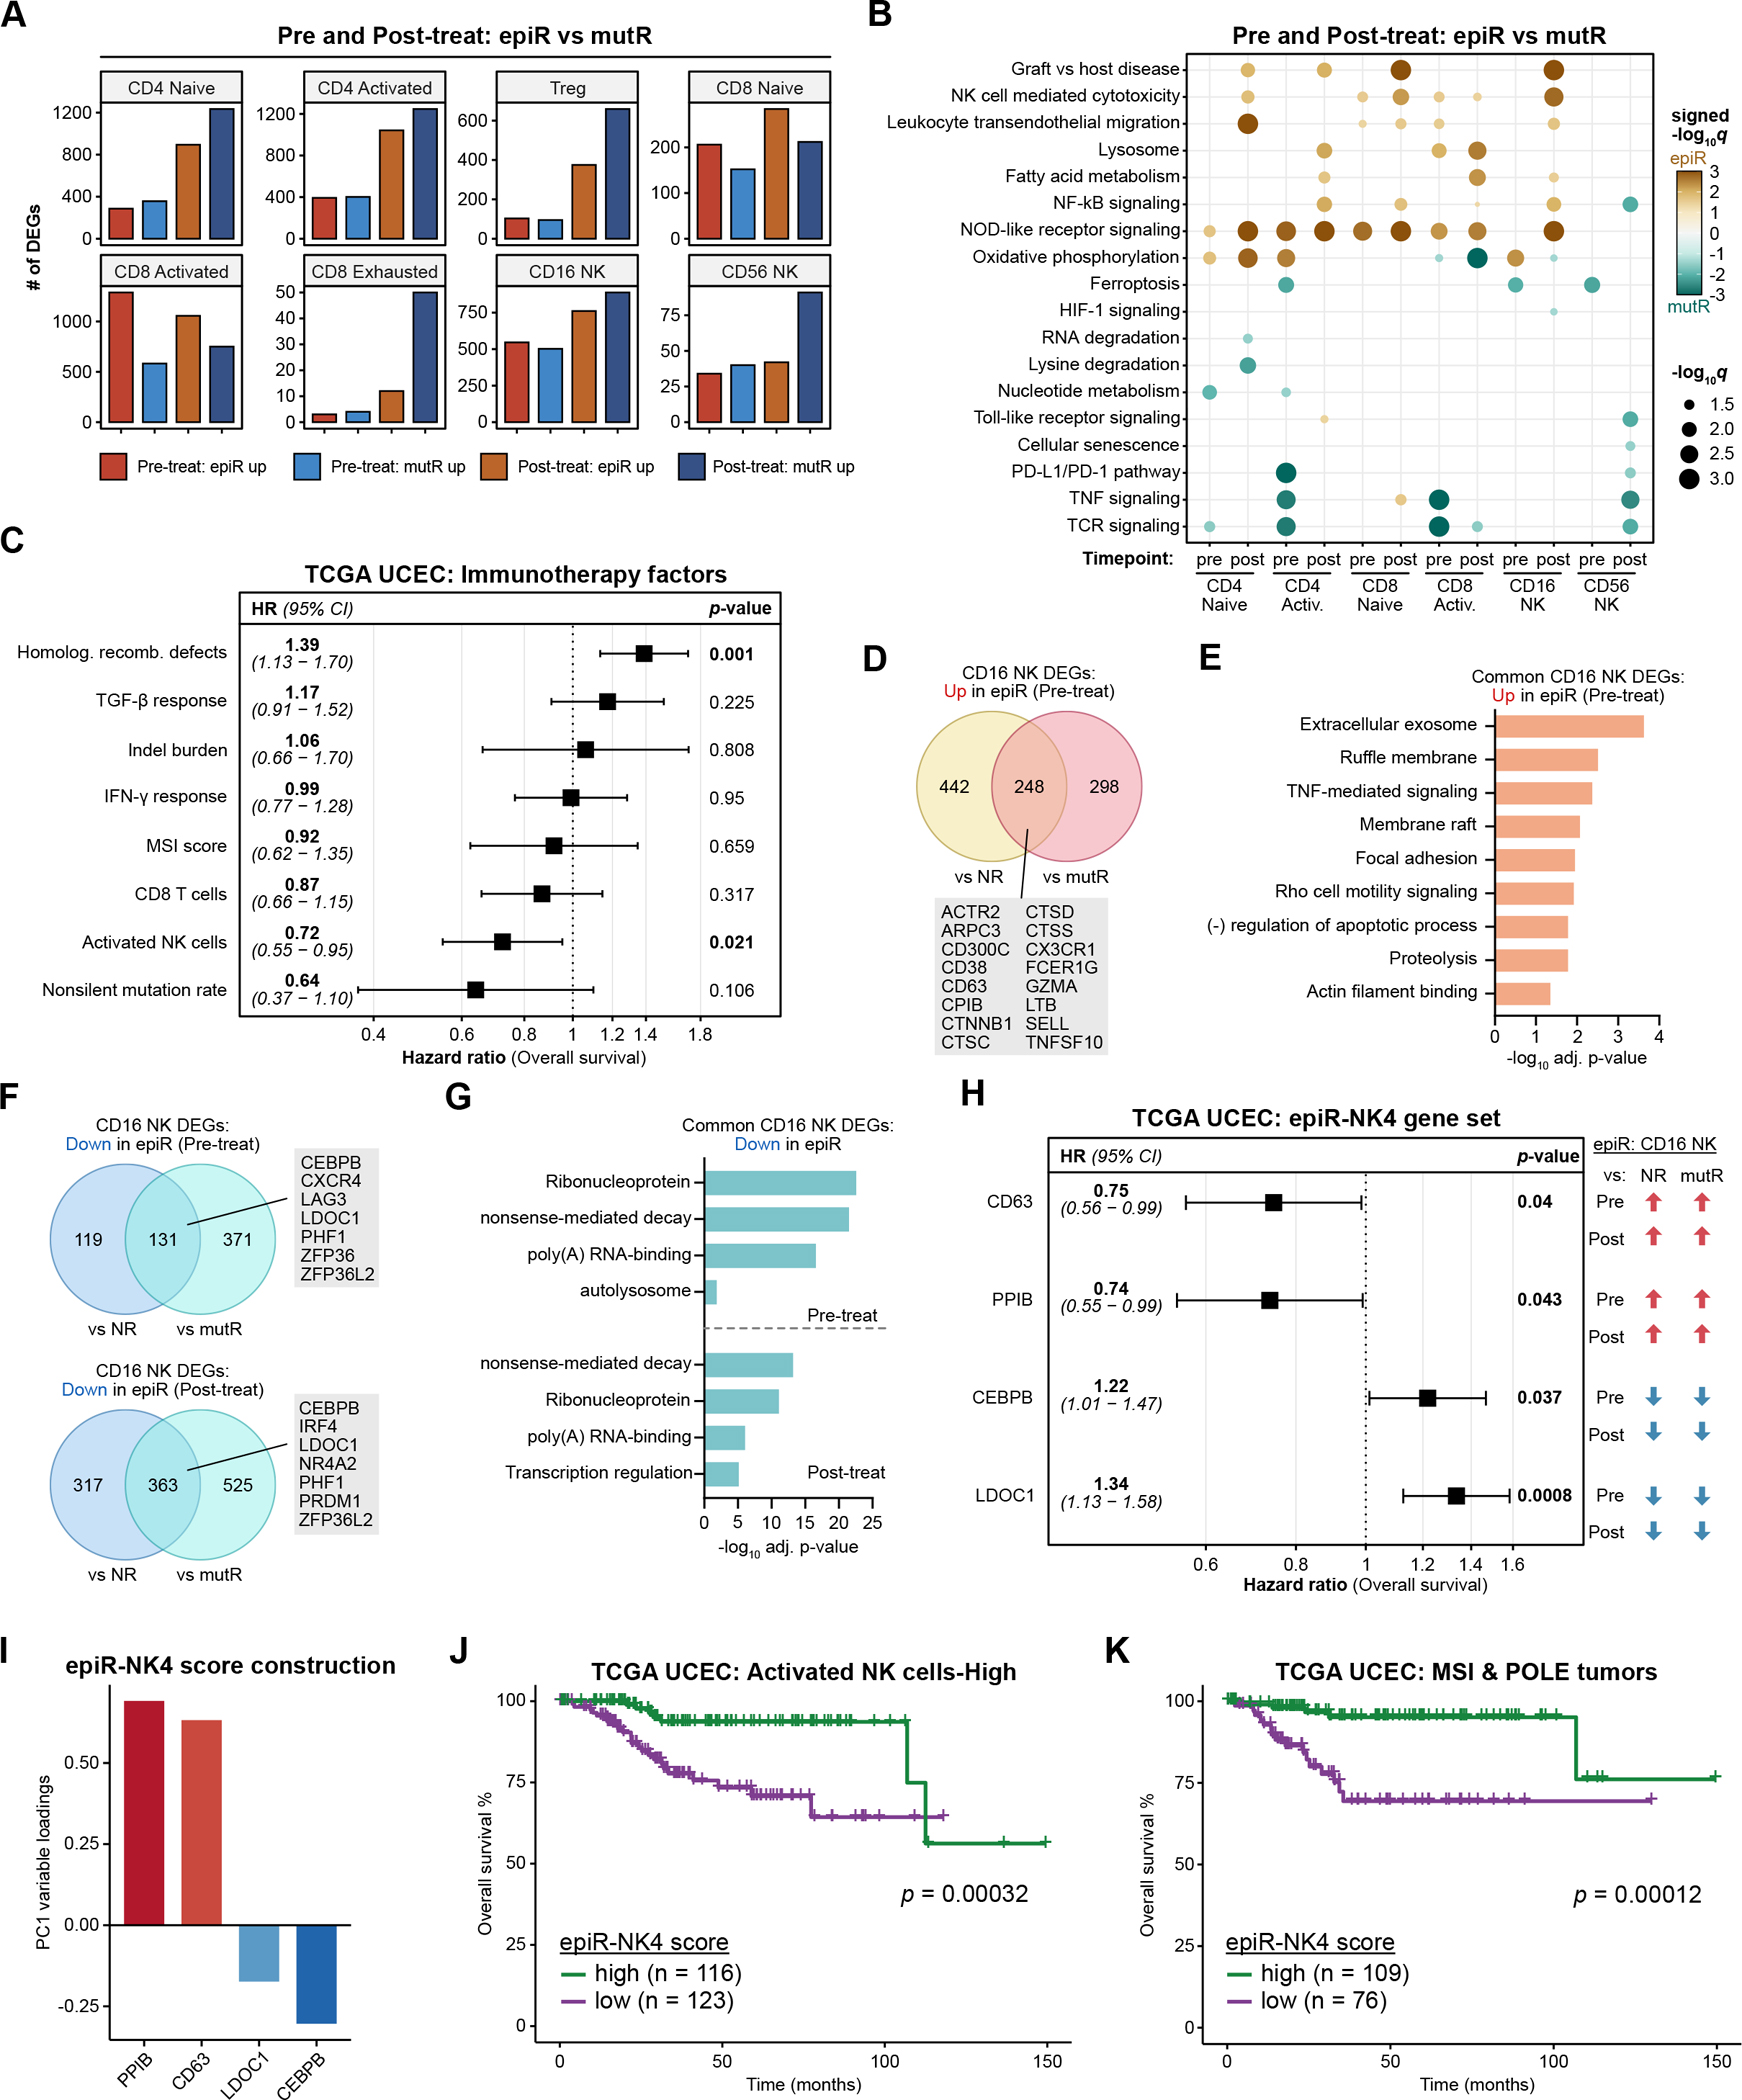
Mismatch repair-deficient (MMRd) cancers have varied responses to immune-checkpoint blockade (ICB). We conducted a phase II clinical trial of the PD-1 inhibitor pembrolizumab in 24 patients with MMRd endometrial cancer (NCT02899793). Patients with mutational MMRd tumors (6 patients) had higher response rates and longer survival than those with epigenetic MMRd tumors (18 patients). Mutation burden was higher in tumors with mutational MMRd compared with epigenetic MMRd; however, within each category of MMRd, mutation burden was not correlated with ICB response. Pretreatment JAK1 mutations were not associated with primary resistance to pembrolizumab. Longitudinal single-cell RNA-seq of circulating immune cells revealed contrasting modes of antitumor immunity for mutational versus epigenetic MMRd cancers. Whereas effector CD8+ T cells correlated with regression of mutational MMRd tumors, activated CD16+ NK cells were associated with ICB-responsive epigenetic MMRd tumors. These data highlight the interplay between tumor-intrinsic and tumor-extrinsic factors that influence ICB response.

Significance: The molecular mechanism of MMRd is associated with response to anti-PD-1 immunotherapy in endometrial carcinoma. Tumors with epigenetic MMRd or mutational MMRd are correlated with NK cell or CD8+ T cell-driven immunity, respectively. Classifying tumors by the mechanism of MMRd may inform clinical decision-making regarding cancer immunotherapy. This article is highlighted in the In This Issue feature, p. 247.


Conflict of interest statement

Conflict of Interest Statement:

Alessandro D. Santin reports grants or contracts from Immunomedics, Genentech, Puma, Gilead, Synthon, Boehringer-Ingelheim, Tesaro, and Eisai (to his institution) and consulting fees from Merck, Tesaro, and Eisai. The other authors declare no potential conflicts of interest.

Figures

Figure 1:
Figure 1:. The molecular mechanism of MMRd influences mutation burden and response to PD-1 immunotherapy
A. Schematic of study design and sample collection strategy. Patients with MSI-H/MMRd endometrial cancer were categorized into three groups based on the molecular mechanism of MMRd, as well as their subsequent response to pembrolizumab: non-responder (NR, n = 10), epigenetic-MMRd responder (epiR, n = 8), and mutational-MMRd responder (mutR, n = 6). B. The maximum percentage reduction in tumor size from baseline, based on RECIST criteria (n = 24 evaluable patients). C. Comparison of maximal RECIST response across the three patient groups. Statistical significance was assessed by one-way ANOVA with Tukey’s multiple comparisons testxs. D. Tumor size over time in each patient, relative to baseline imaging obtained prior to pembrolizumab initiation. E. Kaplan-Meier overall survival curves, calculated relative to the timepoint of pembrolizumab initiation in each patient. F-G. Heatmap of tumor stage (F) and grade (G) annotations across groups. Cells are colored by the percentage of patients within each patient category, with the number of patients indicated in each cell. Tumor grade annotation was not available for one epiR patient. H. Tumor mutation burden across the three patient groups. Statistical significance was assessed by one-way ANOVA with Tukey’s multiple comparisons test. I-J. Nonsynonymous mutation rate (I) and predicted neoantigen load (J) across the TCGA UCEC cohort, with patients categorized by MSI status and the molecular mechanism of MMRd. Statistical significance was assessed by two-tailed unpaired Mann-Whitney test. K. Response rates to ICB therapy among endometrial cancer patients in the MSK-IMPACT ICB cohort. Patients are categorized by MSI status and the presence of mutations in canonical MMR genes. L. Mutation burden across the three groups of endometrial cancer patients in the MSK-IMPACT ICB cohort, further grouped by ICB response. Statistical significance was assessed by two-tailed unpaired Mann-Whitney test.
Figure 2:
Figure 2:. JAK1 mutations do not confer primary resistance to PD-1 checkpoint immunotherapy
A. Mutation profiles of pre-treatment tumors, filtered for predicted pathogenic or deleterious mutations. B. Association between individual mutations and response to PD-1 immunotherapy. Data are expressed as log odds ratios. A pseudocount was added for ARID1A, as all patients with non-mutant ARID1A responded to ICB. Statistical significance was assessed by two-tailed Fisher’s exact test. C. Association of ARID1A, CTCF and JAK1 mutations with PD-1 immunotherapy response. D. JAK1-mutant cancer cell fractions (CCFs) in JAK1-mutant tumors, after clustering. Each point represents a unique JAK1 variant that was identified in a particular sample. Pre-treatment CCFs are annotated in purple, while post-treatment CCFs are in green, with arrows connecting the same variant across timepoints.
Figure 3:
Figure 3:. Effector CD8+ T cells are enriched in mut-MMRd responders but not in epi-MMRd responders
A. UMAP visualization of all PBMCs profiled by scRNA-seq. Data shown are integrated with healthy donor PBMCs for cell annotation and visualization. B. UMAP visualization of T cells profiled by scRNA-seq, reclustered to identify T cell subsets. Data shown are integrated with healthy donor T cells for cell annotation and visualization. C. Differential abundance analysis of cell neighborhoods in mutR vs. NR patients, before PD-1 immunotherapy. Each point represents one cell neighborhood. Statistical significance was determined through a generalized linear model with Benjamini-Hochberg multiple hypothesis correction, as implemented in Milo. D. Violin plots of select differentially expressed genes in activated CD8+ T cell neighborhoods that are enriched in mutR vs. NR patients, before PD-1 immunotherapy. Horizontal lines indicate the median, while points indicate the mean. Statistical significance was assessed by two-sided Mann-Whitney test, with Benjamini-Hochberg multiple hypothesis correction. E. Differential abundance analysis of cell neighborhoods in mutR vs. NR patients, after PD-1 immunotherapy. Statistical significance was determined through a generalized linear model with Benjamini-Hochberg multiple hypothesis correction, as implemented in Milo. F. Violin plots of select differentially expressed genes in activated CD8+ T cell neighborhoods that are enriched in mutR vs. NR patients, after PD-1 immunotherapy. Horizontal lines indicate the median, while points indicate the mean. Statistical significance was assessed by two-sided Mann-Whitney test, with Benjamini-Hochberg multiple hypothesis correction.
Figure 4:
Figure 4:. Transcriptional features of NK cells in epi-MMRd responders are associated with survival
A. The number of DEGs in T and NK cell populations when comparing epiR vs. mutR patients, before or after PD-1 immunotherapy. B. Dot plots detailing significantly upregulated or downregulated pathways in each of the cell types, comparing epiR patients to mutR patients, before or after PD-1 immunotherapy. Statistical significance was assessed by hypergeometric test with Benjamini-Hochberg multiple hypothesis correction, visualized as signed −log10 q-values. C. Forest plot detailing the results of a multivariable Cox proportional hazards model for overall survival in the TCGA UCEC cohort, examining several factors previously associated with response or resistance to ICB immunotherapy. D-E. Venn diagram (D) and gene ontology enrichment analysis (E) of DEGs in CD16+ NK cells that are significantly upregulated in epiR patients compared to NR or mutR patients, before PD-1 immunotherapy. Statistical significance in (E) was assessed by hypergeometric test with Benjamini-Hochberg multiple hypothesis correction. F-G. Venn diagram (F) and gene ontology enrichment analysis (G) of DEGs in CD16+ NK cells that are significantly downregulated in epiR patients compared to NR or mutR patients, before (upper panel) or after PD-1 immunotherapy (lower panel). Statistical significance in (G) was assessed by hypergeometric test with Benjamini-Hochberg multiple hypothesis correction. H. Forest plot detailing the results of a multivariable Cox proportional hazards model for overall survival in the TCGA UCEC cohort, examining a set of four genes (epiR-NK4) that were consistently upregulated (CD63, PPIB) or downregulated (CEBPB, LDOC1) in CD16+ NK cells from epiR patients. These four genes were selected through Lasso regression from a total of 111 genes that were concordantly upregulated or downregulated in CD16+ NK cells from epiR patients. I. Variable loadings for the first principal component (PC1) of the TCGA UCEC dataset, based on expression levels of the epiR-NK4 gene set. J-K. Kaplan-Meier survival analysis of the TCGA UCEC cohort, subsetted on tumors with a high activated NK cell score (J) or tumors annotated as MSI-H/POLE-hypermutated (K). Patients were stratified by their epiR-NK4 scores, corresponding to PC1 of the epiR-NK4 gene set as in (I), and classifying into high and low groups based on the median score. Statistical significance was assessed by log-rank test.

References

    1. Bonneville R, Krook MA, Kautto EA, Miya J, Wing MR, Chen H-Z, et al. Landscape of Microsatellite Instability Across 39 Cancer Types. JCO Precision Oncology. Wolters Kluwer; 2017;1–15. - PMC - PubMed
    1. Hause RJ, Pritchard CC, Shendure J, Salipante SJ. Classification and characterization of microsatellite instability across 18 cancer types. Nat Med. 2016;22:1342–50. - PubMed
    1. Germano G, Lamba S, Rospo G, Barault L, Magrì A, Maione F, et al. Inactivation of DNA repair triggers neoantigen generation and impairs tumour growth. Nature. 2017;552:116–20. - PubMed
    1. Mandal R, Samstein RM, Lee K-W, Havel JJ, Wang H, Krishna C, et al. Genetic diversity of tumors with mismatch repair deficiency influences anti–PD-1 immunotherapy response. Science. 2019;364:485–91. - PMC - PubMed
    1. André T, Shiu K-K, Kim TW, Jensen BV, Jensen LH, Punt C, et al. Pembrolizumab in Microsatellite-Instability–High Advanced Colorectal Cancer. New England Journal of Medicine. Massachusetts Medical Society; 2020;383:2207–18. - PubMed

Publication types

Supplementary concepts