. 2022 Dec 15;128(24):4251-4284.
doi: 10.1002/cncr.34479. Epub 2022 Oct 27.

Annual report to the nation on the status of cancer, part 1: National cancer statistics

Affiliations

Annual report to the nation on the status of cancer, part 1: National cancer statistics

Kathleen A Cronin et al. Cancer. .

Abstract

Background: The American Cancer Society, the Centers for Disease Control and Prevention, the National Cancer Institute, and the North American Association of Central Cancer Registries collaborate to provide annual updates on cancer occurrence and trends in the United States.

Methods: Data on new cancer diagnoses during 2001-2018 were obtained from the North American Association of Central Cancer Registries' Cancer in North America Incidence file, which is comprised of data from Centers for Disease Control and Prevention-funded and National Cancer Institute-funded, population-based cancer registry programs. Data on cancer deaths during 2001-2019 were obtained from the National Center for Health Statistics' National Vital Statistics System. Five-year average incidence and death rates along with trends for all cancers combined and for the leading cancer types are reported by sex, racial/ethnic group, and age.

Results: Overall cancer incidence rates were 497 per 100,000 among males (ranging from 306 among Asian/Pacific Islander males to 544 among Black males) and 431 per 100,000 among females (ranging from 309 among Asian/Pacific Islander females to 473 among American Indian/Alaska Native females) during 2014-2018. The trend during the corresponding period was stable among males and increased 0.2% on average per year among females, with differing trends by sex, racial/ethnic group, and cancer type. Among males, incidence rates increased for three cancers (including pancreas and kidney), were stable for seven cancers (including prostate), and decreased for eight (including lung and larynx) of the 18 most common cancers considered in this analysis. Among females, incidence rates increased for seven cancers (including melanoma, liver, and breast), were stable for four cancers (including uterus), and decreased for seven (including thyroid and ovary) of the 18 most common cancers. Overall cancer death rates decreased by 2.3% per year among males and by 1.9% per year among females during 2015-2019, with the sex-specific declining trend reflected in every major racial/ethnic group. During 2015-2019, death rates decreased for 11 of the 19 most common cancers among males and for 14 of the 20 most common cancers among females, with the steepest declines (>4% per year) reported for lung cancer and melanoma. Five-year survival for adenocarcinoma and neuroendocrine pancreatic cancer improved between 2001 and 2018; however, overall incidence (2001-2018) and mortality (2001-2019) continued to increase for this site. Among children (younger than 15 years), recent trends were stable for incidence and decreased for mortality; and among, adolescents and young adults (aged 15-39 years), recent trends increased for incidence and declined for mortality.

Conclusions: Cancer death rates continued to decline overall, for children, and for adolescents and young adults, and treatment advances have led to accelerated declines in death rates for several sites, such as lung and melanoma. The increases in incidence rates for several common cancers in part reflect changes in risk factors, screening test use, and diagnostic practice. Racial/ethnic differences exist in cancer incidence and mortality, highlighting the need to understand and address inequities. Population-based incidence and mortality data inform prevention, early detection, and treatment efforts to help reduce the cancer burden in the United States.

Keywords: cancer; cancer death rate; incidence; mortality; pancreas.


Conflict of interest statement

Betsy A. Kohler reports personal fees from the National Firefighters Registry outside the submitted work and is a fiduciary officer of the North American Association of Central Cancer Registries. Charles Wiggins reports personal fees from the Northwest Portland Area Indian Health Board outside the submitted work and is a fiduciary officer of the International Association of Cancer Registries. William G. Cance reports personal fees from the University of North Carolina at Chapel Hill School of Medicine outside the submitted work, service on an ACRIN Data and Safety Monitoring Board, and has a spouse/partner who is a consultant for FAKnostics. The remaining authors made no disclosures.

Figures

FIGURE 1
FIGURE 1
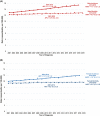
Trends in age‐standardized incidence (2001−2018) and mortality (2001−2019) rates are illustrated for all cancer sites combined, all ages and all racial/ethnic groups combined, by sex. Trends were estimated using joinpoint regression and characterized by using the annual percent change (APC), the slope of a single segment, and the average APC (AAPC), a summary measure of the APCs over a fixed 5‐year interval. Joinpoint models with up to three joinpoints are based on rates per 100,000 population and are age standardized to the 2000 US standard population (19 age groups; US Bureau of the Census. Current Population Report P25‐1130. US Government Printing Office; 2000). Incidence rates were delay‐adjusted and covered 92% of the US population, and mortality covered the entire United States. Registries included in the joinpoint models (2001–2018) for all races/ethnicities (46 states): Alabama, Alaska, Arizona, Arkansas, California, Colorado, Connecticut, Delaware, Florida, Georgia, Hawaii, Idaho, Illinois, Indiana, Iowa, Kansas, Kentucky, Louisiana, Maine, Maryland, Massachusetts, Michigan, Minnesota, Missouri, Montana, Nebraska, New Hampshire, New Jersey, New Mexico, New York, North Carolina, North Dakota, Ohio, Oklahoma, Oregon, Pennsylvania, Rhode Island, South Carolina, South Dakota, Texas, Utah, Vermont, Washington, West Virginia, Wisconsin, and Wyoming. Scattered points were observed rates; lines were fitted rates according to joinpoint regression. An asterisk (*) indicates that the APC or AAPC is statistically significantly different from zero (p < .05); 95% confidence limits are given in parentheses
FIGURE 2
FIGURE 2
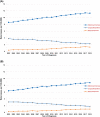
Age‐standardized, delay‐adjusted overall cancer incidence rates (2014–2018) and age‐standardized overall cancer death rates (2015–2019) are illustrated for all cancer sites combined, all ages, by sex and racial/ethnic group. Racial/ethnic groups are mutually exclusive. Data for non‐Hispanic AI/AN individuals are restricted to counties with Indian Health Service Purchased/Referred Care Delivery Areas. AI/AN indicates American Indian/Alaska Native; API, Asian/Pacific Islander
FIGURE 3
FIGURE 3
Average annual percent changes (AAPCs) in (A) age‐standardized, delay‐adjusted incidence rates for 2014–2018 are illustrated for all sites and for the 18 most common cancers in men and women; and (B) the age‐standardized death rates for 2015–2019 are illustrated for all sites and for the 19 most common cancer deaths in men and for the 20 most common cancer deaths in women, all ages, all racial/ethnic groups combined, by sex. The AAPC was a weighted average of the annual percent changes (APCs) over the fixed 5‐year interval (incidence, 2014–2018; mortality, 2015–2019) using the underlying joinpoint regression model, which allowed up to three different APCs, for the 17‐year period 2001–2018 for incidence and the 18‐year period 2001–2019 for mortality. AAPCs with an asterisk (*) were statistically significantly different from zero (p < .05) and are depicted as solid‐colored bars; AAPCs with hash marks were not statistically significantly different from zero (stable). NOS indicates not otherwise specified
FIGURE 3
FIGURE 3
Average annual percent changes (AAPCs) in (A) age‐standardized, delay‐adjusted incidence rates for 2014–2018 are illustrated for all sites and for the 18 most common cancers in men and women; and (B) the age‐standardized death rates for 2015–2019 are illustrated for all sites and for the 19 most common cancer deaths in men and for the 20 most common cancer deaths in women, all ages, all racial/ethnic groups combined, by sex. The AAPC was a weighted average of the annual percent changes (APCs) over the fixed 5‐year interval (incidence, 2014–2018; mortality, 2015–2019) using the underlying joinpoint regression model, which allowed up to three different APCs, for the 17‐year period 2001–2018 for incidence and the 18‐year period 2001–2019 for mortality. AAPCs with an asterisk (*) were statistically significantly different from zero (p < .05) and are depicted as solid‐colored bars; AAPCs with hash marks were not statistically significantly different from zero (stable). NOS indicates not otherwise specified
FIGURE 4
FIGURE 4
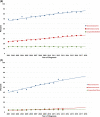
Trends in age‐standardized incidence (2001–2018) and mortality (2001–2019) rates for pancreas cancer, for all racial/ethnic groups combined and all ages combined, are illustrated in (A) males and (B) females. Trends were estimated using joinpoint regression and characterized by using the annual percent change (APC), the slope of a single segment, and the average APC (AAPC), a summary measure of the APCs over a fixed 5‐year interval. Joinpoint models with up to three joinpoints are based on rates per 100,000 population and are age standardized to the 2000 US standard population (19 age groups; US Bureau of the Census. Current Population Report P25‐1130. US Government Printing Office; 2000). Incidence rates were delay‐adjusted and covered 92% of the US population, and mortality covered the entire United States. APCs and AAPCs with an asterisk (*) were statistically significantly different from zero (p < .05)
FIGURE 5
FIGURE 5
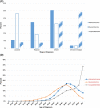
Cancer statistics for pancreas cancer by subtype are illustrated, including (A) male incidence rates (2001–2018) for all racial/ethnic groups combined and all ages combined, (B) female incidence rates (2001–2018) for all racial/ethnic groups combined and all ages combined, (C) stage distribution for cases diagnosed between 2014 and 2018, (D) age distribution for cases diagnosed between 2014 and 2018, (E) trends in observed and modeled 1‐year relative survival rates (2001–2018) for all racial/ethnic groups combined and all ages combined, and (F) trends in observed and modeled 5‐year relative survival rates (2001–2018) for all racial/ethnic groups combined and all ages combined. Incidence rates are based on rates per 100,000 population and are age standardized to the 2000 US standard population (19 age groups; US Bureau of the Census. Current Population Report P25‐1130. US Government Printing Office; 2000) and were delay‐adjusted. Registries included in the calculation of incidence trends, and stage and age distributions covered 92% of the US population (46 states): Alabama, Alaska, Arizona, Arkansas, California, Colorado, Connecticut, Delaware, Florida, Georgia, Hawaii, Idaho, Illinois, Indiana, Iowa, Kansas, Kentucky, Louisiana, Maine, Maryland, Massachusetts, Michigan, Minnesota, Missouri, Montana, Nebraska, New Hampshire, New Jersey, New Mexico, New York, North Carolina, North Dakota, Ohio, Oklahoma, Oregon, Pennsylvania, Rhode Island, South Carolina, South Dakota, Texas, Utah, Vermont, Washington, West Virginia, Wisconsin, and Wyoming. Trends in relative survival were estimated using the joinpoint survival model JPSurv. Registries included in the survival calculation cover 78% of the US population (39 states): Alabama, Alaska, Arizona, Arkansas, California, Colorado, Connecticut, Delaware, Georgia, Hawaii, Idaho, Illinois, Iowa, Kansas, Kentucky, Louisiana, Maine, Maryland, Minnesota, Mississippi, Missouri, Montana, Nebraska, New Hampshire, New Jersey, New Mexico, New York, North Carolina, North Dakota, Ohio, Pennsylvania, Rhode Island, South Carolina, Texas, Utah, Washington, West Virginia, Wisconsin, and Wyoming
FIGURE 5
FIGURE 5
Cancer statistics for pancreas cancer by subtype are illustrated, including (A) male incidence rates (2001–2018) for all racial/ethnic groups combined and all ages combined, (B) female incidence rates (2001–2018) for all racial/ethnic groups combined and all ages combined, (C) stage distribution for cases diagnosed between 2014 and 2018, (D) age distribution for cases diagnosed between 2014 and 2018, (E) trends in observed and modeled 1‐year relative survival rates (2001–2018) for all racial/ethnic groups combined and all ages combined, and (F) trends in observed and modeled 5‐year relative survival rates (2001–2018) for all racial/ethnic groups combined and all ages combined. Incidence rates are based on rates per 100,000 population and are age standardized to the 2000 US standard population (19 age groups; US Bureau of the Census. Current Population Report P25‐1130. US Government Printing Office; 2000) and were delay‐adjusted. Registries included in the calculation of incidence trends, and stage and age distributions covered 92% of the US population (46 states): Alabama, Alaska, Arizona, Arkansas, California, Colorado, Connecticut, Delaware, Florida, Georgia, Hawaii, Idaho, Illinois, Indiana, Iowa, Kansas, Kentucky, Louisiana, Maine, Maryland, Massachusetts, Michigan, Minnesota, Missouri, Montana, Nebraska, New Hampshire, New Jersey, New Mexico, New York, North Carolina, North Dakota, Ohio, Oklahoma, Oregon, Pennsylvania, Rhode Island, South Carolina, South Dakota, Texas, Utah, Vermont, Washington, West Virginia, Wisconsin, and Wyoming. Trends in relative survival were estimated using the joinpoint survival model JPSurv. Registries included in the survival calculation cover 78% of the US population (39 states): Alabama, Alaska, Arizona, Arkansas, California, Colorado, Connecticut, Delaware, Georgia, Hawaii, Idaho, Illinois, Iowa, Kansas, Kentucky, Louisiana, Maine, Maryland, Minnesota, Mississippi, Missouri, Montana, Nebraska, New Hampshire, New Jersey, New Mexico, New York, North Carolina, North Dakota, Ohio, Pennsylvania, Rhode Island, South Carolina, Texas, Utah, Washington, West Virginia, Wisconsin, and Wyoming

References

    1. Sherman R, Firth R, Charlton M, et al., eds. Cancer in North America: 2014‐2018. Volume One: Combined Cancer Incidence for the United States, Canada and North America. North American Association of Central Cancer Registries, Inc.; 2021.
    1. Fritz A, Percy C, Jack A, Shanmugaratnam K, Sobin LH. International Classification of Diseases for Oncology. 3rd ed. World Health Organization; 2000. Accessed February 1, 2022. https://apps.who.int/iris/handle/10665/42344
    1. Swerdlow SH, Campo E, Harris NL, et al., eds. WHO Classification of Tumours of Haematopoietic and Lymphoid Tissues. 4th ed. Vol. 2. IARC Press; 2008.
    1. National Cancer Institute . Site Recode ICD‐O‐3/WHO 2008 Definition. SEER Data Reporting Tools. National Cancer Institute, Surveillance, Epidemiology, and End Results (SEER) Program. Accessed February 1, 2022. https://seer.cancer.gov/siterecode/icdo3_dwhoheme/
    1. World Health Organization. International Classification of Diseases for Oncology (‎ICD‐O) 3rd ed. 1st revision. World Health Organization; 2013. Accessed February 1, 2022. https://apps.who.int/iris/handle/10665/96612

Publication types

Grants and funding