. 2022 Nov;27(6):e13238.
doi: 10.1111/adb.13238.

Embryonic ethanol exposure induces ectopic Hcrt and MCH neurons outside hypothalamus in rats and zebrafish: Role in ethanol-induced behavioural disturbances

Affiliations

Embryonic ethanol exposure induces ectopic Hcrt and MCH neurons outside hypothalamus in rats and zebrafish: Role in ethanol-induced behavioural disturbances

Adam D Collier et al. Addict Biol. 2022 Nov.

Abstract

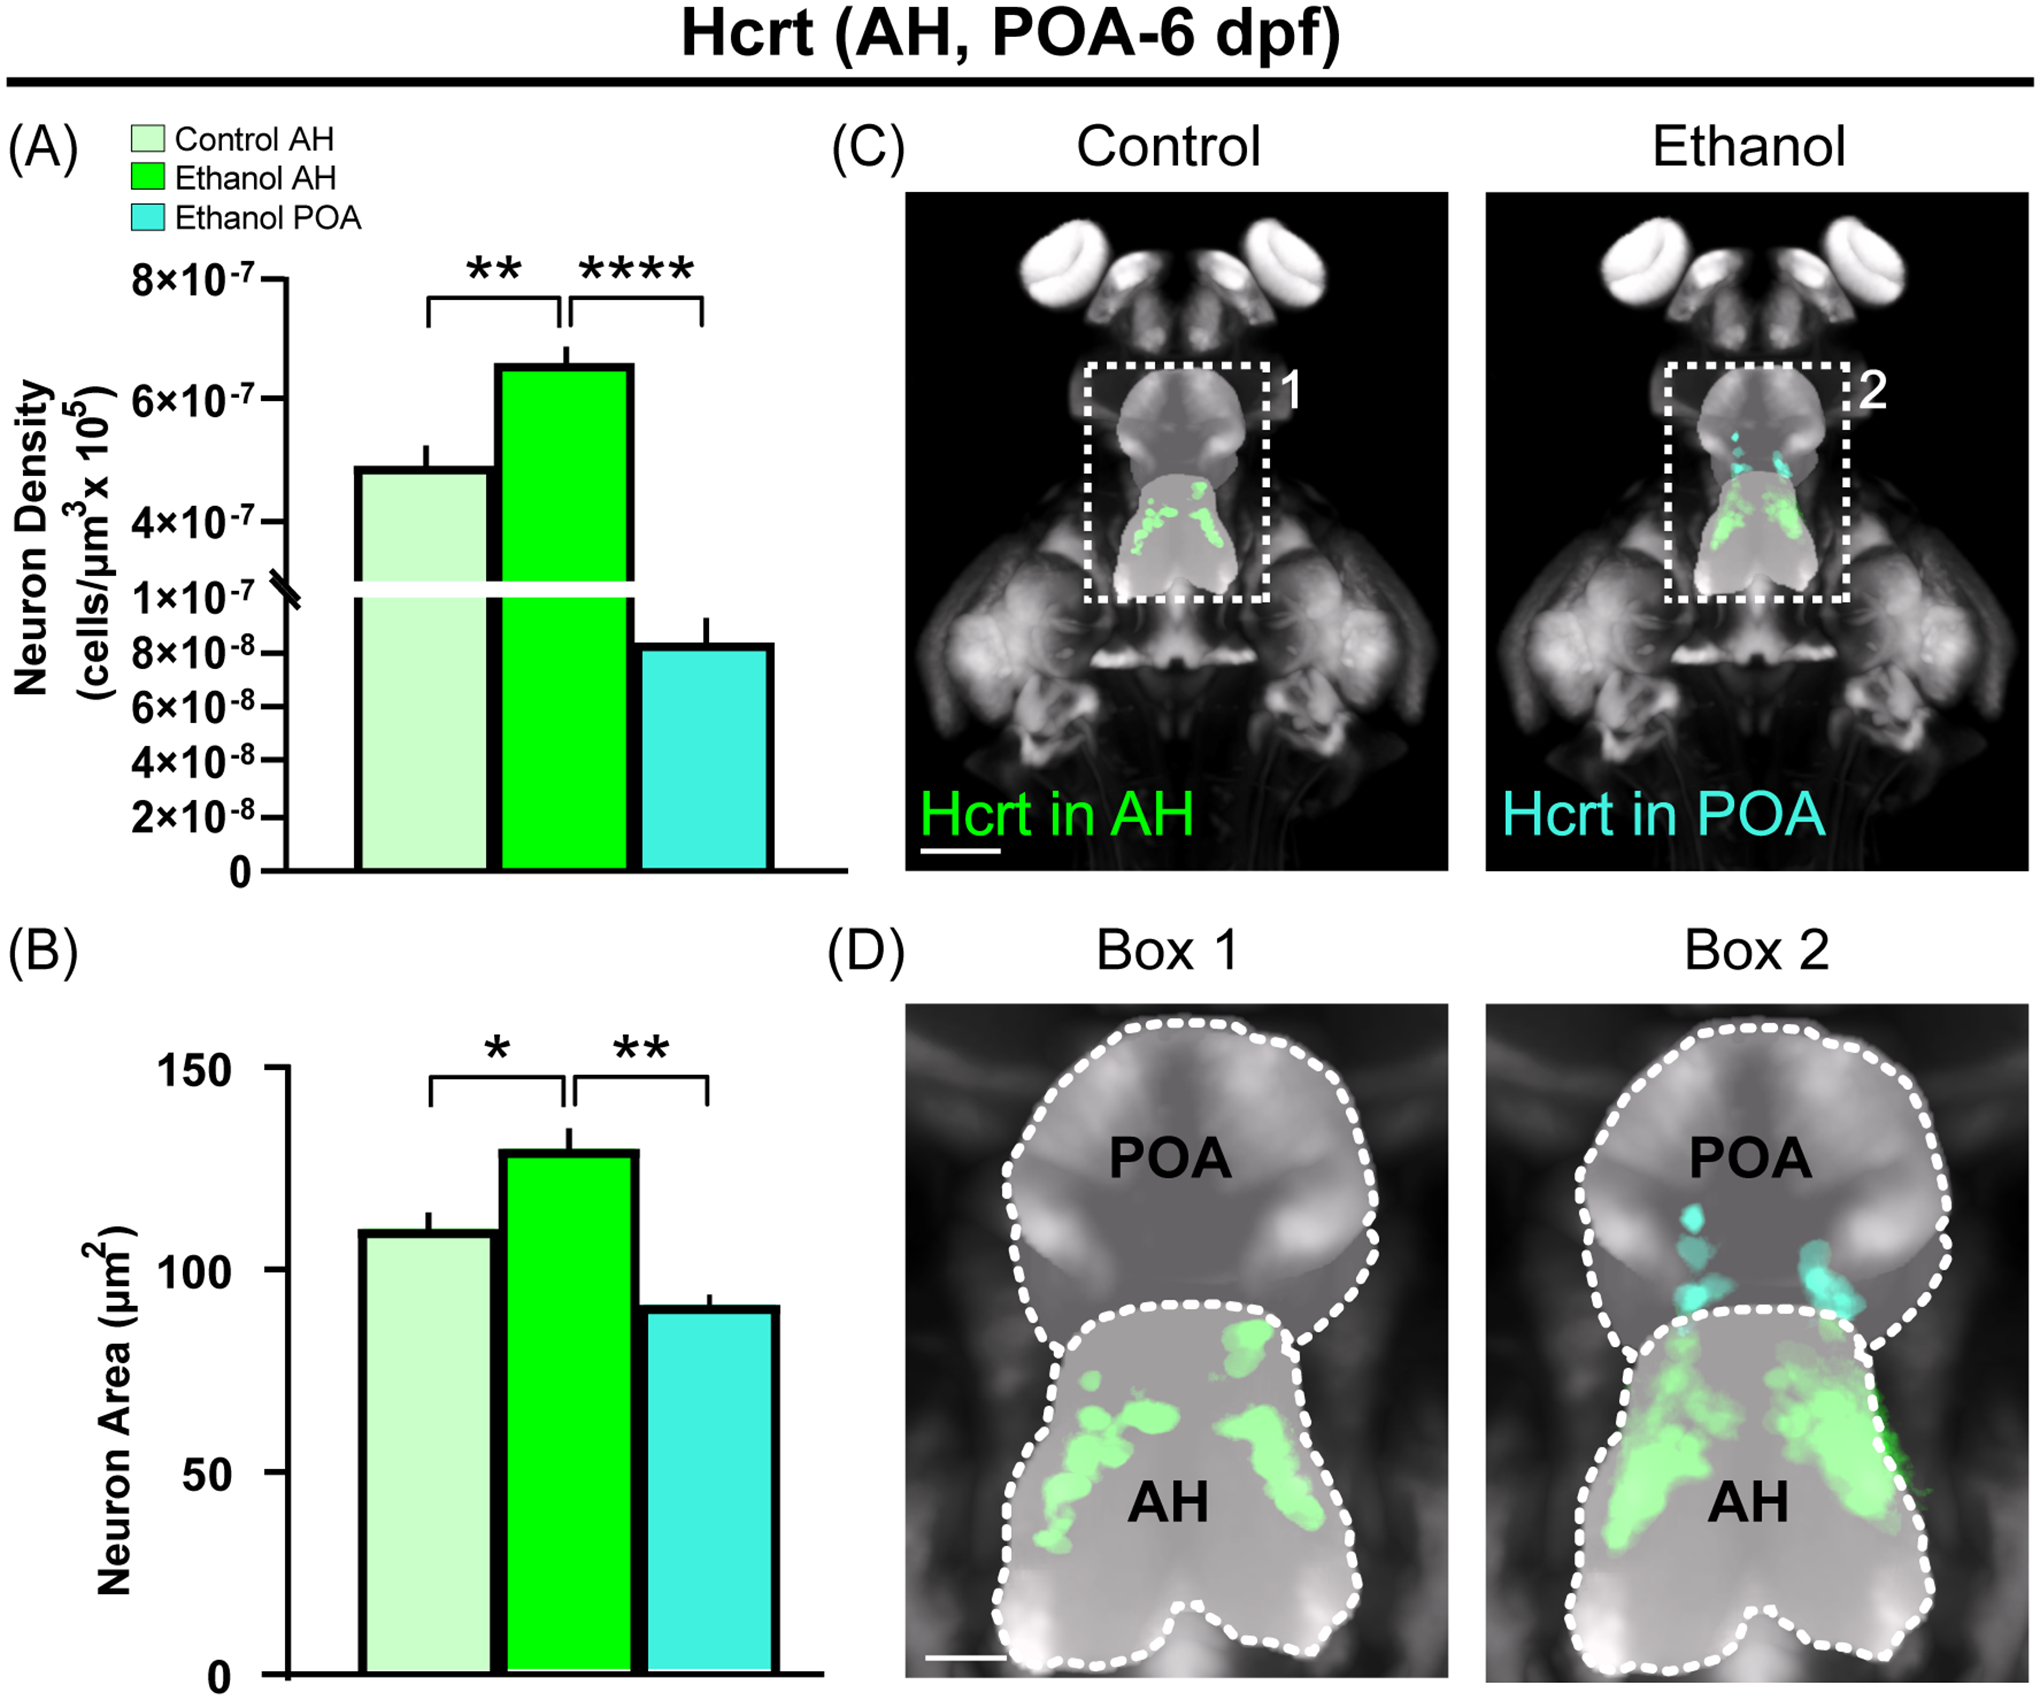
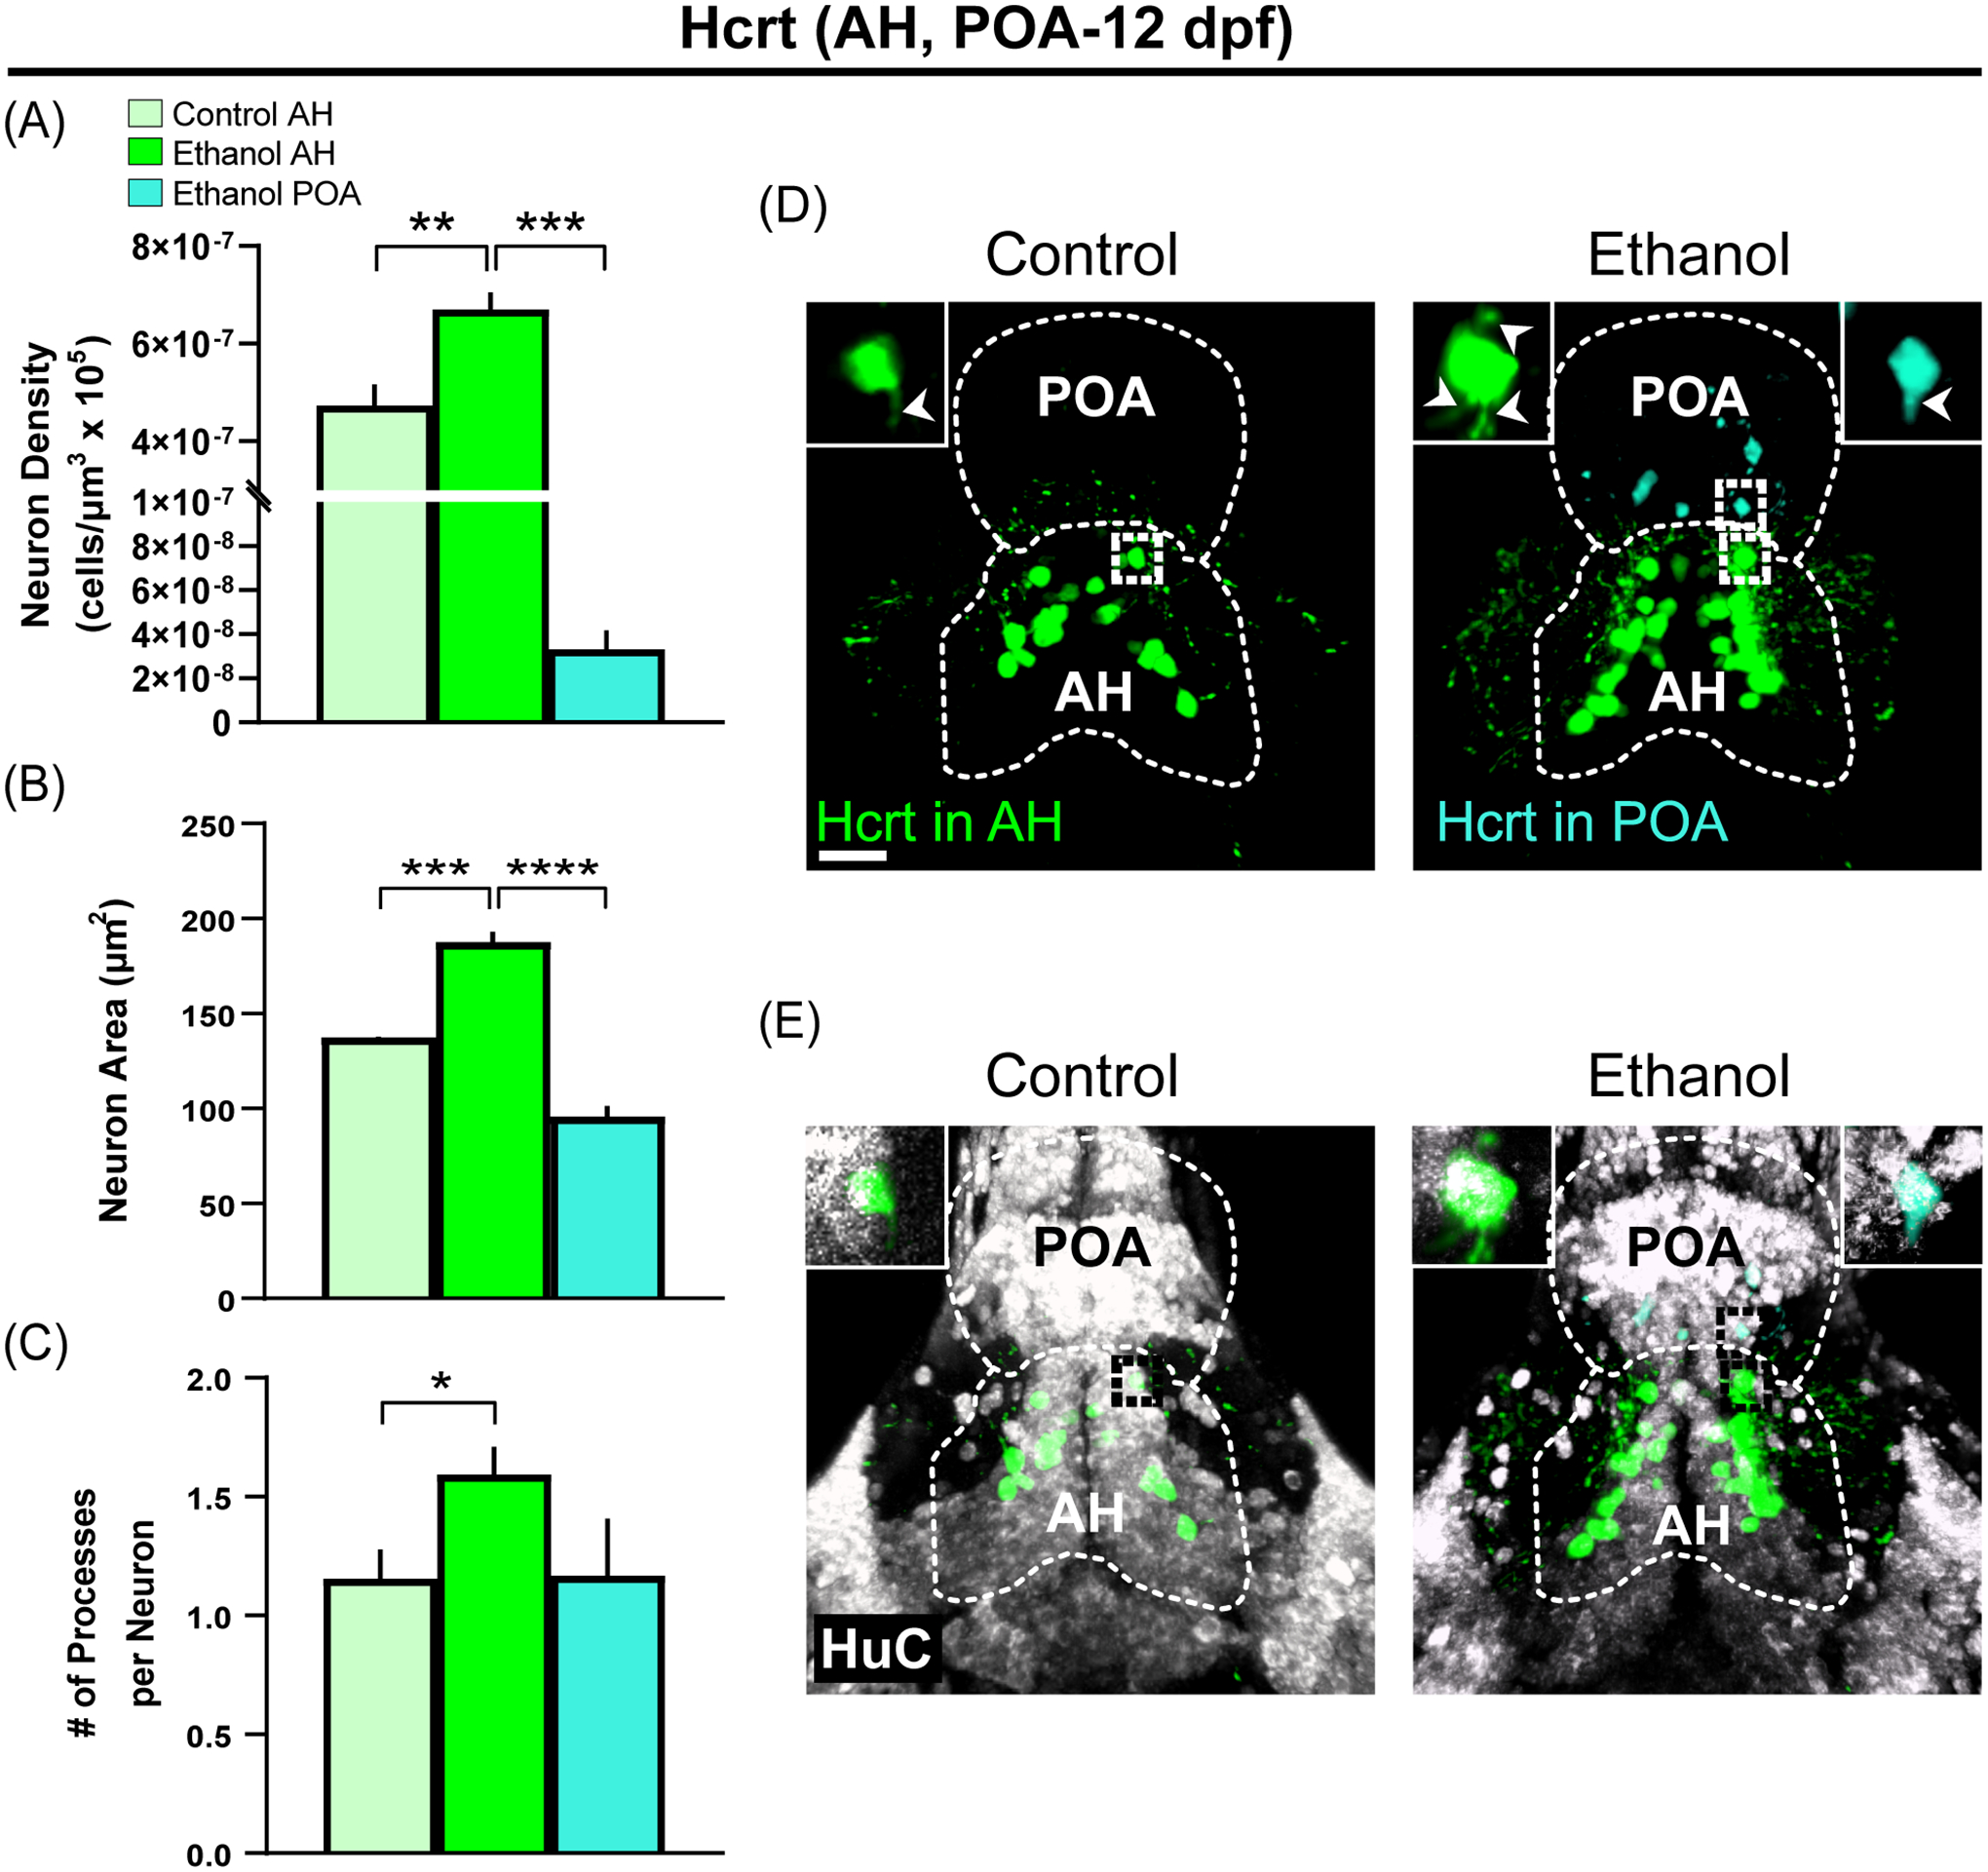
Embryonic exposure to ethanol increases the risk for alcohol use disorder in humans and stimulates alcohol-related behaviours in different animal models. Evidence in rats and zebrafish suggests that this phenomenon induced by ethanol at low-moderate concentrations involves a stimulatory effect on neurogenesis and density of hypothalamic neurons expressing the peptides, hypocretin/orexin (Hcrt) and melanin-concentrating hormone (MCH), known to promote alcohol consumption. Building on our report in zebrafish showing that ethanol induces ectopic expression of Hcrt neurons outside the hypothalamus, we investigated here whether embryonic ethanol exposure also induces ectopic peptide neurons in rats similar to zebrafish and affects their morphological characteristics and if these ectopic neurons are functional and have a role in the ethanol-induced disturbances in behaviour. We demonstrate in rats that ethanol at a low-moderate dose, in addition to increasing Hcrt and MCH neurons in the lateral hypothalamus where they are normally concentrated, induces ectopic expression of these peptide neurons further anterior in the nucleus accumbens core and ventromedial caudate putamen where they have not been previously observed and causes morphological changes relative to normally located hypothalamic neurons. Similar to rats, embryonic ethanol exposure at a low-moderate dose in zebrafish induces ectopic Hcrt neurons anterior to the hypothalamus and alters their morphology. Notably, laser ablation of these ectopic Hcrt neurons blocks the behavioural effects induced by ethanol exposure, including increased anxiety and locomotor activity. These findings suggest that the ectopic peptide neurons are functional and contribute to the ethanol-induced behavioural disturbances related to the overconsumption of alcohol.

Keywords: alcohol; ectopic neurons; embryonic ethanol.


Conflict of interest statement

Conflict of interest: The authors declare no competing interests.

Figures

Figure 1:
Figure 1:
Embryonic ethanol exposure (2 g/kg/day) from embryonic day 10 (E10) to E15 increases the density and alters the morphology of Hcrt and MCH neurons in lateral hypothalamus (LH) of female postnatal day 9 (P9) rats. (A, B) Representative photomicrographs (4x) of entire population of Hcrt (green) and MCH (red) neurons in LH, stained using iDISCO clearing, illustrate the increase in peptide neuron density in Ethanol compared to Control rats. Scale bar, 50 μm. (C, D) Photomicrographs (10x) of Hcrt (green) and MCH (red) neurons in LH, stained on brain sections using IF, similarly illustrate the increase in neuron density in Ethanol compared to Control rats, with enlargements (upper left corners) of individual Hcrt and MCH neurons from small white dotted boxes showing the ethanol-induced changes in neuron size and number of processes (indicated by white arrowheads). Scale bar, 30 μm. (E, F, G). Bar graphs (mean ± SEM, n = 3–4/group) indicate that Ethanol compared to Control increases the density and size of Hcrt neurons in LH and number of processes per Hcrt neuron stained using IF. (H, I, J) Bar graphs (mean ± SEM, n = 3–4/group) show that Ethanol compared to Control rats increases the density and size of MCH neurons in LH stained using IF, but not the number of processes per MCH neuron. *p < 0.05, **p < 0.01, ****p < 0.001, ****p < 0.0001. Abbreviations: Hcrt: Hypocretin/Orexin; IF: Immunofluorescence; LH: lateral hypothalamus; MCH: Melanin-concentrating hormone; P9: Postnatal day 9.
Figure 2:
Figure 2:
Embryonic ethanol exposure (2 g/kg/day) from embryonic day 10 (E10) to E15 induces ectopic Hcrt and MCH neurons with altered morphology in nucleus accumbens core (NAcC) of female postnatal day 9 (P9) rats. (A) Coronal brain section showing the NAcC at the anterior-posterior level of bregma A5.9 mm. (B) Representative photomicrographs (4x) illustrate ectopic Hcrt neurons (green) in NAcC of Ethanol rats, stained using iDISCO clearing and not detected in Control rats. Scale bar, 15 μm. (C) Photomicrographs (10x) illustrate ectopic Hcrt neurons (green) in NAcC of Ethanol rats, stained in brain sections using IF and not detected in Control rats. Scale bar, 30 μm. (D) Photomicrographs (40x) of brain sections stained using IF illustrate ectopic Hcrt (green) neurons in the NAcC of Ethanol rats, which when enlarged in white dotted Box 1 and further enlarged in Box 2 show co-labeling with NeuN (white) and illustrate their size and neuronal process (identified by white arrowhead). Scale bars, 80 μm (low magnification) and 10 μm (high magnification). (E, F, G) Bar graphs (mean ± SEM, n = 3–4/group) show ectopic Hcrt neurons in NAcC of Ethanol rats, which are less dense than LH neurons in the same Ethanol rats and also smaller in size and have fewer processes per neuron as shown using IF. (H) Representative photomicrographs (4x) illustrate ectopic MCH neurons (red) in NAcC of Ethanol rats, stained using iDISCO clearing and not detected in Control rats. Scale bar, 15 μm. (I) Photomicrographs (10x) illustrate ectopic MCH neurons (red) in NAcC of Ethanol rats, stained in brain sections using IF and not detected in Control rats. Scale bar, 30 μm. (J) Photomicrographs (40x) of brain sections stained using IF illustrate ectopic MCH (red) neurons in the NAcC of Ethanol rats, which when enlarged in white dotted Box 3 and further enlarged in Box 4 show co-labeling with NeuN (white) and illustrate their size and neuronal process (identified by white arrowhead). Scale bars, 80 μm (low magnification) and 10 μm (high magnification). (K, L, M) Bar graphs (mean ± SEM, n = 3–4/group) show ethanol-induced ectopic MCH neurons in NAcC of Ethanol rats, which as with Hcrt are less dense than LH neurons in Ethanol rats and are smaller in size and have fewer processes per neuron as shown using IF. *p < 0.05, **p < 0.01, ***p < 0.001 ****p < 0.0001. Abbreviations: Hcrt: Hypocretin/Orexin; IF: Immunofluorescence; MCH: Melanin-concentrating hormone; NAcC: Nucleus Accumbens Core; P9: Postnatal day 9.
Figure 3:
Figure 3:
Embryonic ethanol exposure (2 g/kg/day) from embryonic day 10 (E10) to E15 induces ectopic Hcrt and MCH neurons with altered morphology in the ventromedial caudate putamen (vmCP) of female postnatal day 9 (P9) rats. (A) Coronal brain section showing the vmCP at the anterior-posterior level of bregma A5.9 mm in rat brain atlas. (B) Representative photomicrographs (4x) illustrate ectopic Hcrt neurons (green) in vmCP of Ethanol rats, stained using iDISCO clearing and not detected in Control rats. Scale bar, 15 μm. (C) Photomicrographs (10x) illustrate ectopic Hcrt neurons (green) in vmCP of Ethanol rats, stained in brain sections using IF and not detected in Control rats. Scale bar, 30 μm. (D) Photomicrographs (40x) of brain sections stained using IF illustrate ectopic Hcrt (green) neurons in the vmCP of Ethanol rats, which when enlarged in white dotted Box 1 and further enlarged in Box 2 show co-labeling with NeuN (white), and illustrate their size and neuronal process (identified by white arrowhead). Scale bars, 80 μm (low magnification) and 10 μm (high magnification). (E, F, G) Bar graphs (mean ± SEM, n = 3–4/group) show ectopic Hcrt neurons in vmCP of Ethanol rats, which are less dense than Ethanol LH neurons and are smaller in size and have fewer processes per neuron shown using IF. (H) Representative photomicrographs (4x) illustrate ectopic MCH neurons (red) in vmCP of Ethanol rats, stained using iDISCO clearing and not detected in Control rats. Scale bar, 15 μm. (I) (C) Photomicrographs (10x) illustrate ectopic MCH neurons (red) in vmCP of Ethanol rats, stained in brain sections using IF and not detected in Control rats. Scale bar, 30 μm. (J) Photomicrographs (40x) of brain sections stained using IF illustrate ectopic MCH (red) neurons in the vmCP of Ethanol rats, which when enlarged in white dotted Box 3 and further enlarged in Box 4 show co-labeling with NeuN (white) and illustrate their size and neuronal process (identified by white arrowhead). Scale bars, 80 μm (low magnification) and 10 μm (high magnification). (K, L, M) Bar graphs (mean ± SEM, n = 3–4/group) show ectopic MCH neurons in vmCP of Ethanol rats, which similar to Hcrt neurons are less dense than Ethanol LH neurons and are smaller in size and have fewer processes per neuron shown using IF. *p < 0.05, **p < 0.01, ****p < 0.0001. Abbreviations: Hcrt: Hypocretin/Orexin; IF: Immunofluorescence; MCH: Melanin-concentrating hormone; V: Ventricle; P9: Postnatal day 9; vmCP: ventromedial caudate putamen.
Figure 4:
Figure 4:
The ectopic Hcrt and MCH neurons seen in newborn rats after ethanol exposure (2 g/kg/day) from embryonic day 10 (E10) to E15 are long lasting, similarly evident with altered morphology in nucleus accumbens core (NAcC) and ventromedial caudate putamen (vmCP) of early-adolescent female rats on postnatal day 30 (P30). (A, B, C) As shown using IF in newborn rats, bar graphs (mean ± SEM, n = 3–4/group) show that Ethanol compared to Control increases in early-adolescent rats the density, size and processes of Hcrt neurons in LH, and compared to these LH neurons, the ectopic Hcrt neurons in NAc and vmCP of Ethanol rats not detected in Control rats are reduced in density, are smaller in size, and have fewer processes. (D) Photomicrographs (40x) of Hcrt neurons (green) stained in brain sections using IF illustrate the increase in density in LH of Ethanol compared to Control rats and the ectopic neurons in the NAcC and vmCP detected in Ethanol but not Control rats. Individual Hcrt neurons in white dotted boxes are further enlarged (upper left corners) to illustrate the ethanol-induced changes in neuron size and number of processes (indicated by white arrowheads). Scale bar, 20 μm. (E, F, G) As shown using IF in newborn rats, bar graphs (mean ± SEM, n = 4–5/group) show that Ethanol compared to Control increases in early-adolescent rats the density, size and number of processes of MCH neurons in LH, and compared to these LH neurons, the ectopic MCH neurons in NAc and vmCP of Ethanol rats not detected in Control rats are reduced in density, are smaller in size, and have fewer processes. (H) (D) Photomicrographs (40x) of MCH neurons (red) stained in brain sections using IF illustrate the increase in density in LH of Ethanol compared to Control rats and the ectopic neurons in the NAcC and vmCP detected in Ethanol but not Control rats. Individual MCH neurons in white dotted boxes are further enlarged (upper left corners) to illustrate the ethanol-induced changes in neuron size and number of processes (indicated by white arrowheads). Scale bar, 20 μm. *p < 0.05, **p < 0.01, ***p < 0.001, ****p < 0.0001. Abbreviations: Hcrt: Hypocretin/Orexin; IF: Immunofluorescence; LH: lateral hypothalamus; MCH: Melanin-concentrating hormone; NAcC: Nucleus Accumbens Core; P30: Postnatal day 30; vmCP: ventromedial Caudate Putamen.
Figure 5:
Figure 5:
Embryonic ethanol exposure (0.5% v/v) early in development (22–24 hpf), while increasing the density of Hcrt neurons in the anterior hypothalamus (AH) where they are normally located, induces in zebrafish at 6 dpf ectopic Hcrt neurons with altered morphology in the preoptic area (POA) located anterior to the AH. (A, B) Bar graphs (mean ± SEM, n = 4/group) show that Ethanol compared to Control increases in zebrafish the density and size of Hcrt neurons in AH, and compared to these Ethanol AH neurons, the ectopic Hcrt neurons in the POA of Ethanol zebrafish are lower in density and smaller in size. (C) Photomicrographs (25x) show an overlay of n = 4 images for each condition of zebrafish brains at 6 dpf obtained using live-imaging, with pan-neuronal vglut2a:DsRed expression (grey) shown together with Hcrt neurons in AH (green) of Ethanol compared to Control zebrafish and also ectopic Hcrt neurons revealed in POA (cyan) of Ethanol zebrafish. (D) Enlargements of Box 1 and Box 2 show the outline of the AH and POA as derived from the Zebrafish Brain Browser. Scale bars: 100 μm (low magnification); 20 μm (high magnification). *p < 0.05, **p < 0.01, ****p < 0.0001. Abbreviations: AH: anterior hypothalamus; dpf: days post fertilization; Hcrt: Hypocretin/Orexin; POA: Preoptic area.
Figure 6:
Figure 6:
Ectopic Hcrt neurons, induced with altered morphology in Hcrt-EGFP zebrafish by embryonic ethanol exposure (0.5% v/v) in the preoptic area (POA) anterior to AH where they are normally concentrated, are similarly observed and found to persist into an older age at 12 dpf. (A, B, C) Bar graphs (mean ± SEM, n = 4–5/group) show that Ethanol compared to Control increases in 12 dpf zebrafish the density, size and number of processes per Hcrt neurons in AH, and compared to these Ethanol AH neurons, the ectopic Hcrt neurons in Ethanol POA are less dense and smaller in size and show a tendency toward reduced processes not statistically significant. (D) Photomicrographs (25x) of the 12 dpf zebrafish brain using IF show the ethanol-induced increase compared to control in density of Hcrt neurons (green) normally located in the AH and the ectopic Hcrt neurons (cyan) observed in the POA only after ethanol. Individual Hcrt neurons in white dotted boxes are further enlarged for the AH (upper left corners) and POA (upper right corner) to illustrate the ethanol-induced changes in neuron size and number of processes (indicated by white arrowheads). Scale bar, 20 μm. (E) Photomicrographs (25x) of the 12 dpf zebrafish brain using IF show staining of the neuronal marker HuC (white) and its double labeling with Hcrt neurons located in the AH (green) and POA (cyan). Individual neurons in black dotted boxes are further enlarged for the AH (upper left corners) and POA (upper right corner) to illustrate double labeling with HuC. Scale bar, 20 μm. *p < 0.05, **p < 0.01, ***p < 0.001, ****p < 0.0001. Abbreviations: AH: anterior hypothalamus; dpf: days post fertilization; Hcrt: Hypocretin/Orexin; POA: Preoptic area.
Figure 7:
Figure 7:
Ethanol exposure (0.5% v/v) during early embryonic development (22–24 hpf), while increasing Hcrt neurons in AH and POA, produces changes in anxiety-like and locomotion behaviors in zebrafish at 9 dpf that are altered by targeted laser ablation of the Hcrt neurons in POA and AH. (A,B) Bar graphs (mean ± SEM, n = 9–15/group) show that Ethanol increases anxiety-like behaviors, indicated by an increase in perecentage of time spent in the perimeter of the arena (thigmotaxis) and in the light half of the arena during the light-dark test (light preference), and these behavioral effects are blocked by laser ablation of the ectopic Hcrt neurons (3–4) in POA of the Ethanol POA Ablation group and also by ablation of normally located Hcrt neurons (3–4) in the AH of Ethanol AH Ablation group. (C) Bar graphs (mean ± SEM) show that Ethanol compared to Control also increases locomotor behavior, as indicated an increase in distance traveled, and this effect is blocked by laser ablation of ectopic POA Hcrt neurons (3–4) in Ethanol POA Ablation group but unaffected by laser ablation of the same number of Hcrt neurons in AH in Ethanol AH Ablation group. (D) Representative photomicrographs of non-ablated zebrafish brains at 8 dpf show Hcrt neurons in their normal location in AH (green) of the Ethanol and Control groups and ectopic Hcrt neurons in POA (cyan) of the Ethanol group. Scale bar, 10 μm. (E) Represetnative photomicrographs of zebrafish from Ethanol AH Ablation and Ethanol POA Ablation groups illustrate before and after ablation of Hcrt neurons in the AH (green) where they are normally located or ectopic Hcrt neurons in the POA (cyan). Before ablation, white arrowheads indicate normally located Hcrt neurons in AH of Ethanol AH Ablation group or ectopic Hcrt neurons in POA of Ethanol POA Ablation group, which were targeted for ablation, and then after ablation, arrows indicate the absence of these specific neurons. Scale bar: 10 μm. *p < 0.05, **p < 0.01, ***p < 0.001. Abbreviations: AH: anterior hypothalamus; dpf: days post fertilization; Hcrt: Hypocretin/Orexin; POA: Preoptic area.

Similar articles

Cited by

References

    1. Gupta KK, Gupta VK, Shirasaka T. An Update on Fetal Alcohol Syndrome-Pathogenesis, Risks, and Treatment. Alcohol Clin Exp Res. 2016;40(8):1594–1602. - PubMed
    1. Chang GQ, Karatayev O, Halkina V, Edelstien J, Ramirez E, Leibowitz SF. Hypothalamic CCL2/CCR2 Chemokine System: Role in Sexually Dimorphic Effects of Maternal Ethanol Exposure on Melanin-Concentrating Hormone and Behavior in Adolescent Offspring. J Neurosci. 2018;38(42):9072–9090. - PMC - PubMed
    1. Collier AD, Yasmin N, Khalizova N, Campbell S, Onoichenco A, Fam M, Albeg AS, Leibowitz SF. Sexually dimorphic and asymmetric effects of embryonic ethanol exposure on hypocretin/orexin neurons as related to behavioral changes in zebrafish. Sci Rep. 2021;11(1):16078. - PMC - PubMed
    1. Skofitsch G, Jacobowitz DM, Zamir N. Immunohistochemical localization of a melanin concentrating hormone-like peptide in the rat brain. Brain Res Bull. 1985;15(6):635–649. - PubMed
    1. De Lecea L, Kilduff T, Peyron C, Gao X-B, Foye P, Danielson P, Fukuhara C, Battenberg E, Gautvik V, Bartlett Fn. The hypocretins: hypothalamus-specific peptides with neuroexcitatory activity. Proceedings of the National Academy of Sciences. 1998;95(1):322–327. - PMC - PubMed

Publication types

LinkOut - more resources