. 2022 Dec 5;221(12):e202201024.
doi: 10.1083/jcb.202201024. Epub 2022 Oct 27.

Nucleoplasmic lamin C rapidly accumulates at sites of nuclear envelope rupture with BAF and cGAS

Affiliations

Nucleoplasmic lamin C rapidly accumulates at sites of nuclear envelope rupture with BAF and cGAS

Yohei Kono et al. J Cell Biol. .

Abstract

In mammalian cell nuclei, the nuclear lamina (NL) underlies the nuclear envelope (NE) to maintain nuclear structure. The nuclear lamins, the major structural components of the NL, are involved in the protection against NE rupture induced by mechanical stress. However, the specific role of the lamins in repair of NE ruptures has not been fully determined. Our analyses using immunofluorescence and live-cell imaging revealed that the nucleoplasmic pool of lamin C rapidly accumulated at sites of NE rupture induced by laser microirradiation in mouse embryonic fibroblasts. The accumulation of lamin C at the rupture sites required both the immunoglobulin-like fold domain that binds to barrier-to-autointegration factor (BAF) and a nuclear localization signal. The accumulation of nuclear BAF and cytoplasmic cyclic GMP-AMP synthase (cGAS) at the rupture sites was in part dependent on lamin A/C. These results suggest that nucleoplasmic lamin C, BAF, and cGAS concertedly accumulate at sites of NE rupture for rapid repair.


Figures

Figure 1.
Figure 1.
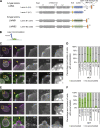
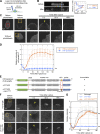
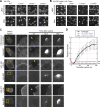
Difference of lamin isoforms in the structure and the accumulation kinetics at sites of NE rupture induced by laser microirradiation. (A) Protein architecture of lamin isoforms. The coiled-coil central rod domain (gray), the NLS (yellow), the β-strands comprising the Ig-fold (blue or green), and the CaaX motif box (red) are shown. (B) A 405-nm laser is used to induce NE rupture at a precise location on the NL. (C–F) A 2-μm diameter spot at the NE in MEFs was laser-microirradiated to induce NE rupture, fixed within 10 min (C and D) or 60–70 min after laser microirradiation (E and F), and then stained with a combination of anti-mouse and anti-rabbit antibodies, followed with Alexa Fluor 488-labeled anti-mouse or rabbit IgG and Cy5-labeled anti-rabbit or mouse IgG, and Hoechst 33342 for DNA. At least two independent experiments were performed. (C and E) Representative images of single confocal sections. Magnified views of the indicated areas by orange boxes are shown (the second to fifth columns). Color-merged images (the first and second columns) show anti-LC (321, green)/anti-LA (4A58, magenta), anti-LB2 (EPR9701(B), green)/anti-LB1 (B-10, magenta), and NPC (mAb414, green)/anti-LA (323, magenta). The ruptured sites are indicated with yellow arrowheads (the second columns). Bars: 5 μm (the first column) and 2 μm (the second to fifth columns). (D and F) Ratios of cells with (green) and without (gray) enrichments of the indicated antibodies at the rupture sites. The numbers of analyzed cells are indicated in the bar charts.
Figure S1.
Figure S1.
Difference of lamin isoforms in the accumulation kinetics at the rupture sites in MEFs, C2C12, BJ-5ta and MCF10A cells. (A–D) A 2-μm diameter spot at the NE in WT MEFs (A), C2C12 (B), BJ-5ta (C), and MCF10A (D) were laser-microirradiated to induce the rupture, fixed within 10 min (left panel of each) or 60–70 min later (right panel of each), and then stained with a combination of anti-mouse and anti-rabbit antibodies, followed with Alexa Fluor 488-labeled anti-rabbit IgG and Cy5-labeled anti-mouse IgG, and Hoechst 33342 for DNA. Magnified views of the indicated areas with orange boxes are shown (the second to fifth columns). The ruptured sites are indicated with yellow arrowheads (the second columns). Representative images of single confocal sections. Color-merged images (the first and second columns) in (A) MEFs show anti-LC (ab125679, green)/anti-LA (C-3, magenta), (B) C2C12 cells show anti-LC (321, green)/anti-LA (C-3, magenta), and anti-LB2 (EPR9701(B), green)/anti-LB1 (B-10, magenta), (C) BJ-5ta cells show anti-LC (321, green)/anti-LA (C-3, magenta), and anti-LB2 (EPR9701(B), green)/anti-LB1 (8D1, magenta) and (D) MCF10A cells show anti-LC (321, green)/anti-LA (C-3, magenta), and anti-LB2 (EPR9701(B), green)/anti-LB1 (8D1, magenta). Bars: 5 μm (the first column) and 2 μm (the second to fifth column). (E) Ratios of cells with (green) and without (gray) enrichments of the indicated antibodies at the rupture sites. The numbers of analyzed cells, fixed within 10 min (left panel) and 60 min (right panel) after laser microirradiation are indicated in the bar charts.
Figure 2.
Figure 2.
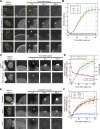
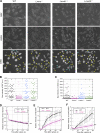
Rapid accumulation of mEmerald-LC at the rupture sites. During time-lapse imaging of exogenous LA, LC, LB1, and LB2 and endogenous LA and LC with 10 s intervals, a 2-μm diameter spot was laser-microirradiated to induce NE rupture (yellow arrowheads). (A) Dynamics of mEmerald-LA, LC, LB1, and LB2 in response to NE rupture in MEFs. (B) Fluorescence intensities of these mEmerald-lamins at the rupture sites were measured and normalized to the initial intensities. The graph represents means ± SEM (n = 20 cells from two independent experiments; **, P < 0.001 from others by a linear mixed model). (C) Dynamics of sfGFP-DARPin-LA6 and NLS-sfCherry in response to NE rupture in MEFs. (D) The sfGFP-DARPin-LA6 intensity at the rupture sites and NLS-sfCherry intensity in the nucleoplasm were measured and the relative intensities are plotted (means ± SEM; n = 20 cells from two independent experiments). (E) Dynamics of sfGFP-DARPin-LA6 in response to NE rupture in MEFs expressing shRNAs, scrambled control (shScr), shLA or shLC. (F) The sfGFP-DARPin-LA6 intensity at the rupture sites was measured and the relative intensities are plotted (means ± SEM; n = 10 cells; **, P < 0.001; ns, P > 0.05 from control by a linear mixed model). (A, C, and E) Bars: 5 μm (the first column) and 2 μm (the second to fifth columns).
Figure S2.
Figure S2.
Validation of LA- and LC-KD and the effect of LC-KD on the leakage of NLS-Halo from the nucleus to the cytoplasm. (A and B) Validation of LA- and LC-KD with immunofluorescence (A) and immunoblotting (B). (A) Representative immunofluorescence images of single confocal sections in WT MEFs expressing scrambled control, shLA or shLC with sfCherry stained with anti-LA (4A58, left panel) and anti-LC (ab125679, right panel), followed with Cy5-labeled anti-mouse and rabbit IgG, respectively, and Hoechst 33342 for DNA. Bar: 20 μm. (B) Whole cell lysates from WT MEFs expressing the indicated shRNAs were probed with anti-LA/C and anti-GAPDH (as loading control). Positions of the size standards are shown on the right. (C and D) During time-lapse imaging of WT MEFs expressing scrambled control (shScr) or shLC with 1 min intervals, a 2-μm diameter spot was laser-microirradiated to induce NE rupture (yellow arrowheads). (C) Dynamics of NLS-Halo in response to NE rupture in the indicated cells. The right four columns are magnified views of orange boxes. Bars: 5 μm (the first column) and 2 μm (the second to fifth column). (D) The cytoplasmic-to-nuclear intensity (C/N) ratio of NLS-Halo was measured and plotted to monitor NE rupture (means ± SEM; n = 10 cells; *, P < 0.05 from control by a Mann-Whitney U test). Source data are available for this figure: SourceData FS2.
Figure S3.
Figure S3.
Effects of difference between LA and LC on their accumulation kinetics at the rupture sites. (A–C) The requirement of LC-specific 6 amino acids for LC accumulation at the rupture sites. mEmerald-LC full-length and ∆567-572 (∆6aa) were expressed in Lmna-KO MEFs and the NE rupture assay was performed as in Fig 4, C and D. (A) Architecture of mEmerald-LC full-length and ∆567-572 (∆6aa). The summary of their dynamics is indicated on the right (+, accumulated at the rupture sites). (B) Dynamics of mEmerald-LC ∆567-572 (∆6aa) in response to NE rupture. (C) Relative fluorescence intensity of the mEmerald-LC ∆567-572 (∆6aa) (means ± SEM; n = 10 cells; ns, P > 0.05 from full-length by a linear mixed model). Full-length (gray) is a reproduction of “Without photobleach” in Fig. 4 D. (D) Representative immunofluorescence images of single confocal sections in WT MEFs expressing sfGFP-DARPin-LA6 and stained with anti-pSer22-LA/C, followed by Cy5-labeled anti-rabbit IgG, and Hoechst 33342 for DNA. The images in the bottom row are magnified views of orange boxes, and the rupture sites are indicated with yellow arrowheads. Bars: 5 μm (the top) and 2 μm (the bottom). (E–H) Dynamics of mEmerald-LC-S22D/S22A (E and F) or mEmerald-LA-S22D/S22A (G and H) in response to NE rupture. (F and H) Relative fluorescence intensity of the mEmerald-LC-S22D and S22A mutants (F) or mEmerald-LA-S22D and S22A mutants (H; means ± SEM; n = 20 cells from two independent experiments; **, P < 0.001; ns, P > 0.05 from WT by a linear mixed model). LC-WT (gray) is a reproduction of “Without photobleach” in Fig. 4 D. (B, E, and G) The right four columns are magnified views of orange boxes, and the rupture sites are indicated with yellow arrowheads. Bars: 5 μm (the first column) and 2 μm (the second to fifth column).
Figure 3.
Figure 3.
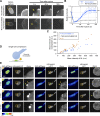
Accumulation kinetics of overexpressed mEmerald-LA and NE rupture induced by single-cell compression. (A–C) Relationships between the abundance of nucleoplasmic LA and the accumulation kinetics at the rupture sites. mEmerald-LA was expressed in WT MEFs and the NE rupture assay was performed as in Fig. 2, A and B. (A) Dynamics of mEmerald-LA with or without accumulation to the rupture sites. Bars: 5 μm (the first column) and 2 μm (the second to fifth columns). (B) Relative fluorescence intensity of the mEmerald-LA (means ± SEM; n = 20 cells from two independent experiments; **, P < 0.001 from another by a linear mixed model). Non-accumulated (gray) is a reproduction of “mEmerald-LA” in Fig. 2 B. (C) Fluorescence intensities of the mEmerald-LA and LC in the nucleoplasm and the NL was measured before laser microirradiation. (D) Round-tip end microcapillary is used to induce NE rupture by single-cell compression. (E) Dynamics of mEmerald-LC (left three columns), mEmerald-LA with high (middle three columns) and low (right three columns) nucleoplasmic levels, respectively. The right image of each column “Zoom” is magnified view of orange box. The brightened foci after single-cell compression are indicated with yellow arrowheads. The brightened foci of mEmerald-LAhigh at its high curvature pole of the NE before single-cell compression is indicated with cyan arrow. Bars: 10 μm (the left two of each column) and 2 μm (the right “Zoom” of each column).
Figure 4.
Figure 4.
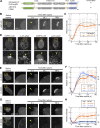
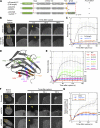
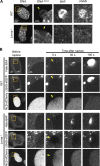
Rapid accumulation of nucleoplasmic LC at the rupture sites. (A) A 488-nm laser is used to nucleoplasmic photobleaching prior to 405-nm laser microirradiation. (B) Side views of before (top left) and after photobleaching (bottom left). Bar: 10 μm. Fluorescence intensity on the white dotted-line arrows along with z-axis was measured and plotted as line intensity profiles (right). (C) Dynamics of mEmerald-LC in response to NE rupture with or without photobleaching the nucleoplasmic pool. The right four columns are magnified views of orange boxes. Top row: A nucleoplasmic area in Lmna-KO MEFs expressing mEmerald-LC (red circle) was photobleached using 488-nm laser, and then a 2-μm spot at the NE (yellow arrowhead) was microirradiated using 405-nm laser during time-lapse imaging with 10 s intervals. Bottom row: The control cells without photobleaching. Bars: 5 μm (the left two columns) and 2 μm (the right four columns). (D) Relative fluorescence intensity of mEmerald-LC at the rupture sites. The mEmerald-LC intensities relative to the initial point are plotted (means ± SEM; n = 20 cells from two independent experiments; **, P < 0.001 from without photobleaching by a linear mixed model). (E–G) Requirements of an NLS for LC accumulation at the rupture sites. mEmerald-LC full-length, ∆417-422 (∆NLS) and ∆417-422 + NLSSUN2 (∆NLS + sunNLS) were expressed in Lmna-KO MEFs and the NE rupture assay was performed as in C and D, without pre-photobleaching. (E) Architecture of the mEmerald-LC NLS mutants. The summary of their dynamics is indicated on the right (+, accumulated at the rupture site; -, not accumulated). (F) Dynamics of mEmerald-LC NLS mutants in response to NE rupture. Bars: 5 μm (the first column) and 2 μm (the second to fifth columns). (G) Relative fluorescence intensities of the mEmerald-LC NLS mutants (means ± SEM; n = 10 cells; **, P < 0.001; ns, P > 0.05 from full-length by a linear mixed model). Full-length (gray) is a reproduction of “Without photobleach” in D.
Figure 5.
Figure 5.
Effect of LC Ig-fold laminopathy mutations and BAF-KD on accumulation kinetics of LC at the rupture sites. (A–G) The NE rupture assay was performed with mEmerald-LC mutants in Lmna-KO MEFs (A–E) and sfGFP-DARPin-LA6 in BAF-KD MEFs (F and G). (A) Architecture of mEmerald-LC full-length, ∆432-572 (∆Tail) and ∆433-548 + Ig-foldLB1 (∆IgF + b1IgF). The summary of their dynamics is indicated on the right (+, accumulated at the rupture site; -, not accumulated). (B) Dynamics of mEmerald-LC Ig-fold mutants in response to NE rupture in Lmna-KO MEFs. (C) Relative fluorescence intensities of the mEmerald-LC Ig-fold mutants (means ± SEM; n = 10 cells; **, P < 0.001 from full-length by a linear mixed model). (D) Positions of laminopathy mutations in the LA/C Ig-fold structure (PDB accession no. 1IFR). The amino acid residues whose mutations affect BAF binding affinity in vitro (Samson et al., 2018) are colored (red, no detectable binding; orange and magenta, very weak binding; and purple and blue, ∼fivefold weaker binding to the WT). The two residues whose mutations have no effect on BAF binding affinity in vitro are shown in dark green and light green. (E) Relative fluorescence intensities of the mEmerald-LC Ig-fold laminopathy mutants in Lmna-KO MEFs (means ± SEM; n = 10 cells; **, P < 0.001 from full-length by a linear mixed model). See Fig. S4 A for microscopic images. (F) Dynamics of sfGFP-DARPin-LA6 in response to NE rupture in WT MEFs expressing shRNAs, scrambled control (shScr), shBAF#1 or shBAF#2 (see Fig. S4, B and C for the validation of KD by immunofluorescence and immunoblotting). (G) Relative fluorescence intensities of sfGFP-DARPin-LA6 in the indicated cells (means ± SEM; n = 10 cells; **, P < 0.001 from the shScramble by a linear mixed model). (C and E) Full-length (gray) is a reproduction of “Without photobleach” in Fig. 4 D. (G) shScr (gray) is a reproduction of “shScramble” in Fig. 2 F. (B and F) The right four columns are magnified views of orange boxes. Bars: 5 μm (the first column) and 2 μm (the second column to others).
Figure S4.
Figure S4.
Dynamics of LC Ig-fold laminopathy mutants and validation of BAF-KD. (A) Dynamics of mEmerald-LC Ig-fold point mutants in Lmna-KO MEF. The right four columns are magnified views of orange boxes, and the rupture sites are indicated with yellow arrowheads. Bars: 5 μm (the first column) and 2 μm (the second to fifth column). (B and C) Validation of BAF-KD with immunofluorescence (B) and immunoblotting (C). (B) Representative immunofluorescence images of single confocal sections in WT MEFs expressing scrambled control (shScr), shBAF#1 or shBAF#2 with sfGFP-DARPin-LA6 and sfCherry stained with anti-BANF1/BAF (EPR7668), followed by Cy5-labeled anti-rabbit IgG, and Hoechst 33342 for DNA. Bar: 20 μm. (C) Whole cell lysates from MEFs expressing the indicated shRNAs were probed with anti- BANF1/BAF (EPR7668) and anti-GAPDH (as loading control). Positions of the size standards are shown on the right. (D) Representative images of single confocal sections of sfGFP-DARPin-LA6 in a NE protrusion in MEFs fixed within 10 min after microirradiation. DNA was stained with Hoechst 33342. The right image of each column is magnified view of orange box. The edges of protruded DNA regions are indicated with yellow dotted line (top right of each column). Bars: 5 μm (the left of each column) and 2 μm (the right of each column). Source data are available for this figure: SourceData FS4.
Figure 6.
Figure 6.
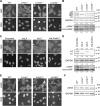
Effect of lamin depletion on localization of BAF and cGAS. (A and B) The localization and phosphorylation of BAF in WT, Lmna−/−, Lmnb1−/−, and Lmnb2−/− MEFs was analyzed by immunofluorescence (A) and immunoblotting, respectively (B). (A) Single confocal sections of the indicated cells stained with anti-BANF1/BAF (EPR7668), followed with Alexa Fluor 488-labeled anti-rabbit IgG, and Hoechst 33342 for DNA. (B) Whole cell lysates from the indicated cells were probed with anti-LA/C, anti-LB1/2, anti-GAPDH (as loading control), and anti-BANF1/BAF (EPR7668). (C and D) The localization and phosphorylation of BAF in WT MEFs expressing scrambled control, shLA, shLC or a combination of shLA and shLC was analyzed by immunofluorescence (C) and immunoblotting, respectively (D). (C) Single confocal sections of the indicated cells stained with anti-BANF1/BAF (EPR7668), followed with Cy5-labeled anti-rabbit IgG, and Hoechst 33342 for DNA. (D) Whole cell lysates from the indicated cells were probed with anti-LA/C, anti-GAPDH (as loading control), and anti-BANF1/BAF (EPR7668). (E and F) The localization and the expression levels of cGAS in WT, Lmna−/−, Lmnb1−/−, and Lmnb2−/− MEFs was analyzed by immunofluorescence (E) and immunoblotting, respectively (F). (E) Single confocal sections of the indicated cells stained with anti-cGAS, followed with Alexa 488-labeled anti-rabbit IgG, and Hoechst 33342 for DNA. (F) Whole cell lysates from the indicated cells were probed with anti-cGAS and anti-GAPDH (as loading control). (A–F) At least two independent experiments were performed. (A, C, and E) Bars: 20 μm. (B, D, and F) Positions of the size standards are shown on the right. The values on non-phospho-BAF, phospho-BAF and LA/C are densitometric quantitation normalized to GAPDH. Source data are available for this figure: SourceData F6.
Figure S5.
Figure S5.
Validation of BAF-specific antibodies in lamin-KO MEFs, the effect of BAF overexpression on accumulation kinetics of the LC mutants at the rupture sites. (A and B) Validation of anti-BANF1 (3F10-4G12) for immunofluorescence after different fixation methods. Representative immunofluorescence images of single confocal sections from WT, Lmna−/−, Lmnb1−/−, and Lmnb2−/− MEFs fixed with 4% PFA only (A) or 4% PFA containing 0.1% Triton X-100 (B) and stained with the anti-BANF1, followed with Cy5-labeled anti-mouse IgG, and Hoechst 33342 for DNA. Bars: 20 μm. (C and D) The effect of BAF overexpression on accumulation kinetics of the LC mutants at the rupture sites. Halo-BAF (lower panels) with mEmerald-LC full-length, ∆417-422 (∆NLS) and ∆432-572 (∆Tail; all, upper panels) were expressed in Lmna-KO MEFs. (C) Dynamics of mEmerald-LC full-length, ∆417-422 (∆NLS), ∆432-572 (∆Tail), and Halo-BAF. The right four columns are magnified views of orange boxes, and the rupture sites are indicated with yellow arrowheads. Bars: 5 μm (the first column) and 2 μm (the second column to others). (D) Relative fluorescence intensities of the mEmerald-LC mutants (means ± SEM; n = 10 cells; **, P < 0.001 from full-length by a linear mixed model).
Figure 7.
Figure 7.
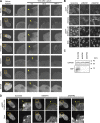
Dynamics of LC, BAF, and cGAS in response to laser microirradiation-induced NE rupture. (A and B) Dynamics of sfGFP-DARPin-LA6, Halo-BAF, and cGAS-sfCherry in response to NE rupture. cGAS-sfCherry was localized to the cytoplasm in some cells (A) or to the nucleus in the others (B). The right four columns are magnified views of orange boxes, and the rupture sites are indicated with yellow arrowheads. (C) Normalized fluorescence intensities of sfGFP-DARPin-LA6, cGAS-sfCherry and Halo-BAF in MEFs are shown up to the signal peaks, and cGAS-sfCherry is localized to the cytoplasm (top) or the nucleus (bottom; means ± SEM; n = 10 cells; **, P < 0.001 from others by a linear mixed model). (D) Representative images of single confocal sections of MEFs fixed within 10 min after laser microirradiation and stained with anti-cGAS, Alexa Fluor 488-labeled anti-rabbit IgG, and Hoechst 33342 for DNA. Colored arrowheads indicate sites of NE rupture induced by laser microirradiation in cells with cytoplasmic cGAS (orange) or nuclear cGAS (blue). Bar: 10 μm. (E) Fluorescence intensities of the cGAS accumulated at the rupture sites was measured. (n = 15 and 8 for cytoplasmic and nuclear cGAS, respectively from two independent experiments; horizontal dotted lines show the mean values, *, P < 0.05 from cells with the accumulation of cytoplasmic cGAS by a Mann-Whitney U test). (F) Maximum intensity Z-projection of high-resolution confocal images of LC, BAF, and cGAS in a NE protrusion from the nuclear main body. The sfGFP-DARPin-LA6 expressing cells are fixed within 10 min after laser microirradiation, stained with anti-BANF1 (3F10-4G12) and anti-cGAS, followed with Cy5-labeled anti-mouse IgG and Alexa Fluor 568-labeled anti-rabbit IgG, respectively, and Hoechst 33342 for DNA. Magnified views of an orange boxed area (top left) are shown as merged and individual images. Merged images (top left and top middle) show LC (blue), BAF (red), and cGAS (green). (G) Line intensity profiles over the NE protrusion. Fluorescence intensity on the white dotted-line arrow was measured and plotted. (A, B, and F) Bars: 5 μm (A and B, the first column; and F, the top left); and 2 μm for the magnified views.
Figure S6.
Figure S6.
FRAP of cytoplasmic and nuclear cGAS, and the accumulation kinetics of LC, BAF and cGAS at the rupture sites. (A–D) FRAP. A 2-µm diameter spot in a nucleus or cytoplasm was bleached, and the fluorescence recovery was measured for 30 s (A and B) and 360 s (C and D; means ± SEM; n = 20 and 17 cells for B and D, respectively, from two independent experiments). (A and C) The right four columns are magnified views of orange boxes, and the photobleaching sites are indicated with yellow dotted circles. Bars: 5 μm (the first column) and 2 μm (the second to fifth column). (E) Relative intensities of sfGFP-DARPin-LA6 (top), Halo-BAF (middle), and cGAS-sfCherry (bottom) at the rupture sites in cells with cytoplasmic or nuclear cGAS in Fig. 7, A–C (means ± SEM; n = 10 cells; *, P < 0.01; **, P < 0.001 by a linear mixed model).
Figure 8.
Figure 8.
Effect of lamin depletion on BAF and cGAS accumulation at the rupture sites. (A) Single confocal sections of WT, Lmna−/−, Lmnb1−/−, and Lmnb2−/− MEFs fixed within 10 min after laser microirradiation and stained with anti-BANF1 (3F10-4G12) and anti-cGAS, followed with Alexa Fluor 488-labeled anti-rabbit IgG, Cy5-labeled anti-mouse IgG, and Hoechst 33342 for DNA. Yellow arrowheads indicate laser microirradiation-induced NE rupture sites. Blue arrowheads indicate spontaneously produced NE protrusions. Bar: 20 μm. (B and C) The max intensities of BAF (B) and cGAS (C) signals at the rupture sites. The plotted points are from two independent experiments (n = 36, 35, 32, and 34 for WT, Lmna−/−, Lmnb1−/−, and Lmnb2−/−, respectively; horizontal dotted lines show the mean values, *, P < 0.05 from others by a Steel-Dwass multiple comparison). (D–F) Relative fluorescence intensities of the NLS-sfCherry in the nucleus, Halo-Baf and cGAS-sfGFP at the rupture site in WT and Lmna−/− MEFs (means ± SEM; n = 20 cells from two independent experiments; **, P < 0.001; ns, P > 0.05 from WT by a linear mixed model). See Fig. S7 B for microscopic images.
Figure S7.
Figure S7.
Dynamics of BAF and cGAS in WT and Lmna-KO MEFs. (A) Representative immunofluorescence images of single confocal sections from the indicated MEFs fixed within 10 min after laser microirradiation and stained with anti-BANF1 (3F10-4G12) and anti-cGAS, followed with Alexa Fluor 488-labeled anti-rabbit IgG, Cy5-labeled anti-mouse IgG, and Hoechst 33342 for DNA. The right three columns are magnified views of orange boxes. (B) Dynamics of Halo-BAF and cGAS-sfCherry in the indicated MEFs. The right four columns are magnified views of orange boxes. (A and B) The rupture sites are indicated with yellow arrowheads. Bars: 5 μm (the first column) and 2 μm (the second to others).
Figure 9.
Figure 9.
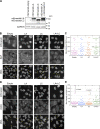
The effect of re-expression of A-type lamins. (A) Validation of A-type lamins re-expression in Lmna-KO MEFs. Whole cell lysates from MEFs expressing the indicated constructs were probed with anti-LA/C and anti-GAPDH (as loading control). PB533-mEmerald-C1-Neo were used as control (empty). Positions of the size standards are shown on the right. The degradation fragment is indicated with #. The contribution of the fragment to rescue effects is likely to be marginal because the expression level is significantly low compared to mEmerald-LA (top band). (B–E) Representative images of single confocal sections of the indicated MEFs fixed within 10 min after laser microirradiation and stained with anti-BANF1 (3F10-4G12; B) or anti-cGAS (D), Cy5-labeled anti-mouse IgG or rabbit IgG, and Hoechst 33342 for DNA. The max intensities of BAF (C) and cGAS (E) signals at the rupture sites in the indicated MEFs. The plotted points are from two independent experiments (n = 30, 29, 32, and 32 for Empty, LA, LC, and LA + LC, respectively; significance was determined by a Kruskal–Wallis test, P < 0.05; far outliers were excluded if P < 0.001 by the Smirnov-Grubbs test; horizontal dotted lines show the mean values, *, P < 0.05 from empty control, †, P < 0.05 from LC by a Steel–Dwass multiple comparison after far outliers were excluded). (B and D) Bars: 20 μm. Yellow arrowheads indicate laser microirradiation-induced NE rupture sites. Blue arrowheads indicate spontaneously produced NE protrusions. Source data are available for this figure: SourceData F9.
Figure 10.
Figure 10.
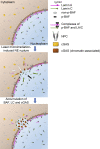
A summary diagram of NE rupture and the repair. NE rupture and the repair are depicted in three sequential steps (before [0 min, top], ∼1 min [middle] and up to ∼10 min [bottom] after laser microirradiation). Middle: Colored arrows indicate accumulation of non-p-BAF (white), p-BAF (black), LC (green), and cGAS (yellow).

Similar articles

Cited by

References

    1. Akinci, B., Onay H., Demir T., Savas-Erdeve S., Gen R., Simsir I.Y., Keskin F.E., Erturk M.S., Uzum A.K., Yaylali G.F., et al. 2017. Clinical presentations, metabolic abnormalities and end-organ complications in patients with familial partial lipodystrophy. Metabolism. 72:109–119. 10.1016/j.metabol.2017.04.010 - DOI - PubMed
    1. Béréziat, V., Cervera P., Le Dour C., Verpont M.C., Dumont S., Vantyghem M.C., Capeau J., Vigouroux C., and Lipodystrophy Study G.. 2011. LMNA mutations induce a non-inflammatory fibrosis and a brown fat-like dystrophy of enlarged cervical adipose tissue. Am. J. Pathol. 179:2443–2453. 10.1016/j.ajpath.2011.07.049 - DOI - PMC - PubMed
    1. Biamonti, G., Giacca M., Perini G., Contreas G., Zentilin L., Weighardt F., Guerra M., Della Valle G., Saccone S., Riva S., and Falaschi A.. 1992. The gene for a novel human lamin maps at a highly transcribed locus of chromosome 19 which replicates at the onset of S-phase. Mol. Cell. Biol. 12:3499–3506. 10.1128/mcb.12.8.3499-3506.1992 - DOI - PMC - PubMed
    1. Birendra, K., May D.G., Benson B.V., Kim D.I., Shivega W.G., Ali M.H., Faustino R.S., Campos A.R., and Roux K.J.. 2017. VRK2A is an A-type lamin-dependent nuclear envelope kinase that phosphorylates BAF. Mol. Biol. Cell. 28:2241–2250. 10.1091/mbc.E17-03-0138 - DOI - PMC - PubMed
    1. Bonne, G., Di Barletta M.R., Varnous S., Bécane H.M., Hammouda E.H., Merlini L., Muntoni F., Greenberg C.R., Gary F., Urtizberea J.A., et al. 1999. Mutations in the gene encoding lamin A/C cause autosomal dominant Emery-Dreifuss muscular dystrophy. Nat. Genet. 21:285–288. 10.1038/6799 - DOI - PubMed

Publication types