

Baseline oxygen consumption decreases with cortical depth
- PMID: 36301995
- PMCID: PMC9642908
- DOI: 10.1371/journal.pbio.3001440
Baseline oxygen consumption decreases with cortical depth
Abstract
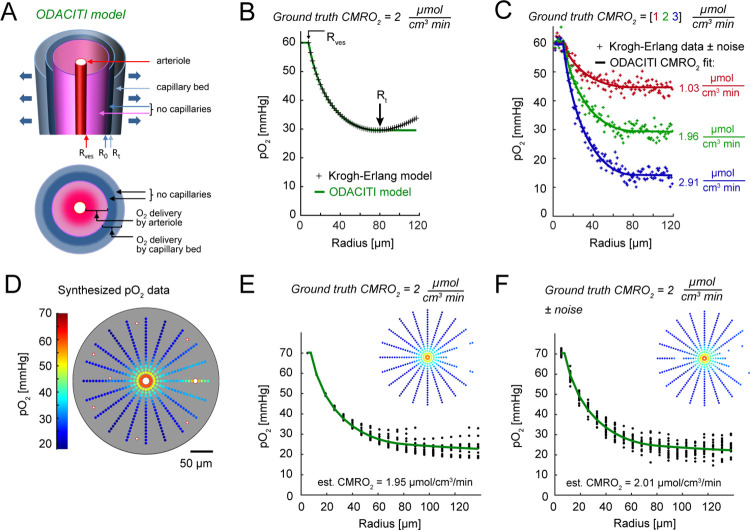
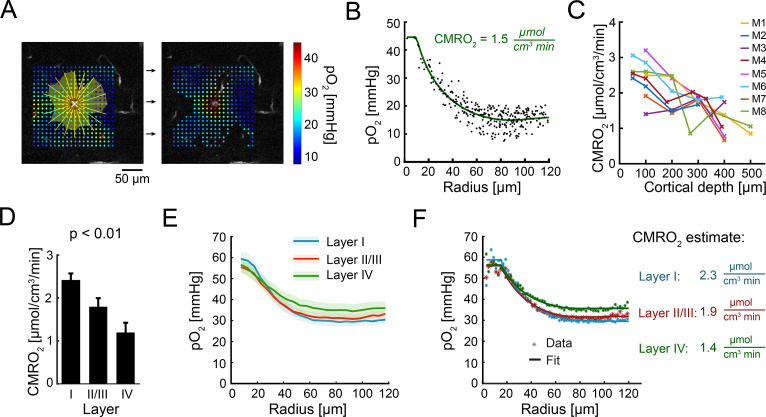
The cerebral cortex is organized in cortical layers that differ in their cellular density, composition, and wiring. Cortical laminar architecture is also readily revealed by staining for cytochrome oxidase-the last enzyme in the respiratory electron transport chain located in the inner mitochondrial membrane. It has been hypothesized that a high-density band of cytochrome oxidase in cortical layer IV reflects higher oxygen consumption under baseline (unstimulated) conditions. Here, we tested the above hypothesis using direct measurements of the partial pressure of O2 (pO2) in cortical tissue by means of 2-photon phosphorescence lifetime microscopy (2PLM). We revisited our previously developed method for extraction of the cerebral metabolic rate of O2 (CMRO2) based on 2-photon pO2 measurements around diving arterioles and applied this method to estimate baseline CMRO2 in awake mice across cortical layers. To our surprise, our results revealed a decrease in baseline CMRO2 from layer I to layer IV. This decrease of CMRO2 with cortical depth was paralleled by an increase in tissue oxygenation. Higher baseline oxygenation and cytochrome density in layer IV may serve as an O2 reserve during surges of neuronal activity or certain metabolically active brain states rather than reflecting baseline energy needs. Our study provides to our knowledge the first quantification of microscopically resolved CMRO2 across cortical layers as a step towards better understanding of brain energy metabolism.
Copyright: © 2022 Mächler et al. This is an open access article distributed under the terms of the Creative Commons Attribution License, which permits unrestricted use, distribution, and reproduction in any medium, provided the original author and source are credited.
Conflict of interest statement
The authors have declared that no competing interests exist.
Figures

Similar articles
-
Optical measurement of microvascular oxygenation and blood flow responses in awake mouse cortex during functional activation.J Cereb Blood Flow Metab. 2022 Mar;42(3):510-525. doi: 10.1177/0271678X20928011. Epub 2020 Jun 9. J Cereb Blood Flow Metab. 2022. PMID: 32515672 Free PMC article.
-
More homogeneous capillary flow and oxygenation in deeper cortical layers correlate with increased oxygen extraction.Elife. 2019 Jul 15;8:e42299. doi: 10.7554/eLife.42299. Elife. 2019. PMID: 31305237 Free PMC article.
-
The Effect of Hypercapnia on Cortical Metabolic Rate and Mitochondrial Redox Status.Adv Exp Med Biol. 2023;1438:15-20. doi: 10.1007/978-3-031-42003-0_3. Adv Exp Med Biol. 2023. PMID: 37845433
-
Integrated PET/MRI scanner with oxygen-15 labeled gases for quantification of cerebral blood flow, cerebral blood volume, cerebral oxygen extraction fraction and cerebral metabolic rate of oxygen.Ann Nucl Med. 2021 Apr;35(4):421-428. doi: 10.1007/s12149-021-01578-8. Epub 2021 Jan 27. Ann Nucl Med. 2021. PMID: 33502738
-
PET quantification of cerebral oxygen metabolism in small animals.ScientificWorldJournal. 2014;2014:159103. doi: 10.1155/2014/159103. Epub 2014 Aug 17. ScientificWorldJournal. 2014. PMID: 25202714 Free PMC article. Review.
Cited by
-
Shallow-angle intracranial cannula for repeated infusion and in vivo imaging with multiphoton microscopy.bioRxiv [Preprint]. 2025 Jan 23:2025.01.22.634409. doi: 10.1101/2025.01.22.634409. bioRxiv. 2025. Update in: Neurophotonics. 2025 Apr;12(2):025001. doi: 10.1117/1.NPh.12.2.025001. PMID: 39896645 Free PMC article. Updated. Preprint.
-
Shallow-angle intracranial cannula for repeated infusion and in vivo imaging with multiphoton microscopy.Neurophotonics. 2025 Apr;12(2):025001. doi: 10.1117/1.NPh.12.2.025001. Epub 2025 Mar 25. Neurophotonics. 2025. PMID: 40145102 Free PMC article.
-
Neuroinflammation increases oxygen extraction in a mouse model of Alzheimer's disease.Alzheimers Res Ther. 2024 Apr 10;16(1):78. doi: 10.1186/s13195-024-01444-5. Alzheimers Res Ther. 2024. PMID: 38600598 Free PMC article.
-
Brief disruptions in capillary flow result in rapid onset of hypoxia.Neurophotonics. 2025 Jun;12(Suppl 2):S22803. doi: 10.1117/1.NPh.12.S2.S22803. Epub 2025 Aug 12. Neurophotonics. 2025. PMID: 40800118 Free PMC article.
-
Neurovascular coupling is optimized to compensate for the increase in proton production from nonoxidative glycolysis and glycogenolysis during brain activation and maintain homeostasis of pH, pCO2, and pO2.J Neurochem. 2024 May;168(5):632-662. doi: 10.1111/jnc.15839. Epub 2023 Jun 21. J Neurochem. 2024. PMID: 37150946 Free PMC article.
References
Publication types
MeSH terms
Substances
Grants and funding
- R00 MH120053/MH/NIMH NIH HHS/United States
- U19 NS123717/NS/NINDS NIH HHS/United States
- R35 NS097265/NS/NINDS NIH HHS/United States
- R01 NS091230/NS/NINDS NIH HHS/United States
- R01 DA050159/DA/NIDA NIH HHS/United States
- R01 NS108472/NS/NINDS NIH HHS/United States
- R01 NS115401/NS/NINDS NIH HHS/United States
- R01 MH111359/MH/NIMH NIH HHS/United States
- U24 EB028941/EB/NIBIB NIH HHS/United States
- RF1 NS121095/NS/NINDS NIH HHS/United States
- K99 MH120053/MH/NIMH NIH HHS/United States
- U01 HL133362/HL/NHLBI NIH HHS/United States
