. 2022 Oct 28;378(6618):eabm3233.
doi: 10.1126/science.abm3233. Epub 2022 Oct 28.

Commensal microbiota from patients with inflammatory bowel disease produce genotoxic metabolites

Affiliations

Commensal microbiota from patients with inflammatory bowel disease produce genotoxic metabolites

Yiyun Cao et al. Science. .

Abstract

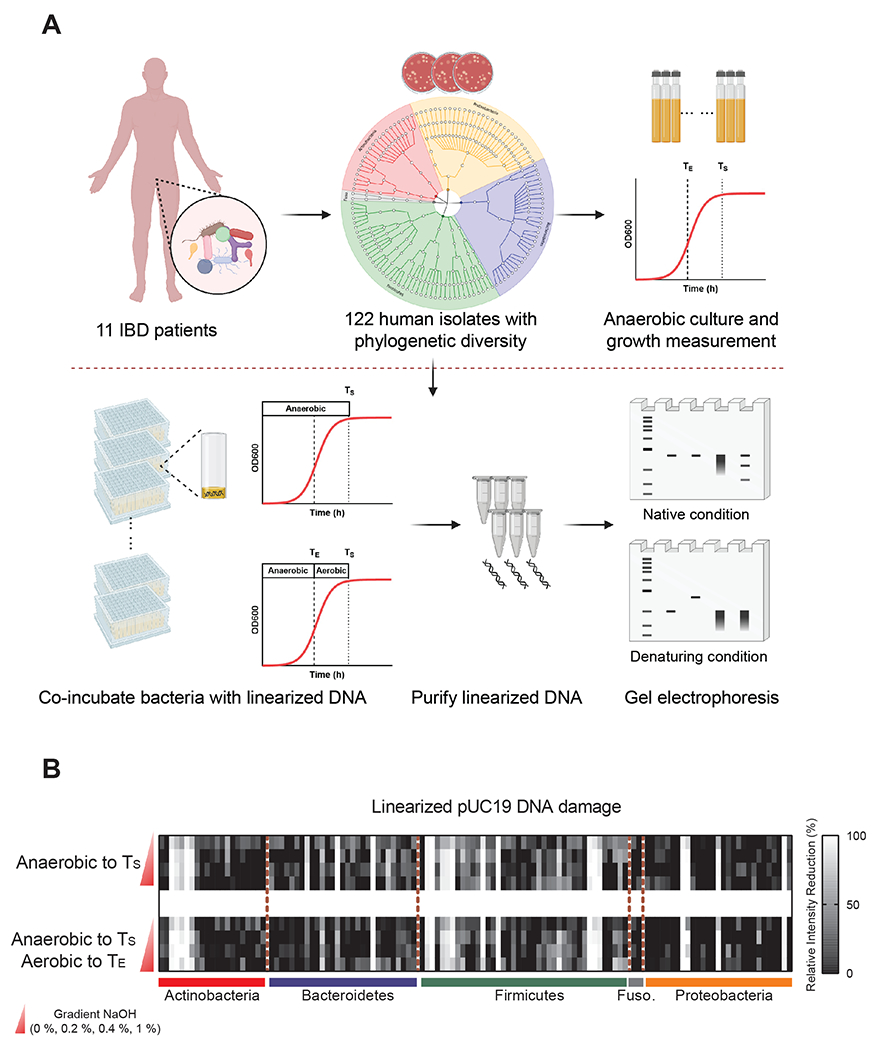
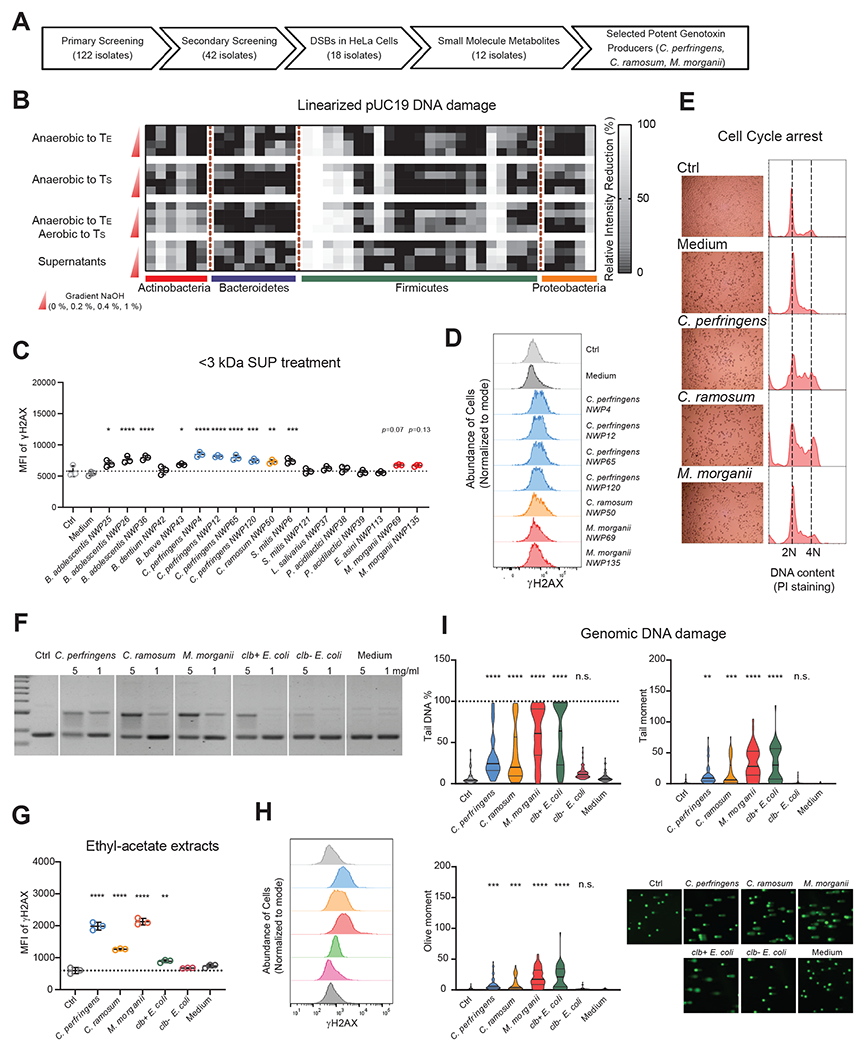
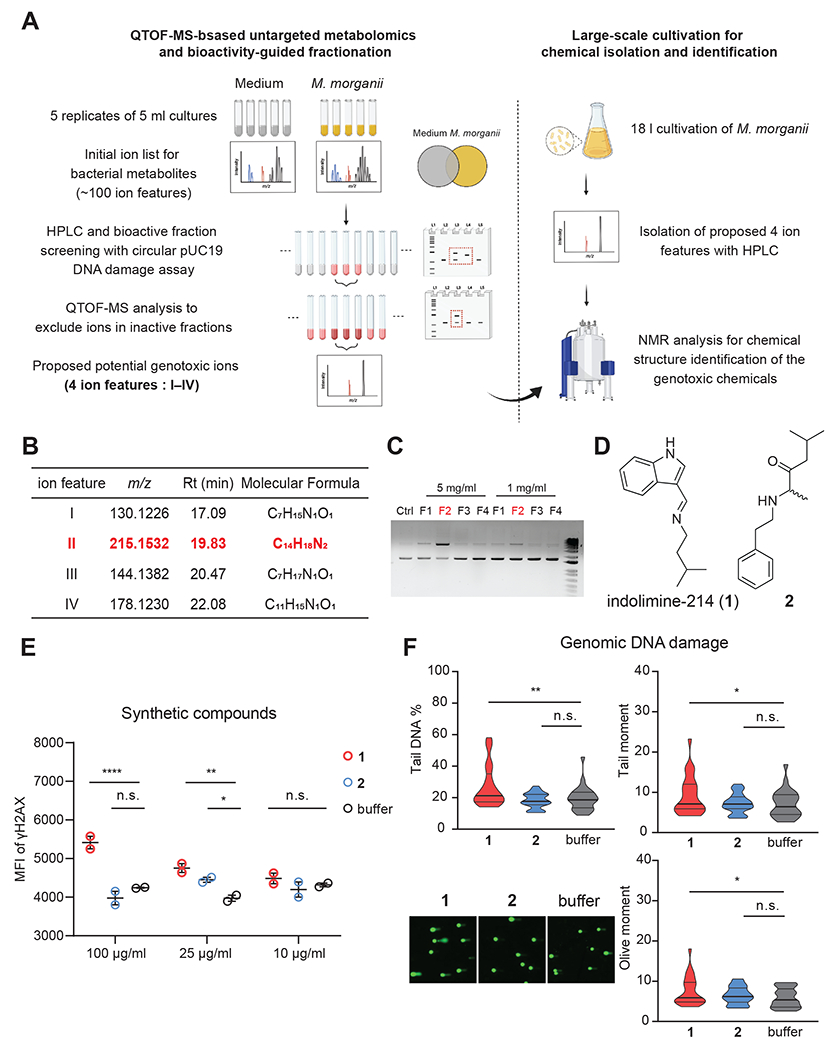
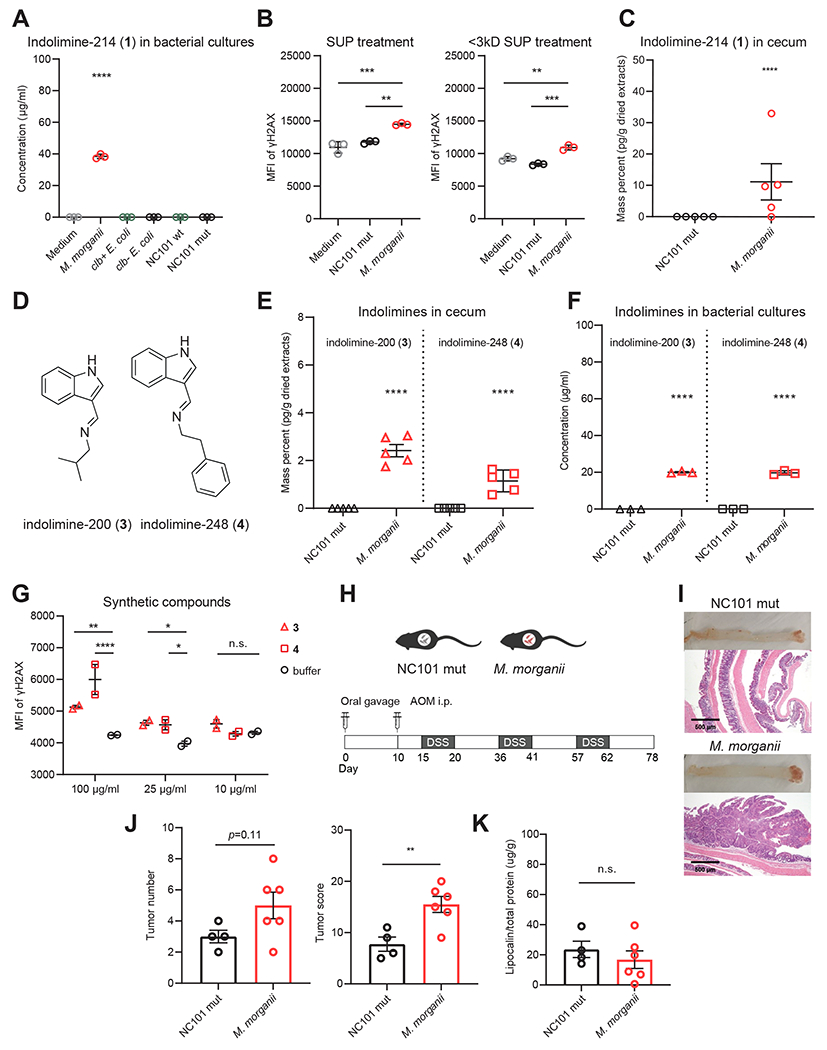
Microbiota-derived metabolites that elicit DNA damage can contribute to colorectal cancer (CRC). However, the full spectrum of genotoxic chemicals produced by indigenous gut microbes remains to be defined. We established a pipeline to systematically evaluate the genotoxicity of an extensive collection of gut commensals from inflammatory bowel disease patients. We identified isolates from divergent phylogenies whose metabolites caused DNA damage and discovered a distinctive family of genotoxins-termed the indolimines-produced by the CRC-associated species Morganella morganii. A non-indolimine-producing M. morganii mutant lacked genotoxicity and failed to exacerbate colon tumorigenesis in mice. These studies reveal the existence of a previously unexplored universe of genotoxic small molecules from the microbiome that may affect host biology in homeostasis and disease.


Figures

Figure 1.
Figure 1.. Establishing a pipeline to identify genotoxic bacteria from the human gut microbiota.
(A) Overview of functional screening of gut microbes for direct genotoxicity. 122 phylogenetically diverse bacterial isolates from 11 IBD patients (shaded based on phylum: Red, Actinobacteria; Blue, Bacteroidetes; Orange, Proteobacteria; Gray, Fusobacteria) were evaluated for genotoxicity via co-incubation with plasmid DNA followed by gel electrophoresis. Bacterial growth curves for all isolates were determined via OD600 and individual isolates were co-cultured with linearized plasmid DNA under anaerobic conditions to stationary phase (TS, light dashed line), or co-cultured under anaerobic conditions to exponential phase (TE, bold dashed line), and then under aerobic conditions to stationary phase. After co-incubation, DNA damage was assessed via gel electrophoresis of purified plasmid DNA under native (top) or denaturing (bottom) conditions. (B) Diverse human gut bacteria exhibit direct DNA damaging activities. Bacterial genotoxicity was determined by calculating the relative intensity reduction (RIR, %) of linearized pUC19 DNA bands after co-incubation with 122 diverse human gut bacteria (as outlined in A) as compared to medium only controls. pUC19 DNA was then purified via column purification and treated with or without gradient NaOH (0 %, 0.2 %, 0.4 %, 1 %) before evaluating DNA integrity via gel electrophoresis. Heatmap columns represent 122 phylogenetically diverse isolates and rows represent native or denaturing conditions (0 %, 0.2 %, 0.4 %, or 1 % NaOH).
Figure 2.
Figure 2.. Small molecule metabolites produced by human gut microbes induced DNA damage.
(A) Sequential screening of diverse human gut microbes for genotoxicity using orthogonal methodologies identifies human gut bacteria that produce small molecule genotoxins. (B) Relative intensity reduction (RIR, %) of linearized pUC19 DNA bands in a secondary screening of 42 putative genotoxic and non-genotoxic isolates selected based on primary screening results (Fig. 1). Linearized pUC19 DNA was co-incubated with select isolates anaerobically to TS or TE, anaerobically to TE and then aerobically to TS, or with bacterial supernatants from isolates cultured anaerobically to TS for 4 h. pUC19 DNA was isolated via column purification after co-incubation and treated with or without NaOH (0 %, 0.2 %, 0.4 %, 1 %) before evaluating DNA integrity via gel electrophoresis. Columns represent 42 isolates and rows represent native or denaturing conditions. Relative intensity reduction (RIR, %) was calculated based on normalization to control samples incubated in Gifu medium alone. (C) MFI (geometric mean fluorescence intensity) of γ-H2AX staining of HeLa cells treated with 40 % (v/v) PBS (Ctrl) or <3 kDa SUP (small-molecule bacterial supernatants) for 5-6 h. (D) Representative histograms of γ-H2AX staining of HeLa cells treated with <3 kDa SUP from C. perfringens, C. ramosum or M. morganii isolates. (E) HeLa cells were treated with 40 % (v/v) PBS or <3 kDa SUP from medium, C. perfringens, C. ramosum or M. morganii isolates for 24 h. Cell cycle arrest was evaluated by propidium iodide (PI) staining based on flow cytometry. (F-I) Assessment of DNA damage induced by ethyl-acetate extracts of C. perfringens, C. ramosum or M. morganii supernatants. Evaluation of nicking of circular pUC19 DNA (top band = nicked DNA) after co-incubation for 5-6 h. Ctrl, control pUC19 DNA in TE buffer. (F); γ-H2AX staining (G and H) and genomic DNA comets (I) in HeLa cells after treatment with 5 mg/ml extracts or without (Ctrl) for 5-6 h. n = 49 for comet assay analysis, n.s., not significant; * p<0.05; ** p<0.01; *** p<0.001; **** p<0.0001, one-way ANOVA.
Figure 3.
Figure 3.. Isolation and identification of a previously undescribed genotoxic metabolite derived from M. morganii.
(A) Overview of isolation and identification of genotoxins derived from M. morganii. (B) Proposed 4 candidate ion features initially detected from M. morganii cultures. Rt, retention time. (C) Evaluation of nicking of circular pUC19 DNA (top band = nicked DNA) after co-incubation overnight with F1–F4 fractions enriched with ion features I–IV, respectively. Ctrl, control pUC19 DNA in TE buffer. (D) Chemical structures of compounds indolimine-214 (1) and 2. (E) MFI of γ-H2AX staining for HeLa cells treated with synthetic compounds at indicated concentrations for 5 h. n.s., not significant; * p<0.05; ** p<0.01; *** p<0.001, two-way ANOVA. (F) Genomic DNA comets in HeLa cells after treatment with 100 μg/ml synthetic compounds for 5-6 h. n = 25 for comet assay analysis, n.s., not significant; * p<0.05; ** p<0.01; *** p<0.001; **** p<0.0001, one-way ANOVA.
Figure 4.
Figure 4.. M. morganii produces multiple genotoxic indolimines in vivo and exacerbates CRC in gnotobiotic mice.
(A) UPLC-QTOF-MS quantification of indolimine-214 (1) in medium or bacterial supernatants of M. morganii, clb+ E. coli, clb− E. coli, NC101 wt E. coli or NC101 mut E. coli. **** p<0.0001, one-way ANOVA. (B) MFI of γ-H2AX in HeLa cells treated with 40 % (v/v) SUP or <3 kDa SUP from medium, M. morganii, or NC101 mut E. coli for 5-6 h. ** p<0.01; *** p<0.001, one-way ANOVA. (C) QTOF-MS quantification of indolimine-214 (1) in cecal contents of gnotobiotic mice colonized by M. morganii, or NC101 mut E. coli. **** p<0.0001, Student’s t-test. (D) Chemical structures of compounds indolimine-200 (3) and indolimine-248 (4). (E) QTOF-MS quantification of indolimine-200 (3) and indolimine-248 (4) in cecal contents of gnotobiotic mice colonized by M. morganii, or NC101 mut E. coli. **** p<0.0001, Student’s t-test. (F) UPLC-QTOF-MS quantification of indolimine-200 (3) and indolimine-248 (4) in bacterial supernatants of M. morganii or NC101 mut E. coli. **** p<0.0001, Student’s t-test. (G) MFI of γ-H2AX staining for HeLa cells treated with synthetic compounds at indicated concentrations for 5 h. n.s., not significant; * p<0.05; ** p<0.01; **** p<0.0001, two-way ANOVA. (H) Schematic of experimental design for CRC induction in age-matched gnotobiotic mice colonized with M. morganii or NC101 mut E. coli. (I-K) Representative colon tissue and histology images (I), tumor number and tumor score (J), and fecal lipocalin 2 levels (K; Day 78) in gnotobiotic mice colonized with M. morganii or NC101 mut E. coli. Each dot represents one mouse (n = 4-6 per group), n.s., not significant; ** p<0.01, Student’s t-test.

Comment in

References

    1. Keum N, Giovannucci E, Global burden of colorectal cancer: emerging trends, risk factors and prevention strategies. Nat Rev Gastroenterol Hepatol 16, 713–732 (2019). - PubMed
    1. Jasperson KW, Tuohy TM, Neklason DW, Burt RW, Hereditary and familial colon cancer. Gastroenterology 138, 2044–2058 (2010). - PMC - PubMed
    1. Brennan CA, Garrett WS, Gut Microbiota, Inflammation, and Colorectal Cancer. Annu Rev Microbiol 70, 395–411 (2016). - PMC - PubMed
    1. Tilg H, Adolph TE, Gerner RR, Moschen AR, The Intestinal Microbiota in Colorectal Cancer. Cancer Cell 33, 954–964 (2018). - PubMed
    1. Garrett WS, Cancer and the microbiota. Science 348, 80–86 (2015). - PMC - PubMed

Publication types