Editorial
. 2023 Feb 6;13(2):410-431.
doi: 10.1158/2159-8290.CD-22-0523.

Cellular Senescence Is Immunogenic and Promotes Antitumor Immunity

Affiliations
Editorial

Cellular Senescence Is Immunogenic and Promotes Antitumor Immunity

Ines Marin et al. Cancer Discov. .

Abstract

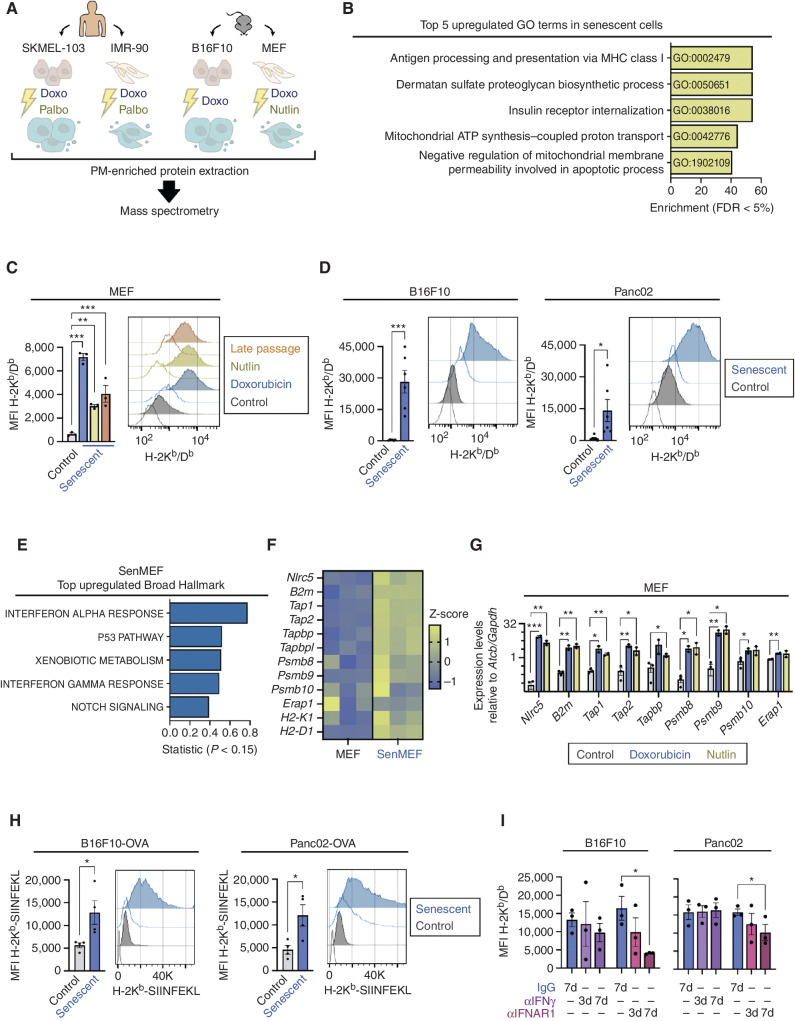
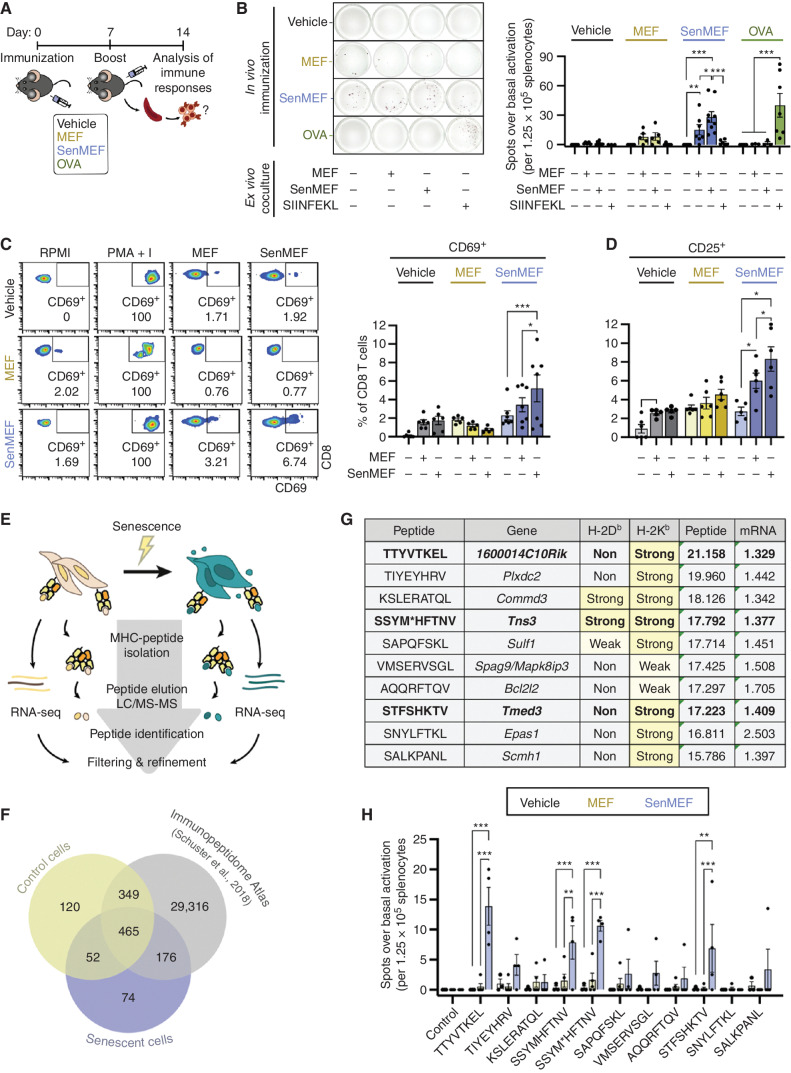
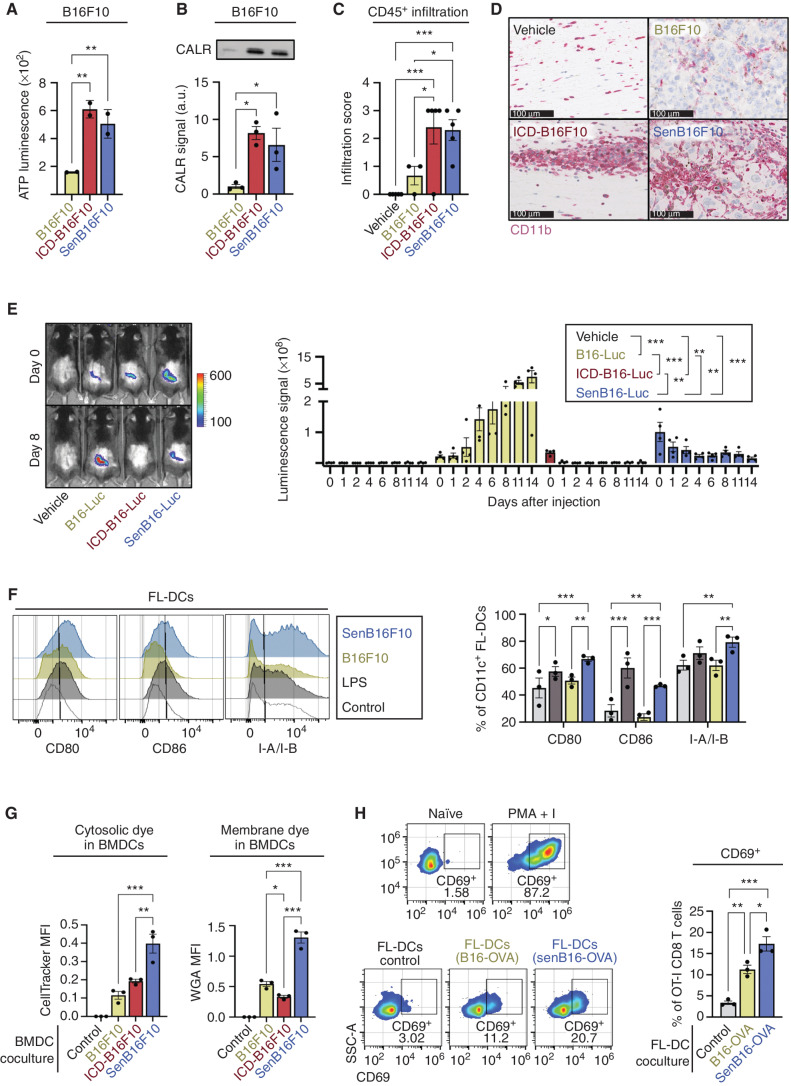
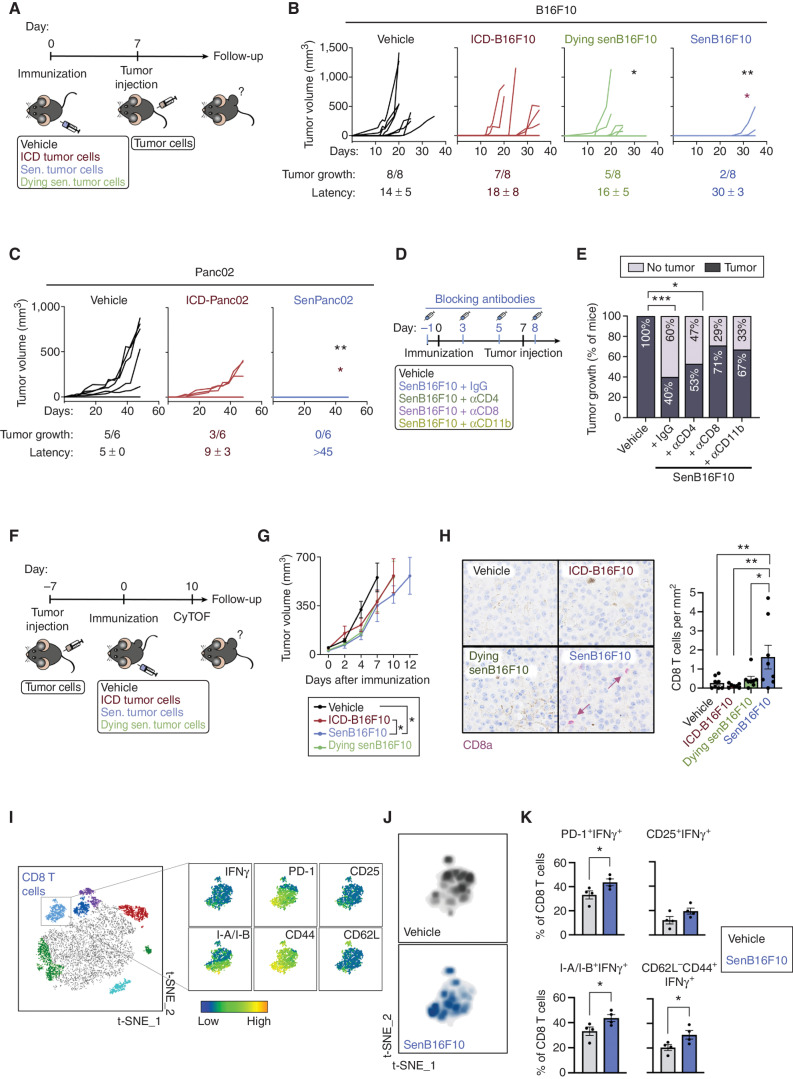
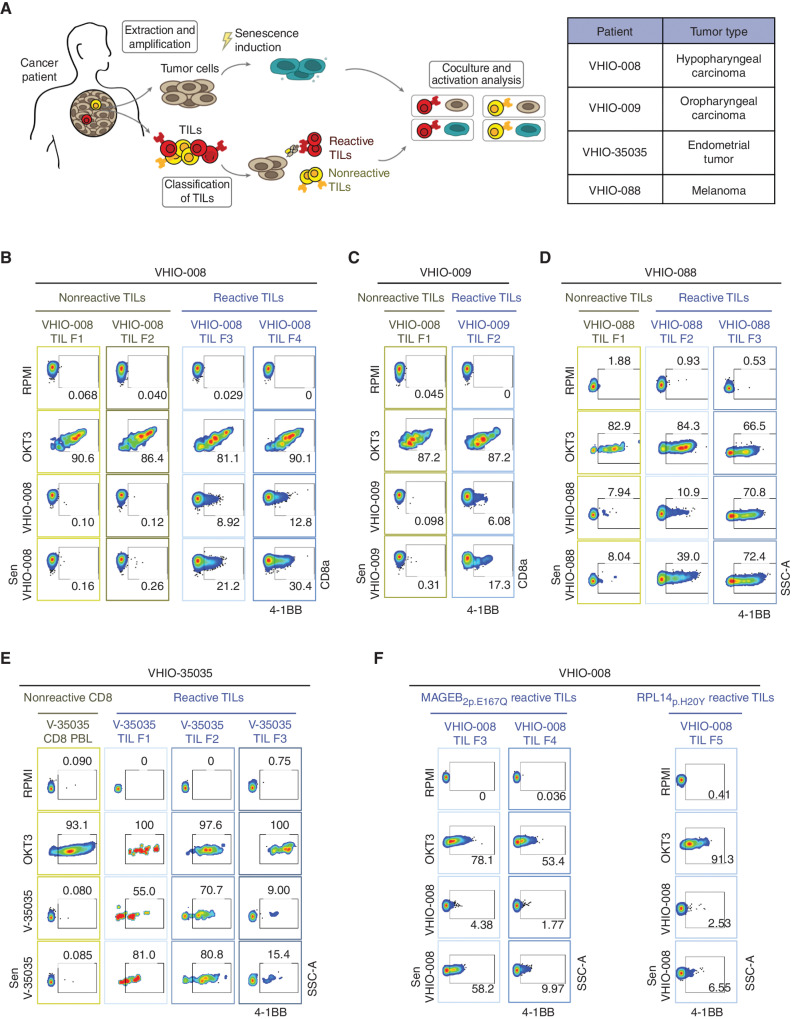
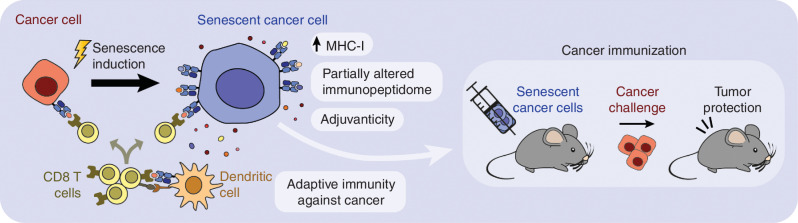
Cellular senescence is a stress response that activates innate immune cells, but little is known about its interplay with the adaptive immune system. Here, we show that senescent cells combine several features that render them highly efficient in activating dendritic cells (DC) and antigen-specific CD8 T cells. This includes the release of alarmins, activation of IFN signaling, enhanced MHC class I machinery, and presentation of senescence-associated self-peptides that can activate CD8 T cells. In the context of cancer, immunization with senescent cancer cells elicits strong antitumor protection mediated by DCs and CD8 T cells. Interestingly, this protection is superior to immunization with cancer cells undergoing immunogenic cell death. Finally, the induction of senescence in human primary cancer cells also augments their ability to activate autologous antigen-specific tumor-infiltrating CD8 lymphocytes. Our study indicates that senescent cancer cells can be exploited to develop efficient and protective CD8-dependent antitumor immune responses.

Significance: Our study shows that senescent cells are endowed with a high immunogenic potential-superior to the gold standard of immunogenic cell death. We harness these properties of senescent cells to trigger efficient and protective CD8-dependent antitumor immune responses. See related article by Chen et al., p. 432. This article is highlighted in the In This Issue feature, p. 247.


Figures

Figure 1. Senescent cells upregulate MHC-I antigen presentation. A, Schematics of the proteomic screen of the plasma membrane–enriched fraction of human (SKMEL-103 and IMR-90) and murine (B16F10 and MEF) cells, control or exposed to various senescence-inducing stimuli (doxo, doxorubicin; palbo, palbociblib; nutlin, nutlin-3a). Three independent biological replicates per cell line were analyzed. B, Top 5 upregulated GO terms enriched in the proteins found upregulated in the plasma membrane fraction of senescent cells (in 4 or more conditions of senescence, with a linear fold change >1.5, FDR < 5%). C, Flow cytometry analysis of H-2Kb/Db expression in control versus senescent MEFs, treated with doxorubicin, nutlin or late passaged. Representative histograms showing the fluorescence signal of each stained sample and its unstained control (uncolored histogram) and quantification after autofluorescence subtraction of n = 3 independent experiments are shown. ***, P < 0.001; **, P < 0.01; one-way ANOVA, compared with control MEFs. D, Flow cytometry analysis of H-2Kb/Db expression in control or senescent B16F10 and Panc02 cancer cells, treated with doxorubicin. Representative histograms showing the fluorescence signal of each stained sample and its unstained control (uncolored histogram) and quantification after autofluorescence subtraction of n = 5 independent experiments are shown. ***, P < 0.001; *, P < 0.05; unpaired Student t test, compared with control cells. E, Top 5 upregulated “Broad Hallmarks” from the differential expression analysis (RNA-seq) of senescent MEFs, in which senescence was induced by doxorubicin, compared with control MEFs. n = 3 independent biological replicates were analyzed. F, Normalized expression levels of antigen presentation machinery- and immunoproteasome-related genes from the RNA-seq analysis of control versus senescent MEFs. G, mRNA expression levels of antigen presentation machinery- and immunoproteasome-related genes in control versus senescent MEFs, treated with doxorubicin or nutlin, measured by qRT-PCR (relative to the average expression of housekeeping genes Actb and Gapdh). n = 2 independent experiments. ***, P < 0.001; **, P < 0.01; *, P < 0.05, unpaired Student t test, compared with control cells. H, Flow cytometry analysis of ovalbumin (OVA)-derived SIINFEKL peptide bound to H-2Kb presentation in control or senescent B16F10 and Panc02 cells stably expressing OVA. Representative histograms showing the fluorescence signal of each stained sample and its unstained control (uncolored histogram) and quantification after autofluorescence subtraction are shown. *, P < 0.05; unpaired Student t test, compared with control cells. I, Flow cytometry analysis of H-2Kb/Db expression in senescent B16F10 or Panc02 cells, treated with doxorubicin, after treatment with blocking antibodies against IFNγ, IFNAR1, or their respective IgG isotype controls. Cells were treated with doxorubicin at day 0 and collected at day 7. The blocking antibodies were added to the culture medium for the indicated number of days (7d: from day 0 to 7; 3d: from day 4 to 7). Quantification after autofluorescence subtraction of n = 3 independent experiments is shown. *, P < 0.01; two-way ANOVA test, compared with IgG-treated senescent cells.
Figure 1.
Senescent cells upregulate MHC-I antigen presentation. A, Schematics of the proteomic screen of the plasma membrane (PM)–enriched fraction of human (SKMEL-103 and IMR-90) and murine (B16F10 and MEF) cells, either untreated or exposed to various senescence-inducing stimuli (doxo, doxorubicin; nutlin, nutlin-3A; palbo, palbociclib). Three independent biological replicates per cell line were analyzed. B, Top five upregulated GO terms enriched in the proteins found upregulated in the plasma membrane fraction of senescent cells (in 4 or more conditions of senescence, with a linear fold change >1.5, FDR < 5%). C, Flow cytometry analysis of H-2Kb/Db expression in control versus senescent MEFs treated with doxorubicin or nutlin or late passaged. Representative histograms showing the fluorescence signal of each stained sample and its unstained control (uncolored histogram) and quantification after autofluorescence subtraction of n = 3 independent experiments are shown. ***, P < 0.001; **, P < 0.01; one-way ANOVA compared with control MEFs. MFI, mean fluorescence intensity. D, Flow cytometry analysis of H-2Kb/Db expression in control or senescent B16F10 and Panc02 cancer cells, treated with doxorubicin. Representative histograms showing the fluorescence signal of each stained sample and its unstained control (uncolored histogram) and quantification after autofluorescence subtraction of n = 5 independent experiments are shown. ***, P < 0.001; *, P < 0.05; unpaired Student t test compared with control cells. E, Top five upregulated “Broad Hallmarks” from the differential expression analysis (RNA-seq) of senescent MEFs (senMEF), in which senescence was induced by doxorubicin compared with control MEFs. n = 3 independent biological replicates were analyzed. F, Normalized expression levels of antigen presentation machinery– and immunoproteasome-related genes from the RNA-seq analysis of control versus senescent MEFs. G, mRNA expression levels of antigen presentation machinery– and immunoproteasome-related genes in control versus senescent MEFs treated with doxorubicin or nutlin, as measured by qRT-PCR (relative to the average expression of housekeeping genes Actb and Gapdh). n = 2 independent experiments. ***, P < 0.001; **, P < 0.01; *, P < 0.05, unpaired Student t test compared with control cells. H, Flow cytometry analysis of OVA-derived SIINFEKL peptide bound to H-2Kb presentation in control or senescent B16F10 and Panc02 cells stably expressing OVA. Representative histograms showing the fluorescence signal of each stained sample and its unstained control (uncolored histogram) and quantification after autofluorescence subtraction are shown. *, P < 0.05; unpaired Student t test compared with control cells. I, Flow cytometry analysis of H-2Kb/Db expression in senescent B16F10 or Panc02 cells, treated with doxorubicin, after treatment with blocking antibodies against IFNγ, IFNAR1, or their respective IgG isotype controls. Cells were treated with doxorubicin at day 0 and collected at day 7. The blocking antibodies were added to the culture medium for the indicated number of days (7d: from day 0 to 7; 3d: from day 4 to 7). Quantification after autofluorescence subtraction of n = 3 independent experiments is shown. *, P < 0.01; two-way ANOVA test compared with IgG-treated senescent cells.
Figure 2. Senescent noncancer cells induce an adaptive immune response in vivo and present unique immunogenic peptides. A, Schematic outline of the immunization protocol used in this study. Briefly, immunocompetent C57BL/6 animals were subcutaneously immunized on days 0 and 7 with vehicle (no cells), control or senescent syngeneic fibroblasts (MEF or senMEF respectively) or ovalbumin (OVA), all done concomitantly with an immune adjuvant (CpG). One week later, animals were sacrificed, and immune responses were tested ex vivo. B, ELISpot assay to detect IFNγ production in splenocytes isolated from nonimmunized mice (vehicle) or animals immunized with control MEF, senMEF, or OVA (n = 3–7 mice per group). Splenocytes were cultured in RPMI, either alone (control) or cocultured with control MEF (1:10 target-to-splenocyte ratio), senMEF (1:10 target-to-splenocyte ratio), or with SIINFEKL OVA-derived peptide (400 nmol/L). The number of spots for each condition above the control condition (background) was quantified. Representative picture (left) and quantification (right) are shown. ***, P < 0.001; **, P < 0.01; two-way ANOVA test. C, Flow cytometry analysis of CD69 activation marker in CD8 T cells from naïve (vehicle) versus MEF or senMEF-immunized animals, after culture in RPMI medium either alone or with PMA + I, MEF, or senMEF ex vivo. Representative pseudocolor plots and quantification of n = 5–7 mice per group are shown. ***, P < 0.001; *, P < 0.05; two-way ANOVA test. D, Flow cytometry analysis of CD25 activation marker in CD8 T cells from naïve (vehicle) versus MEF or senMEF-immunized animals, after culture in RPMI medium either alone or with PMA+I, MEF or senMEF ex vivo (n = 5–7 mice per group). *, P < 0.05; two-way ANOVA test. E, Layout of combined immunopeptidomics and RNA-seq analyses in control versus senescent MEFs. F, Venn diagram displaying peptides identified in control cells, senescent cells, and the Mouse Immunopeptidome Atlas data set (39). G, List of selected peptides presented exclusively on senescent cells MHC-I together with their corresponding coding gene and their predicted binding affinity to H-2Kb and H-2Db (NetMHCpan v4.1). Normalized log2(area) of the signal obtained in the immunopeptidomic mass spectrometry analysis for each peptide and linear fold-change expression of the corresponding gene (senescent versus control MEF) from the RNA-seq transcriptomic analysis are indicated. M* indicates M(+15.99), oxidized methionine. H, Selected peptides validated using ELISpot assay to detect IFNγ production in splenocytes isolated from nonimmunized mice (vehicle) or animals immunized with MEF or senMEF (n = 3–5 mice per group). Splenocytes were cultured in RPMI medium, either alone as negative control (control) or supplemented with the different peptides selected from the immunopeptidome analysis, as indicated. For SSYM*HFTNV peptide, both SSYMHFTNV and the modified SSYM*HFTNV were tested. The number of spots for each condition above the control condition (background) was quantified. ***, P < 0.001; **, P < 0.01; *, P < 0.05; two-way ANOVA test.
Figure 2.
Senescent noncancer cells induce an adaptive immune response in vivo and present unique immunogenic peptides. A, Schematic outline of the immunization protocol used in this study. Briefly, immunocompetent C57BL/6 animals were subcutaneously immunized on days 0 and 7 with vehicle (no cells), control or senescent syngeneic fibroblasts (MEF or senMEF, respectively), or OVA, all done concomitantly with an immune adjuvant (CpG). One week later, animals were sacrificed, and immune responses were tested ex vivo.B, ELISpot assay to detect IFNγ production in splenocytes isolated from nonimmunized mice (vehicle) or animals immunized with control MEF, senMEF, or OVA (n = 3–7 mice per group). Splenocytes were cultured in RPMI either alone (control) or cocultured with control MEF (1:10 target-to-splenocyte ratio), senMEF (1:10 target-to-splenocyte ratio), or SIINFEKL OVA-derived peptide (400 nmol/L). The number of spots for each condition above the control condition (background) was quantified. Representative pictures (left) and quantification (right) are shown. ***, P < 0.001; **, P < 0.01; *, P < 0.05; two-way ANOVA test. C, Flow cytometry analysis of CD69 activation marker in CD8 T cells from naïve (vehicle) versus MEF- or senMEF-immunized animals after culture in RPMI medium either alone or with PMA + I, MEF, or senMEF ex vivo. Representative pseudocolor plots and quantification of n = 5–7 mice per group are shown. ***, P < 0.001; *, P < 0.05; two-way ANOVA test. D, Flow cytometry analysis of CD25 activation marker in CD8 T cells from naïve (vehicle) versus MEF- or senMEF-immunized animals after culture in RPMI medium either alone or with PMA + I, MEF, or senMEF ex vivo (n = 5–7 mice per group). *, P < 0.05; two-way ANOVA test. E, Layout of combined immunopeptidomics and RNA-seq analyses in control versus senescent MEFs. F, Venn diagram displaying peptides identified in control cells, senescent cells, and the Mouse Immunopeptidome Atlas dataset (40). G, List of selected peptides presented exclusively on senescent cell MHC-I together with their corresponding coding gene and their predicted binding affinity to H-2Kb and H-2Db (NetMHCpan v4.1; classified as non-, weak, or strong binders, with the latter two highlighted in yellow). “Peptide” indicates the normalized log2(area) of the signal obtained in the immunopeptidomic mass spectrometry analysis for each peptide. Similarly, “mRNA” indicates the linear fold-change expression of the corresponding gene (senescent vs. control MEF) from the RNA-seq transcriptomic analysis are indicated. M* indicates M(+15.99), oxidized methionine. Bold font indicates those peptides that were validated as immunogenic (see next panel). H, Selected peptides validated using ELISpot assay to detect IFNγ production in splenocytes isolated from nonimmunized mice (vehicle) or animals immunized with MEF or senMEF (n = 3–5 mice per group). Splenocytes were cultured in RPMI medium either alone as negative control (control) or supplemented with the different peptides selected from the immunopeptidome analysis, as indicated. For SSYM*HFTNV peptide, both SSYMHFTNV and the modified SSYM*HFTNV were tested. The number of spots for each condition above the control condition (background) was quantified. ***, P < 0.001; **, P < 0.01; two-way ANOVA test.
Figure 3. Senescent cancer cells efficiently activate DCs. A, Levels of extracellular ATP in the conditioned medium (CM) of 106 control (B16F10), ICD (5 μm doxorubicin; ICD-B16F10), and senescent B16F10 (0.1 μm doxorubicin, senB16F10). n = 2 independent experiments. **, P < 0.01; one-way ANOVA test compared with control B16F10. B, Immunoblot detection of CALR in the CM of 106 B16F10, ICD-B16F10, and senB16F10. Representative image (left) and quantification (right) of n = 3 independent experiments are shown. **, P < 0.01; one-way ANOVA test. C, Semiquantitative infiltration score of CD45+ cells within or closely surrounding the melanoma foci in skin sections of animals 7 days after subcutaneous injection of vehicle (no cells), B16F10, ICD-B16F10, or senB16F10 (n = 5 animals per group). Analysis performed by a histopathologist. ***, P < 0.001; *, P < 0.05; one-way ANOVA test. D, Immunochemistry staining of CD11b+ cells (purple) in skin sections of animals 7 days after subcutaneous injection of vehicle (no cells), B16F10, ICD-B16F10, or senB16F10. Representative images selected by a histopathologist of n = 5 animals per group are shown. Note that the brown pigmentation is due to melanin. Scale bars for each image are shown (100 μm). E, In vivo imaging detection of luciferase-expressing B16F10 (B16-Luc) in animals subcutaneously injected with vehicle, 106 control, ICD or senescent B16-Luc (n = 4 per group) at different time points after injection (as indicated). Representative images (left) and quantification (right) are shown. ***, P < 0.001; **, P < 0.01; two-way ANOVA test. F, Flow cytometry analysis of the DC activation markers CD80, CD86, and MHC-II (I-A/I-B) in CD11c+ FL-DCs upon coculture with RPMI medium either alone or with LPS, B16F10, or senB16F10. Representative histograms and quantification of n = 3 biological replicates are shown. ***, P < 0.001, **, P < 0.01; *, P < 0.05; one-way ANOVA test. G, Flow cytometry analysis of the uptake of CFSE (cytosolic dye) or WGA-Alexa647 (membrane dye) by BMDCs from labeled B16F10, ICD-B16F10, or senB10F10. Quantification after subtraction of autofluorescence from unstained BMDCs of n = 3 biological replicates. ***, P< 0.001; **, P < 0.01; *, P < 0.05; one-way ANOVA test. H, Flow cytometry analysis of OT-I CD8 T-cell activation, as measured by CD69 expression, upon coculture with RPMI medium either alone (naïve) or with PMA + I, control FL-DCs or FL-DCs previously cocultured with control (B16-OVA) or senescent (senB16OVA) B16-OVA cells, as indicated. Representative histograms and quantification of n = 3 biological replicates are shown. ***, P < 0.001; **, P < 0.01; *, P < 0.05; one-way ANOVA test.
Figure 3.
Senescent cancer cells efficiently activate dendritic cells (DC). A, Levels of extracellular ATP in the CM of 106 control (B16F10), ICD B16F10 (5 μmol/L doxorubicin; ICD-B16F10), and senescent B16F10 (0.1 μmol/L doxorubicin; senB16F10). n = 2 independent experiments. **, P < 0.01; one-way ANOVA test compared with control B16F10. B, Immunoblot detection of CALR in the CM of 106 B16F10, ICD-B16F10, and senB16F10. Representative images (left) and quantification (right) of n = 3 independent experiments are shown. *, P < 0.05; one-way ANOVA test. C, Semiquantitative infiltration score of CD45+ cells within or closely surrounding the melanoma foci in skin sections of animals 7 days after subcutaneous injection of vehicle (no cells), B16F10, ICD-B16F10, or senB16F10 (n = 5 animals per group). Analysis performed by a histopathologist (N. Prats). ***, P < 0.001; *, P < 0.05; one-way ANOVA test. D, Immunochemistry staining of CD11b+ cells (purple) in skin sections of animals 7 days after subcutaneous injection of vehicle (no cells), B16F10, ICD-B16F10, or senB16F10. Representative images selected by a histopathologist (N. Prats) of n = 5 animals per group are shown. Note that the brown pigmentation is due to melanin. Scale bars for each image are shown (100 μm). E,In vivo imaging detection of luciferase-expressing B16F10 (B16-Luc) in animals subcutaneously injected with vehicle, 106 control, ICD B16-Luc, or senescent B16-Luc (n = 4 per group) at different time points after injection (as indicated). Representative images (left) and quantification (right) are shown. ***, P < 0.001; **, P < 0.01; two-way ANOVA test. F, Flow cytometry analysis of the DC activation markers CD80, CD86, and MHC-II (I-A/I-B) in CD11c+ FL-DCs upon coculture with RPMI medium either alone or with LPS, B16F10, or senB16F10. Representative histograms and quantification of n = 3 biological replicates are shown. ***, P < 0.001, **, P < 0.01; *, P < 0.05; one-way ANOVA test. G, Flow cytometry analysis of the uptake of CFSE (cytosolic dye) or WGA-Alexa647 (membrane dye) by BMDCs from labeled B16F10, ICD-B16F10, or senB16F10. Quantification after subtraction of autofluorescence from unstained BMDCs of n = 3 biological replicates. ***, P< 0.001; **, P < 0.01; *, P < 0.05; one-way ANOVA test. MFI, mean fluorescence intensity. H, Flow cytometry analysis of OT-I CD8 T-cell activation, as measured by CD69 expression, upon coculture with RPMI medium either alone (naïve) or with PMA + I, control FL-DCs or FL-DCs previously cocultured with control (B16-OVA) or senescent (senB16-OVA) B16-OVA cells, as indicated. Representative histograms and quantification of n = 3 biological replicates are shown. SSC-A, side scatter area. ***, P < 0.001; **, P < 0.01; *, P < 0.05; one-way ANOVA test.
Figure 4. Immunization with senescent cancer cells promotes anticancer immune surveillance. A, Schematics of the cancer immunization protocol used in these studies. B, Individual tumor growth curves from vehicle-treated mice or mice immunized with ICD-B16F10, senB16F10, or senB16F10 cells dying by senolysis (induced by 10 μmol/L navitoclax, dying-senB16F10; n = 8 mice per group). Tumor growth (number of animals developing tumors out of the total) and tumor latency (mean ± SD of the day in which the tumor appeared) are indicated for each group. **, P < 0.01; *, P < 0.05; two-way ANOVA test compared with vehicle-treated group (black) or to ICD-B16F10 group (red). C, Individual tumor growth curves from vehicle-treated mice or mice immunized with Panc02 cells dying by ICD (induced by a high dose of doxorubicin, ICD-Panc02) or senescent Panc02 (low dose of doxorubicin, senPanc02; n = 6 mice per group). Tumor growth (number of animals developing tumors out of the total) and tumor latency (mean ± SD day of appearance of the tumor) are indicated for each group. **, P < 0.01; *, P < 0.05; two-way ANOVA test compared with vehicle-treated (black) group or to ICD-B16F10 group (red). D, Schematics of the cancer immunization and immune depletion protocol used in this study. E, Tumor appearance after rechallenge in vehicle-treated mice (n = 14) or mice immunized with senB16F10 treated with IgG (n = 14) or the indicated blocking antibodies as described in D (n = 15 for aCD4, n = 14 for aCD8, or n = 6 for aCD11b). ***, P < 0.001, *, P < 0.05, Fisher exact test. F, Schematics of the therapeutic cancer immunization protocol used in these studies. G, Grouped tumor growth of B16F10 tumor-bearing animals immunized with vehicle, ICD-B16F10, dying senB16F10, or senB16F10. *, P < 0.05; two-way ANOVA test (n = 7–8) H. CD8a staining (purple) in B16F10 tumor sections from animals immunized with vehicle, ICD-B16F10, dying senB16F10 or senB16F10, sacrificed at humane endpoint. Note that the brown pigmentation is due to melanin. Representative images and quantification (of n = 7–8 mice per group). **, P < 0.01; *, P < 0.05; one-way ANOVA test. I, tSNE representation of tumor-infiltrating immune (CD45+) cells detected by CyTOF of B16F10 tumors from animals immunized with vehicle or senB16F10, sacrificed 10 days after immunization. The cluster of CD8 T cells is amplified, and the expression pattern of T-cell markers of activation (IFNγ, PD-1, CD25, and I-a/I-b), and differentiation to effector (CD44) or naïve T cells (CD62L) is shown (left). J, Density plot of the distribution of infiltrating CD8 T cells from nonimmunized and senB16F10-immunized animals (n = 4 animals per group). K, Percentage of activated tumor-infiltrating CD8 T cells (PD-1+IFNγ+, CD25+IFNγ+, I-a/I-b+IFNγ+, CD62L−CD44+IFNγ+), from tumors of nonimmunized animals (vehicle) or immunized with senB16F10 (n = 4 mice per group). *, P < 0.05; unpaired Student test.
Figure 4.
Immunization with senescent cancer cells promotes anticancer immune surveillance. A, Schematics of the cancer immunization protocol used in these studies. Sen., senescent. B, Individual tumor growth curves from vehicle-treated mice or mice immunized with ICD-B16F10, senB16F10, or senB16F10 cells dying by senolysis (induced by 10 μmol/L navitoclax, dying senB16F10; n = 8 mice per group). Tumor growth (number of animals developing tumors out of the total) and tumor latency (mean ± SD of the day on which the tumor appeared) are indicated for each group. **, P < 0.01; *, P < 0.05; two-way ANOVA test compared with vehicle-treated group (black) or ICD-B16F10 group (red). C, Individual tumor growth curves from vehicle-treated mice or mice immunized with Panc02 cells dying by ICD (induced by a high dose of doxorubicin, ICD-Panc02) or senescent Panc02 (low dose of doxorubicin, senPanc02; n = 6 mice per group). Tumor growth (number of animals developing tumors out of the total) and tumor latency (mean ± SD day of appearance of the tumor) are indicated for each group. **, P < 0.01; *, P < 0.05; two-way ANOVA test compared with vehicle-treated (black) group or ICD-B16F10 group (red). D, Schematics of the cancer immunization and immune depletion protocol used in this study. E, Tumor appearance after rechallenge in vehicle-treated mice (n = 14) or mice immunized with senB16F10 treated with IgG (n = 14) or the indicated blocking antibodies as described in D (n = 15 for aCD4, n = 14 for aCD8, or n = 6 for aCD11b). ***, P < 0.001; *, P < 0.05; Fisher exact test. F, Schematics of the therapeutic cancer immunization protocol used in these studies. CyTOF, cytometry by time of flight. G, Grouped tumor growth of B16F10 tumor–bearing animals immunized with vehicle, ICD-B16F10, dying senB16F10, or senB16F10. *, P < 0.05; two-way ANOVA test (n = 7–8) H, CD8a staining (purple) in B16F10 tumor sections from animals immunized with vehicle, ICD-B16F10, dying senB16F10, or senB16F10 and sacrificed at humane endpoint. Note that the brown pigmentation is due to melanin. Representative images and quantification of n = 7–8 mice per group. **, P < 0.01; *, P < 0.05; one-way ANOVA test. I, t-Distributed stochastic neighbor embedding (t-SNE) representation of tumor-infiltrating immune (CD45+) cells detected by CyTOF of B16F10 tumors from animals immunized with vehicle or senB16F10 and sacrificed 10 days after immunization. The cluster of CD8 T cells is amplified, and the expression pattern of T-cell markers of activation (IFNγ, PD-1, CD25, and I-A/I-B), and differentiation to effector (CD44) or naïve T cells (CD62L) are shown (left). J, Density plots of the distribution of infiltrating CD8 T cells from nonimmunized and senB16F10-immunized animals (n = 4 animals per group). K, Percentage of activated tumor-infiltrating CD8 T cells (PD-1+IFNγ+, CD25+IFNγ+, I-A/I-B+IFNγ+, CD62LCD44+IFNγ+) from tumors of nonimmunized animals (vehicle) or immunized with senB16F10 (n = 4 mice per group). *, P < 0.05; unpaired Student test.
Figure 5. Senescent cancer cells from human patients hyperstimulate autologous reactive TILs. A, Schematics of the procedure for isolating, amplifying, classifying, and coculturing patient-derived tumor cells with autologous reactive and nonreactive TILs (left). Table indicating patients and corresponding tumor type used in this study (right). B, Flow cytometry analysis of 4-1BB activation marker in CD8 cells from nonreactive (F1 and F2 fragments) and reactive (F3 and F4 fragments) autologous TILs from VHIO-008 patient after culture in RPMI medium either alone or with anti-CD3 (OKT3), control VHIO-008 cells, or bleomycin-treated senescent VHIO-008 cells (as indicated). C, Flow cytometry analysis of 4-1BB activation marker in CD8 cells from nonreactive (F1 fragment) and reactive (F3 fragment) autologous TILs from patient VHIO-009 after culture in RPMI medium either alone or with anti-CD3 (OKT3), control VHIO-009 cells, or bleomycin-treated senescent VHIO-009 cells (as indicated). D, Flow cytometry analysis of the 4-1BB activation marker in CD8 cells from nonreactive (F1 fragment) and reactive (F2 and F3 fragment) autologous TILs from patient VHIO-088 after culture in RPMI medium either alone or with anti-CD3 (OKT3), control VHIO-088 cells, or bleomycin-treated senescent VHIO-088 cells (as indicated). SSC-A, side scatter area. E, Flow cytometry analysis of the 4-1BB activation marker in nonreactive PBL CD8 T cells and CD8 cells from reactive (F1, F2, and F3 fragments) autologous TILs from patient VHIO-35035 (abbreviated as V-35035) after culture in RPMI medium either alone or with anti-CD3 (OKT3), control V-35035 cells, or bleomycin-treated senescent V-35035 cells (as indicated). F, Flow cytometry analysis of 4-1BB activation marker in CD8 cells from reactive autologous TILs (reactive F3, F4 and F5 fragments) enriched to be reactive against MAGEB2p.E167Q and RPL14p.H20Y (two neoantigens previously identified by whole-exome sequencing of the autologous tumor cell line) after culture in RPMI medium either alone or with anti-CD3 (OKT3), control VHIO-008 cells, or bleomycin-treated senescent VHIO-008 cells (as indicated).
Figure 5.
Senescent cancer cells from human patients hyperstimulate autologous reactive TILs. A, Schematics of the procedure for isolating, amplifying, classifying, and coculturing patient-derived tumor cells with autologous reactive and nonreactive TILs (left). Table indicating patients and corresponding tumor type used in this study (right). B, Flow cytometry analysis of 4-1BB activation marker in CD8 cells from nonreactive (F1 and F2 fragments) and reactive (F3 and F4 fragments) autologous TILs from VHIO-008 patient after culture in RPMI medium either alone or with anti-CD3 (OKT3), control VHIO-008 cells, or bleomycin-treated senescent VHIO-008 cells (as indicated). C, Flow cytometry analysis of 4-1BB activation marker in CD8 cells from nonreactive (F1 fragment) and reactive (F3 fragment) autologous TILs from patient VHIO-009 after culture in RPMI medium either alone or with anti-CD3 (OKT3), control VHIO-009 cells, or bleomycin-treated senescent VHIO-009 cells (as indicated). D, Flow cytometry analysis of the 4-1BB activation marker in CD8 cells from nonreactive (F1 fragment) and reactive (F2 and F3 fragment) autologous TILs from patient VHIO-088 after culture in RPMI medium either alone or with anti-CD3 (OKT3), control VHIO-088 cells, or bleomycin-treated senescent VHIO-088 cells (as indicated). SSC-A, side scatter area. E, Flow cytometry analysis of the 4-1BB activation marker in nonreactive PBL CD8 T cells and CD8 cells from reactive (F1, F2, and F3 fragments) autologous TILs from patient VHIO-35035 (abbreviated as V-35035) after culture in RPMI medium either alone or with anti-CD3 (OKT3), control V-35035 cells, or bleomycin-treated senescent V-35035 cells (as indicated). F, Flow cytometry analysis of 4-1BB activation marker in CD8 cells from reactive autologous TILs (reactive F3, F4 and F5 fragments) enriched to be reactive against MAGEB2p.E167Q and RPL14p.H20Y (two neoantigens previously identified by whole-exome sequencing of the autologous tumor cell line) after culture in RPMI medium either alone or with anti-CD3 (OKT3), control VHIO-008 cells, or bleomycin-treated senescent VHIO-008 cells (as indicated).
Figure 6. Graphical summary.
Figure 6.
Graphical summary.

Comment in

Comment on

  • Senescence Rewires Microenvironment Sensing to Facilitate Antitumor Immunity.
    Chen HA, Ho YJ, Mezzadra R, Adrover JM, Smolkin R, Zhu C, Woess K, Bernstein N, Schmitt G, Fong L, Luan W, Wuest A, Tian S, Li X, Broderick C, Hendrickson RC, Egeblad M, Chen Z, Alonso-Curbelo D, Lowe SW. Chen HA, et al. Cancer Discov. 2023 Feb 6;13(2):432-453. doi: 10.1158/2159-8290.CD-22-0528. Cancer Discov. 2023. PMID: 36302222 Free PMC article.

References

    1. Muñoz-Espín D, Serrano M. Cellular senescence: from physiology to pathology. Nat Rev Mol Cell Biol 2014;15:482–96. - PubMed
    1. Gorgoulis V, Adams PD, Alimonti A, Bennett DC, Bischof O, Bishop C, et al. Cellular senescence: defining a path forward. Cell 2019;179:813–27. - PubMed
    1. Coppé JP, Desprez PY, Krtolica A, Campisi J. The senescence-associated secretory phenotype: the dark side of tumor suppression. Annu Rev Pathol Mech Dis 2010;5:99–118. - PMC - PubMed
    1. Birch J, Gil J. Senescence and the SASP: many therapeutic avenues. Genes Dev 2020;34:1565–76. - PMC - PubMed
    1. Prata LGPL, Ovsyannikova IG, Tchkonia T, Kirkland JL. Senescent cell clearance by the immune system: emerging therapeutic opportunities. Semin Immunol 2018;40:101275. - PMC - PubMed