Editorial
. 2023 Feb 6;13(2):432-453.
doi: 10.1158/2159-8290.CD-22-0528.

Senescence Rewires Microenvironment Sensing to Facilitate Antitumor Immunity

Affiliations
Editorial

Senescence Rewires Microenvironment Sensing to Facilitate Antitumor Immunity

Hsuan-An Chen et al. Cancer Discov. .

Abstract

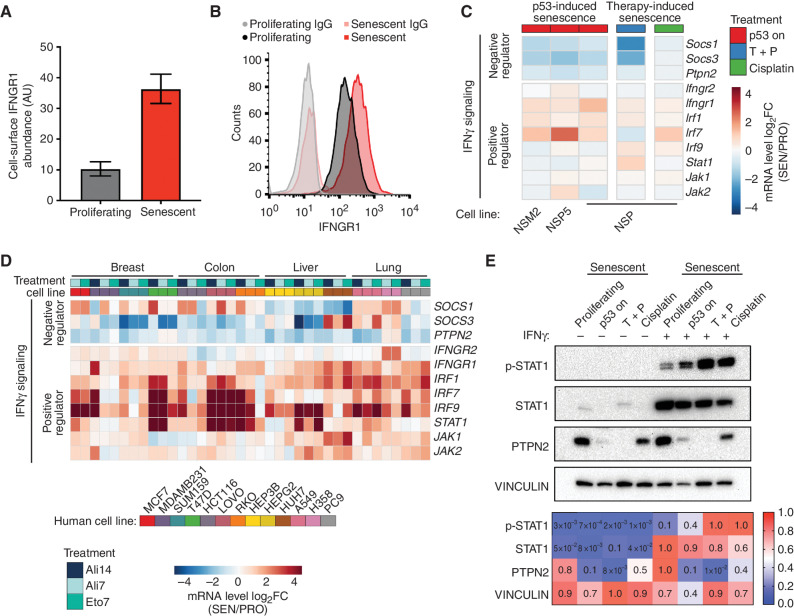
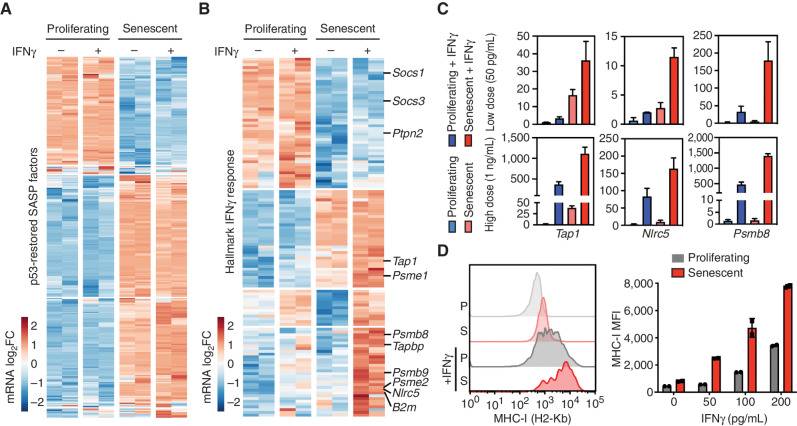
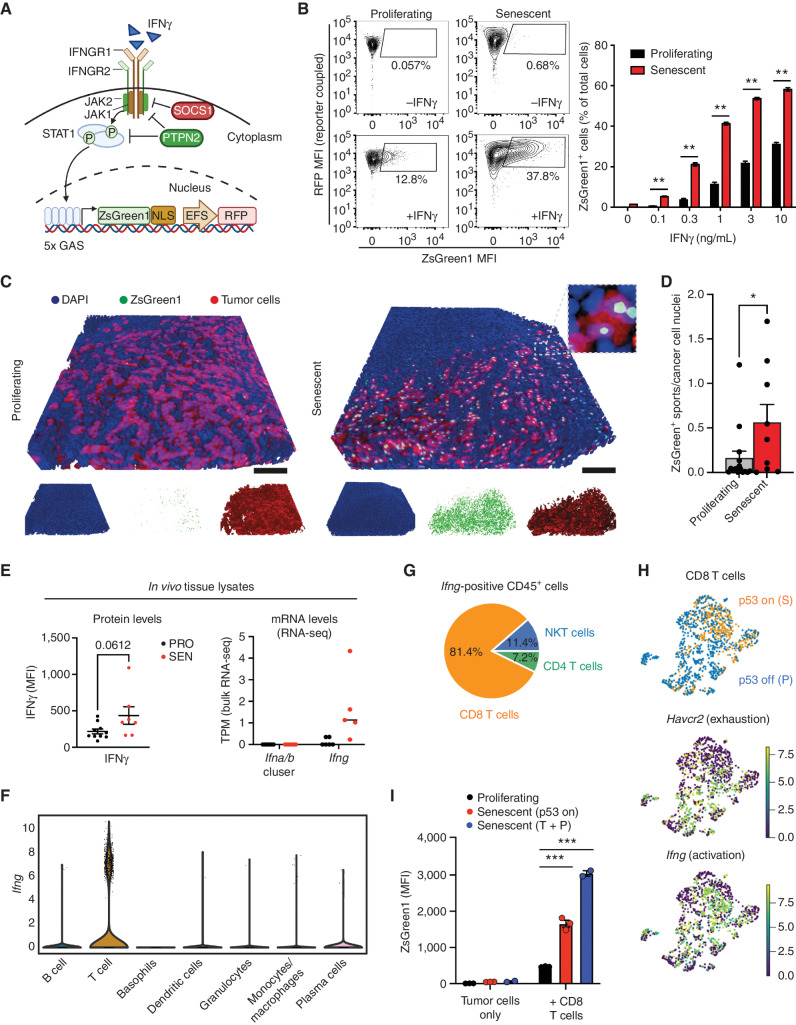
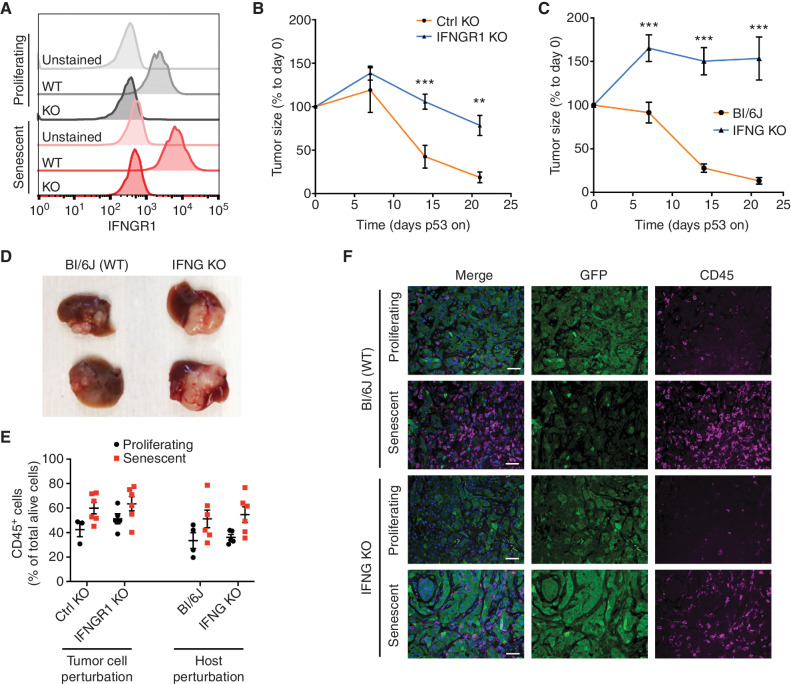
Cellular senescence involves a stable cell-cycle arrest coupled to a secretory program that, in some instances, stimulates the immune clearance of senescent cells. Using an immune-competent liver cancer model in which senescence triggers CD8 T cell-mediated tumor rejection, we show that senescence also remodels the cell-surface proteome to alter how tumor cells sense environmental factors, as exemplified by type II interferon (IFNγ). Compared with proliferating cells, senescent cells upregulate the IFNγ receptor, become hypersensitized to microenvironmental IFNγ, and more robustly induce the antigen-presenting machinery-effects also recapitulated in human tumor cells undergoing therapy-induced senescence. Disruption of IFNγ sensing in senescent cells blunts their immune-mediated clearance without disabling the senescence state or its characteristic secretory program. Our results demonstrate that senescent cells have an enhanced ability to both send and receive environmental signals and imply that each process is required for their effective immune surveillance.

Significance: Our work uncovers an interplay between tissue remodeling and tissue-sensing programs that can be engaged by senescence in advanced cancers to render tumor cells more visible to the adaptive immune system. This new facet of senescence establishes reciprocal heterotypic signaling interactions that can be induced therapeutically to enhance antitumor immunity. See related article by Marin et al., p. 410. This article is highlighted in the In This Issue feature, p. 247.


Conflict of interest statement

R. Mezzadra reports grants from the Cancer Research Institute and NWO (Dutch Research Council) during the conduct of the study. N. Bernstein reports former employment with Calico Labs, which is where he worked at the time he contributed to this article, as well as current employment with TenSixteen Bio. M. Egeblad reports personal fees from Insmed and Vividion Therapeutics, and other support from Agios outside the submitted work. D. Alonso-Curbelo reports nonfinancial support from Calico Life Sciences during the conduct of the study. S.W. Lowe reports grants from Calico Life Sciences and nonfinancial support from Calico Life Sciences during the conduct of the study, as well as the following relationships not directly related to this work: consulting for and equity in Oric Pharmaceuticals, Blueprint Medicines, Mirimus Inc., Senecea Therapeutics, Faeth Therapeutics, and PMV Pharmaceuticals. No disclosures were reported by the other authors.

Figures

Figure 1.
Figure 1.
A p53-restorable tumor model to study senescence immune surveillance. A, Generation of the p53-restorable, NRAS-driven mouse liver cancer model using the sleeping beauty transposon system delivered through HTVI. (Created with BioRender.com.) B, Representative ultrasonogram of HTVI and orthotopic injection liver cancer models at indicated time after p53 restoration. C, Survival analysis of mice in the HTVI model. D, Representative hematoxylin and eosin (H&E), immunofluorescence (IF), and senescence-associated β-galactosidase (SA-β-gal) staining of p53-suppressed (p53 off) and -restored (p53 on for 14 days) tumor sections generated from the HTVI model. Scale bars, 50 μm. E–G, Orthotopic injection of GFP-luciferase vector-transduced NSP tumor cells into the livers of immunocompetent and immunodeficient mouse strains. E, Tumor size change measured by ultrasound upon p53 restoration. R2G2, Rag2-Il2rg double-knockout mouse. Data are presented as mean ± SEM. n e 9 for each strain. F, Representative macroscopic pictures at 21 days of p53 on or endpoint p53 off tumor. G, Representative IHC staining of GFP-labeled tumor cells at day 21 upon p53 restoration. Scale bars, 100 μm. **, P < 0.01; ***, P < 0.001.
Figure 2.
Figure 2.
Senescence triggers an immune evasion-to-immune recognition tumor switch. A, Representative images of CD45 and GFP staining marking immune cells and tumor cells, respectively, in p53-suppressed and p53-restored tumor (7 days after p53 restoration). Right, the quantification of the area of CD45+ staining calculated from 3 random fields per mouse. Each dot represents a mouse. B, Flow cytometry analysis of the global immune landscape in an orthotopic NSP liver tumor model. Immunophenotyping of senescent tumors is performed 9 days after Dox withdrawal, a time point when the senescent state is fully established, yet preceding the massive tumor regression. G-MDSC, granulocytic myeloid-derived suppressor cells; M-MDSC, monocytic myeloid-derived suppressor cells. Data are pooled from 2 independent experiments, with n = 7 in the proliferating group and n = 9 in the senescent group. Note that, as the absolute number of CD45+ cells increases in senescent NSP tumor lesions (A), so do the total numbers of the indicated cell types. C, Flow cytometry analysis of CD8 T cells. Data are pooled from 2 independent experiments, with n = 11 in the proliferating and n = 10 in the senescent groups. Experiments were performed 9 days after Dox withdrawal. D, Representative tissue clearing images of the orthotopic NSP liver tumors. T cells, neutrophils, and vasculature are labeled by CD3, MPO, and CD31 staining, respectively. Samples were collected 9 days after Dox withdrawal. E, Tumor size change measured by ultrasound upon p53 restoration in mice after depleting specific immune cell types using antibodies or drugs. F, Left, uniform manifold approximation and projection (UMAP) plot of CD8 T cells isolated from p53-suppressed proliferating (PRO) and p53-reactivated senescent (SEN) tumors. Right, gene set enrichment analysis of T-cell exhaustion marker genes in CD8+ T cells from proliferating (p53-suppressed) versus senescent (p53-reactivated) tumors. NES, normalized enrichment score; Pval, P value. G, UMAP plot of the expression of selected genes (Cd8a, Cd44, Tnfrsf9, Cd69, Tox, and Fasl) between CD8 T cells isolated from senescent (p53-reactivated) and proliferating (p53-suppressed) tumors. H, Representative immunofluorescence images of CD8 T cells and F4/80-positive macrophage staining in the orthotopic NSP liver tumor. Tumor samples were collected 9 days after Dox withdrawal. Data are presented as mean ± SEM. All scale bars, 100 μm. A two-tailed Student t test was used. *, P < 0.05; **, P < 0.01.
Figure 3.
Figure 3.
Senescence remodels tissue-sensing programs and cell-surfaceome landscape. A, Gene set enrichment analysis (Reactome) of RNA-seq data from proliferating (PRO, p53 off) versus senescent (SEN, p53 on for 8 days) NSP liver tumor cells in vitro. NES, normalized enrichment score. B, Subcellular localization of DEGs (P < 0.05; fold change > 2) in all detected genes [transcripts per kilobase million (TPM) > 1] from RNA-seq. C, Gene ontology (GO) analysis of DEGs encoding PM proteins upregulated in senescent cells. TM, transmembrane. D, Transcriptomic analysis of all DEGs (proliferating vs. senescent) in the presence or absence of JQ1 treatment. The C1 cluster (in red) contains the senescence-specific genes sensitive to JQ1, and the C4 cluster (in blue) contains the proliferation-specific genes sensitive to JQ1. E, Meta-analysis of RNA-seq dataset from SENESCopedia by performing subcellular localization of DEGs (same as Fig. 2D) and Fisher exact test to examine the relative enrichment of upregulated and downregulated EC/PM-DEGs deviated from the random distribution. See also Supplementary Fig. S7E and S7F. F, Mass spectrometry (MS) analysis of PM-enriched proteome in proliferating and senescent cells. Protein level is normalized to mean expression of the protein of all samples. Controls are the samples without biotin labeling serving as background. Red and blue boxes represent proteins enriched in senescent and proliferating cells, respectively. n = 6 for both the senescent and proliferating experimental groups, and n = 3 and 4, respectively, for their control. G, Distribution of upregulated and downregulated GeneCards-annotated PM proteins profiled by MS. NC, no change. H, Volcano plot of GeneCards-annotated PM proteins profiled by MS.
Figure 4.
Figure 4.
Senescent cells are primed to sense and amplify IFNγ signaling. A and B, IFNGR1 level on proliferating and senescent cells profiled by mass spectrometry (A) and validated by flow cytometry (B). AU, arbitrary unit. Data are presented as mean ± SEM. n = 6 for both the proliferating and senescent groups. C, Transcriptomic analysis of selected genes regulating IFNγ signaling from RNA-seq data of 3 independent p53-restorable cell lines (NSP, NSM2, and NSP5) restoring p53 along with NSP cells treated with two other senescence triggers. SEN/PRO, senescent/proliferating; T + P, trametinib plus palbociclib. D, mRNA expression of selected genes involved in IFNγ signaling in human cell lines triggered to senesce. Treatment: Ali, alisertib; Eto, etoposide; number indicates the length of treatment (days). Data are obtained from the public dataset SENESCopedia (44). E, Top, immunoblot analysis of NSP cells under different senescent triggers in the presence or absence of IFNγ (1 ng/mL). Bottom, quantification of the intensity of signal from immunoblot. p-STAT1, phospho-STAT1 (Tyr701).
Figure 5.
Figure 5.
Senescence and EC IFNγ cooperate to upregulate antigen processing and presentation machinery. A and B, mRNA expression of genes in proliferating and senescent NSP cells in vitro in the presence or absence of IFNγ (50 pg/mL) treatment. mRNA level is normalized to the mean expression of the gene in all samples. A, DEG-encoding SASP factors in our model. B, IFNγ response genes from the Hallmark signature database. C, RT-qPCR of selected antigen presentation pathway genes in proliferating and senescent cells treated with low (50 pg/mL) or high (1 ng/mL) concentration of IFNγ. Samples are from 2 biological replicates. D, MHC-I level of proliferating and senescent cells treated with IFNγ for 24 hours measured by flow cytometry. MFI, median fluorescence intensity. Data are presented as mean ± SEM.
Figure 6.
Figure 6.
Senescence enhances IFNγ-mediated heterotypic signaling from activated immune cells to tumor cells. A, Graphic illustration of the IGS reporter. (Created with BioRender.com.) B, Left, representative flow cytometry plots measuring ZsGreen1 signals in proliferating and senescent NSP cells treated with 1 ng/mL IFNγ. Right, quantification of the percentage of ZsGreen1-positive cells upon IFNγ treatment. MFI, median fluorescence intensity. C and D, Representative 3D imaging of tissue-cleared tumors from the orthotopically injected liver NSP cell line expressing IGS reporter (C). Quantification of 3 randomly selected fields from the liver tumor of each mouse (D). n = 5 and n = 3 for the proliferating and senescent groups (9 days after p53 restoration), respectively. Scale bars, 100 μm. E, Top, cytometric bead array assay for the IFNγ level from in vivo tumor tissue lysate samples (7 days after p53 restoration). Bottom, transcripts of indicated genes from RNA-seq of in vivo bulk samples of tumors generated by HTVI (PRO, p53 off; SEN, p53 restoration for 12 days). TPM, transcripts per kilobase million. Noted Ifna/b cluster contains 14 Ifna subtypes and 1 Ifnb gene. F and G, Expression of Ifng in tumor-infiltrating immune cells profiled by scRNA-seq in the NSP transplantable model (as in Fig. 2, sample collected at day 8 after p53 restoration). H, Uniform manifold approximation and projection plot of the expression of Havcr2 (encoding TIM3) and Ifng in CD8 T cells harvested from proliferating (P) and senescent (S) tumor lesion. Top panel is replicated from Fig. 2F (left) to indicate cells corresponding to each condition. I, Quantification of ZsGreen1 intensity of NSP tumor cells in the OT-I T-cell and SIINFEKL-expressing tumor cell coculture experiment (effector-to-target ratio, 5:1) after 20 hours of coculture. Signal measured by flow cytometry. T + P, trametinib plus palbociclib. See experimental details in Supplementary Fig. S12E. Data are presented as mean ± SEM. Two-tailed Student t test was used. *, P < 0.05; **, P < 0.01; ***, P < 0.001.
Figure 7.
Figure 7.
IFNγ signaling in senescent tumor cells is necessary for immune surveillance. A,Ifngr1 KO of both proliferating and senescent NSP cells validated by flow cytometry. B, Tumor regression phenotype of Ifngr1 KO or control sgRNA–transfected tumor cells orthotopically injected into Bl/6N mice upon p53 restoration. A control sgRNA targeting a gene desert located on Chr8 (Ctrl KO) serves as a control. C, Tumor regression phenotype of parental NSP tumor cells orthotopically injected into WT or Ifng KO mice upon p53 restoration. D, Representative macroscopic images of tumor collected at day 21 after p53 restoration from C. E, Flow cytometry analysis of CD45 abundance in tumor from indicated groups. F, Representative immunofluorescence in p53-suppressed (proliferating) and p53-restored (senescent, 7 days after p53 restoration) tumor from the indicated host. NSP tumor cells were transduced with GFP-expressing vector for visualization. Scale bars, 50 μm. Data are presented as mean ± SEM. Two-tailed Student t test was used. **, P < 0.01; ***, P < 0.001.

Comment in

Comment on

  • Cellular Senescence Is Immunogenic and Promotes Antitumor Immunity.
    Marin I, Boix O, Garcia-Garijo A, Sirois I, Caballe A, Zarzuela E, Ruano I, Attolini CS, Prats N, López-Domínguez JA, Kovatcheva M, Garralda E, Muñoz J, Caron E, Abad M, Gros A, Pietrocola F, Serrano M. Marin I, et al. Cancer Discov. 2023 Feb 6;13(2):410-431. doi: 10.1158/2159-8290.CD-22-0523. Cancer Discov. 2023. PMID: 36302218 Free PMC article.

References

    1. Di Micco R, Krizhanovsky V, Baker D, d'Adda di Fagagna F. Cellular senescence in ageing: from mechanisms to therapeutic opportunities. Nat Rev Mol Cell Biol 2021;22:75–95. - PMC - PubMed
    1. Munoz-Espin D, Serrano M. Cellular senescence: from physiology to pathology. Nat Rev Mol Cell Biol 2014;15:482–96. - PubMed
    1. Demaria M, Ohtani N, Youssef SA, Rodier F, Toussaint W, Mitchell JR, et al. . An essential role for senescent cells in optimal wound healing through secretion of PDGF-AA. Dev Cell 2014;31:722–33. - PMC - PubMed
    1. Xu M, Pirtskhalava T, Farr JN, Weigand BM, Palmer AK, Weivoda MM, et al. . Senolytics improve physical function and increase lifespan in old age. Nat Med 2018;24:1246–56. - PMC - PubMed
    1. Serrano M, Lin AW, McCurrach ME, Beach D, Lowe SW. Oncogenic Ras provokes premature cell senescence associated with accumulation of p53 and p16INK4a. Cell 1997;88:593–602. - PubMed

Substances