. 2022 Nov 10;185(23):4317-4332.e15.
doi: 10.1016/j.cell.2022.10.006. Epub 2022 Oct 26.

Systemic vaccination induces CD8+ T cells and remodels the tumor microenvironment

Affiliations

Systemic vaccination induces CD8+ T cells and remodels the tumor microenvironment

Faezzah Baharom et al. Cell. .

Abstract

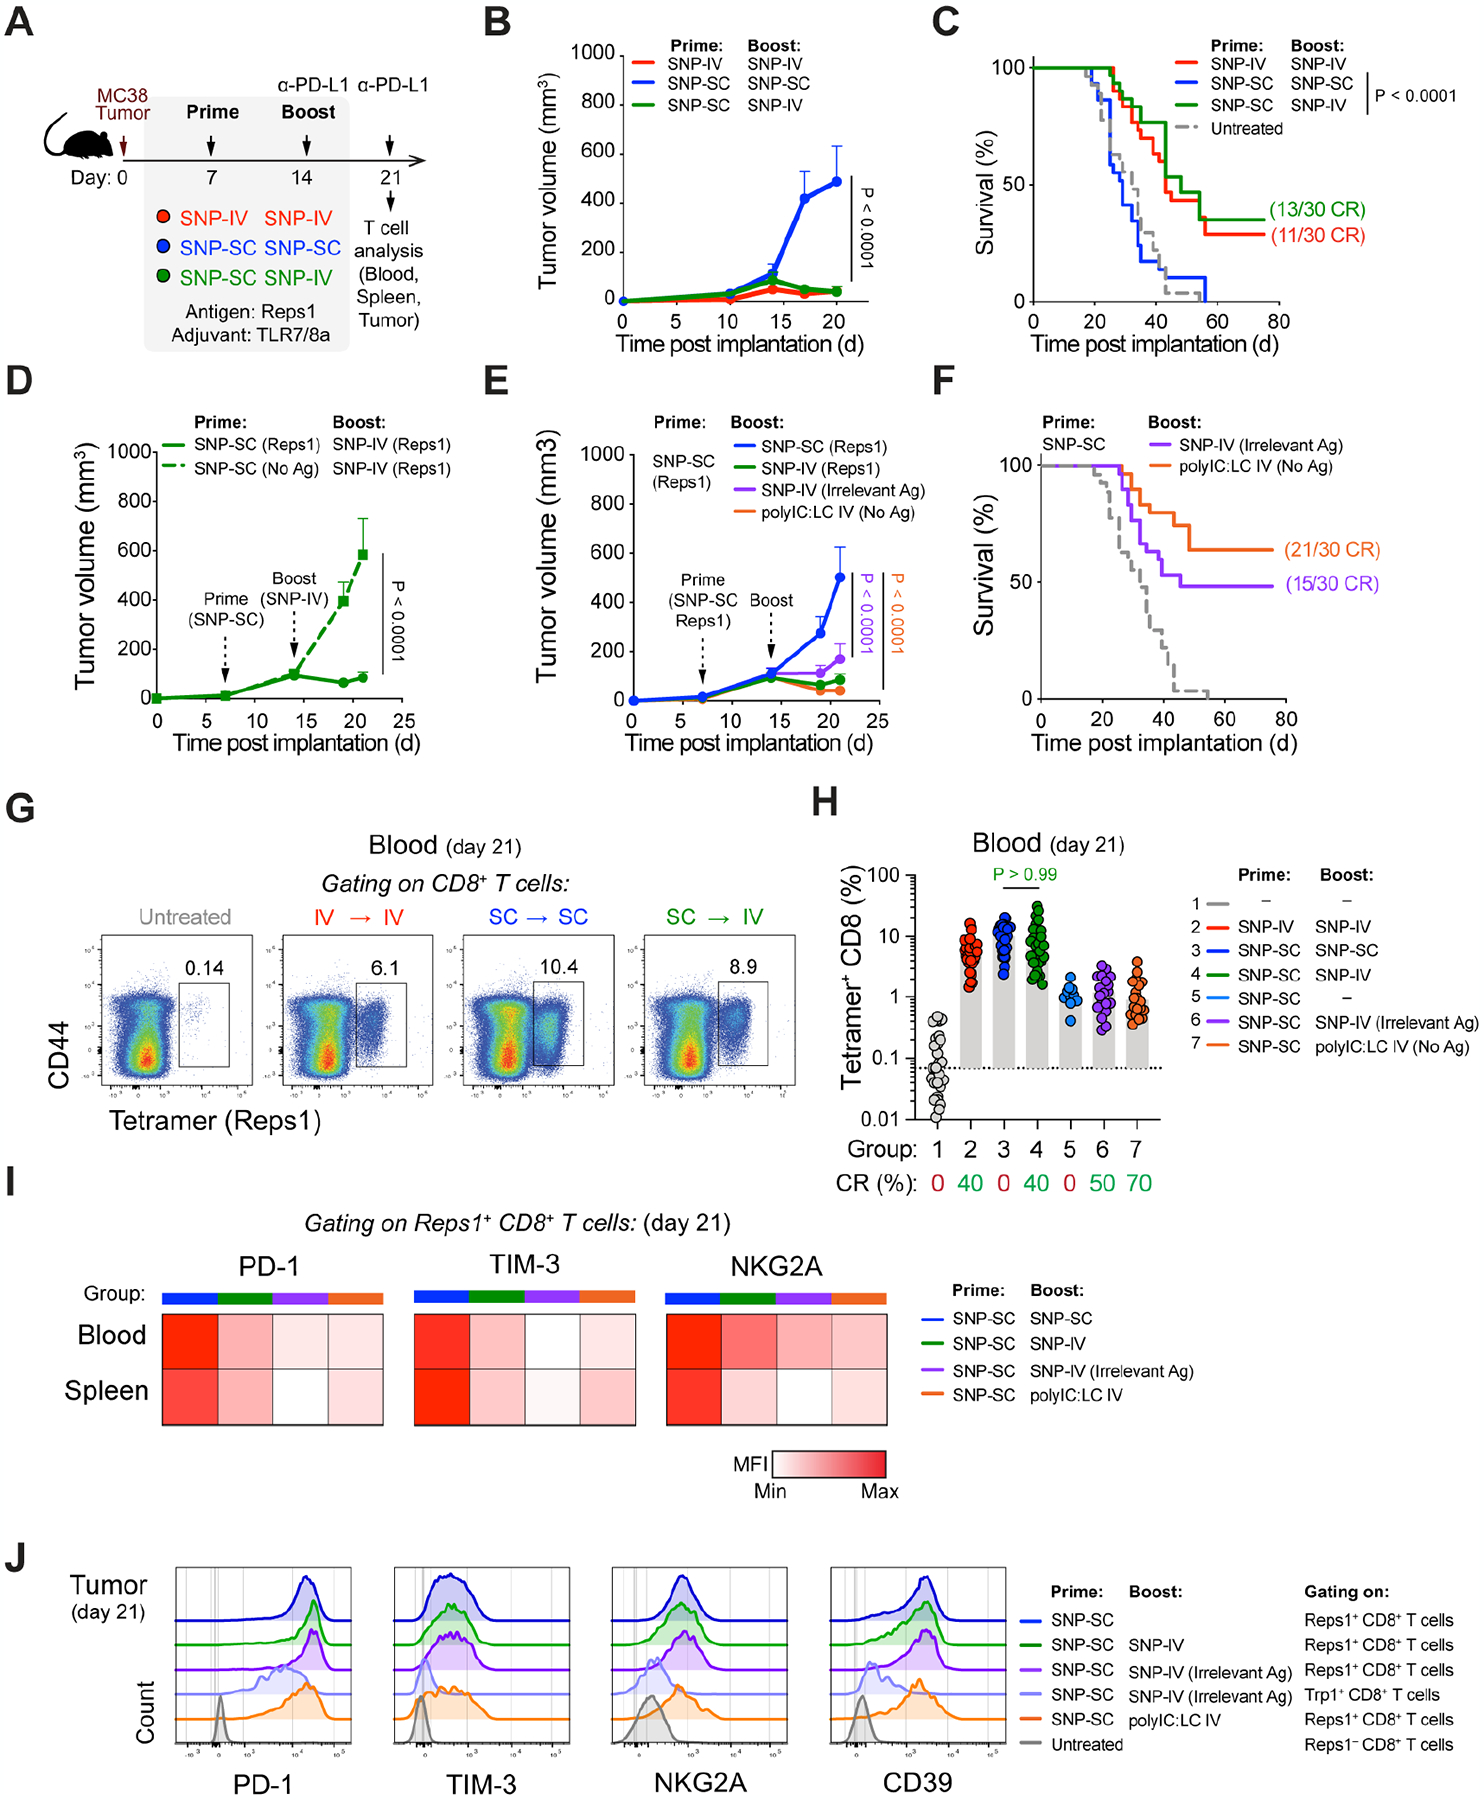
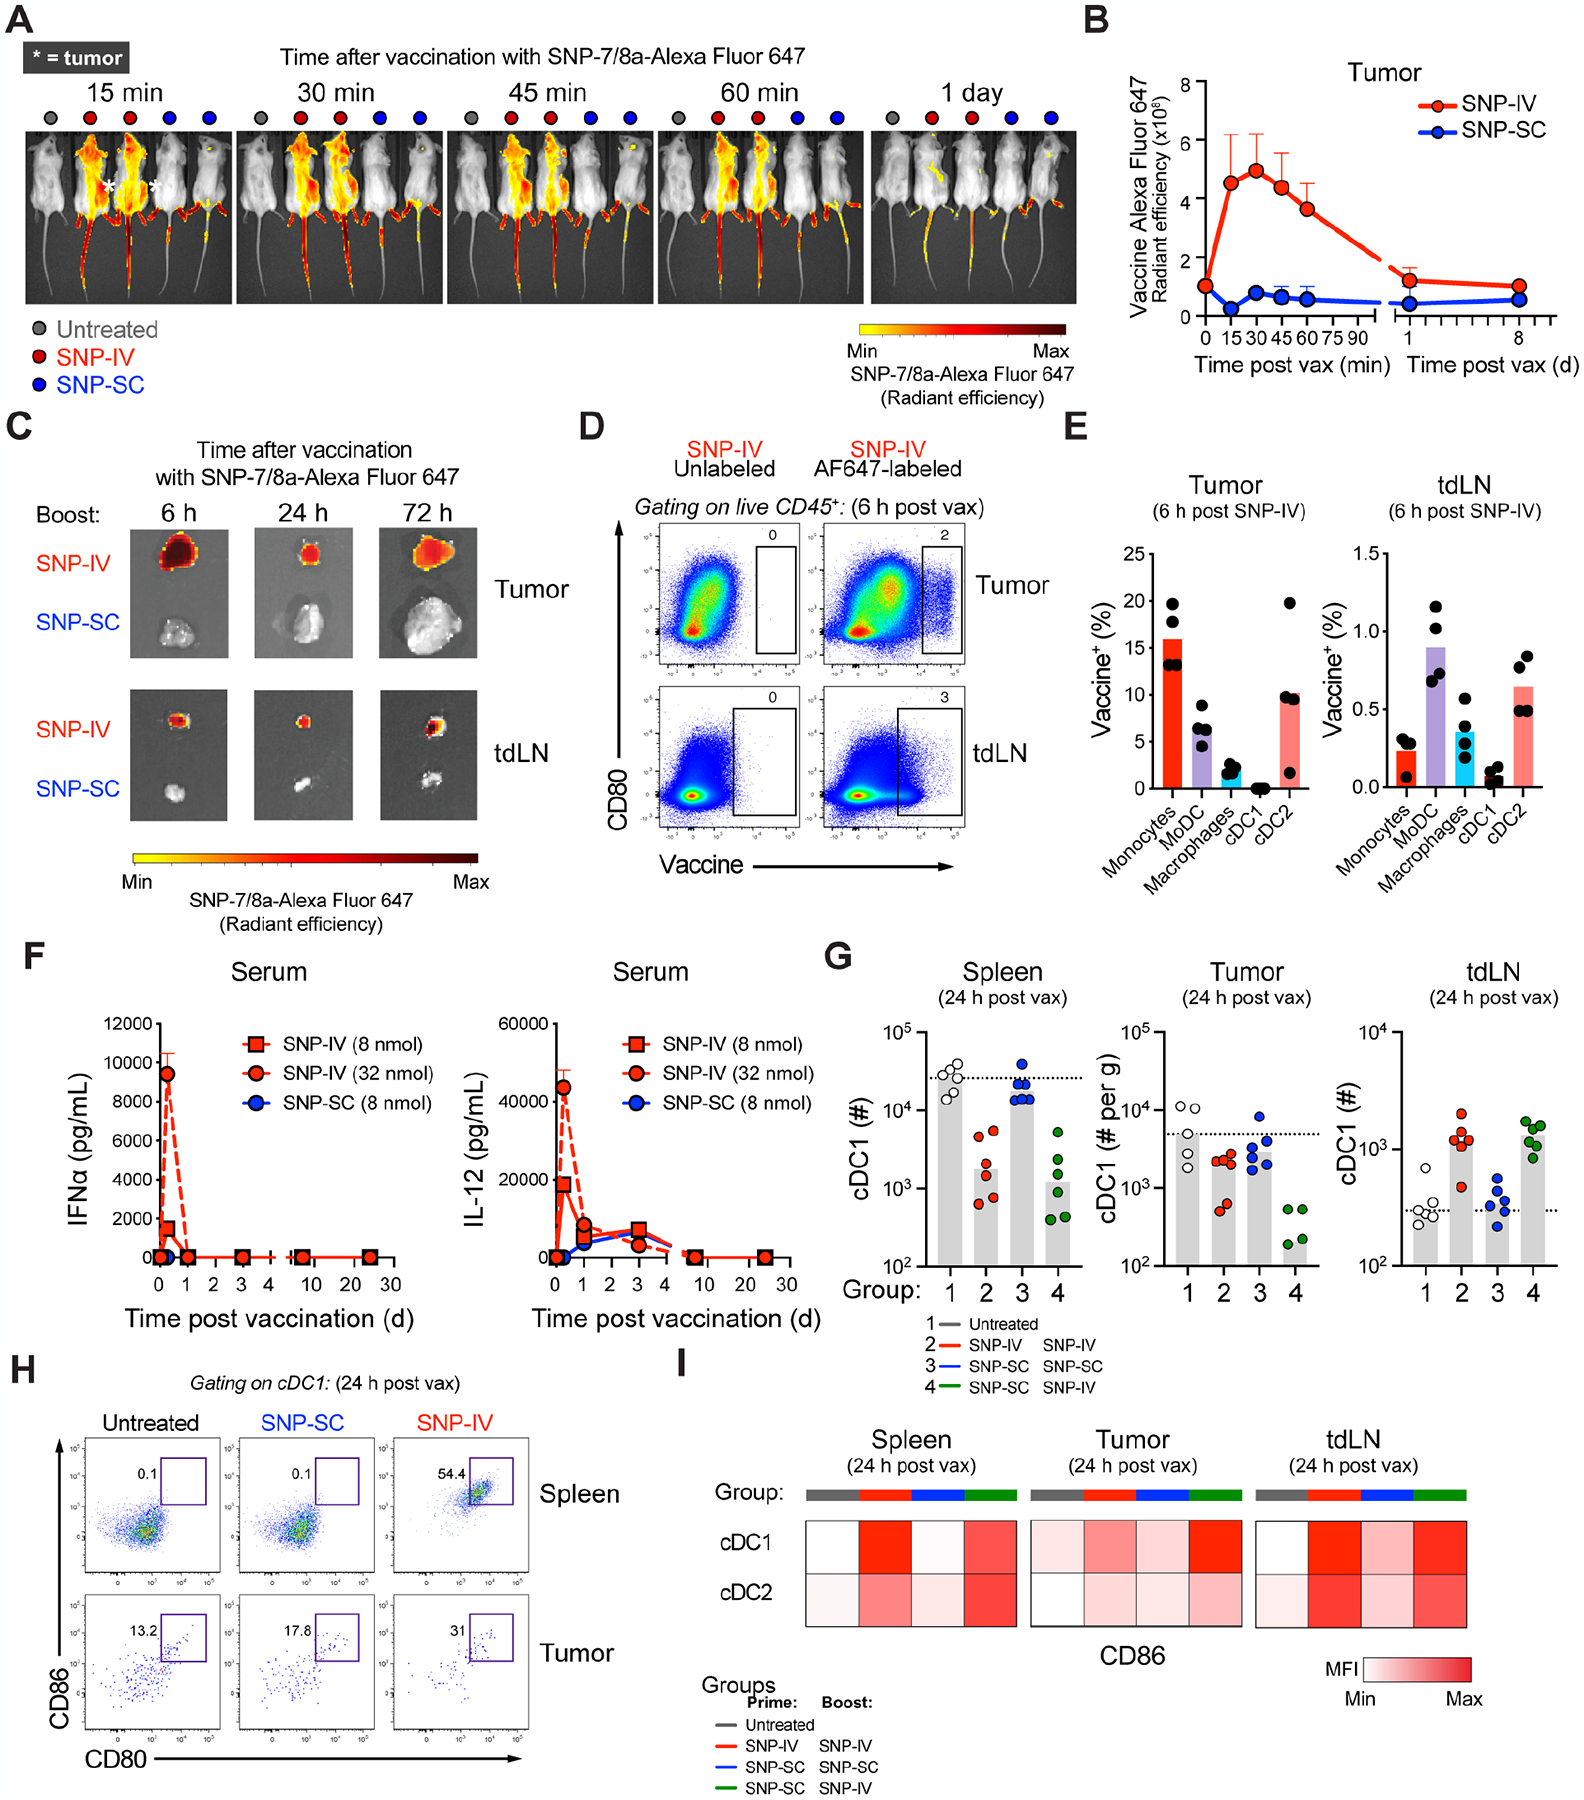
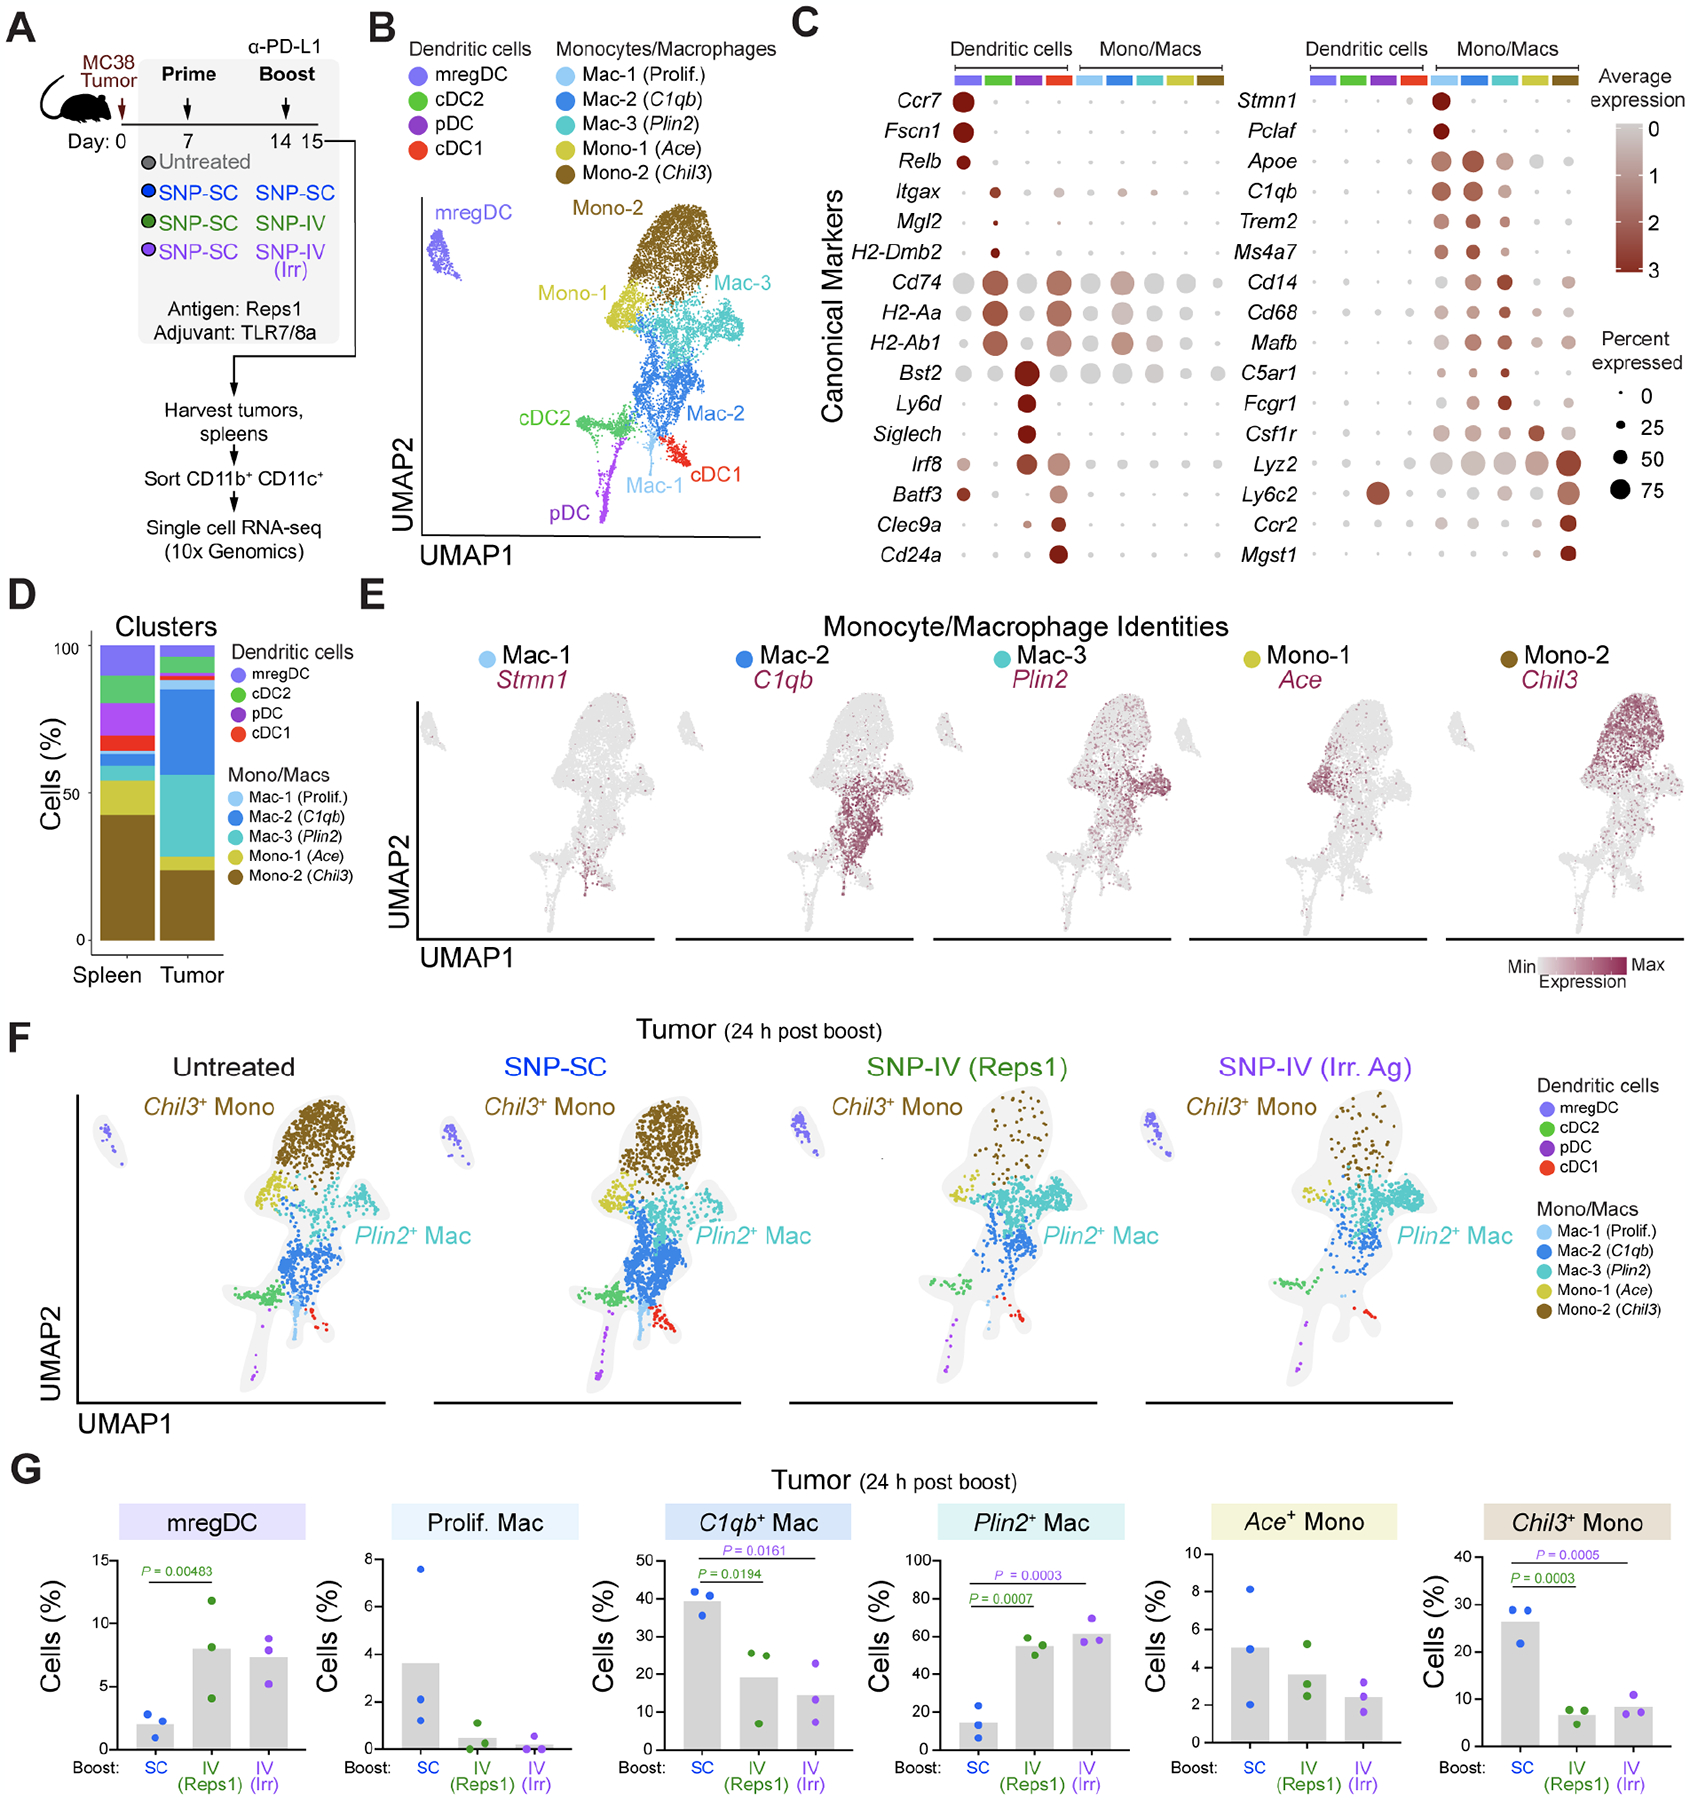
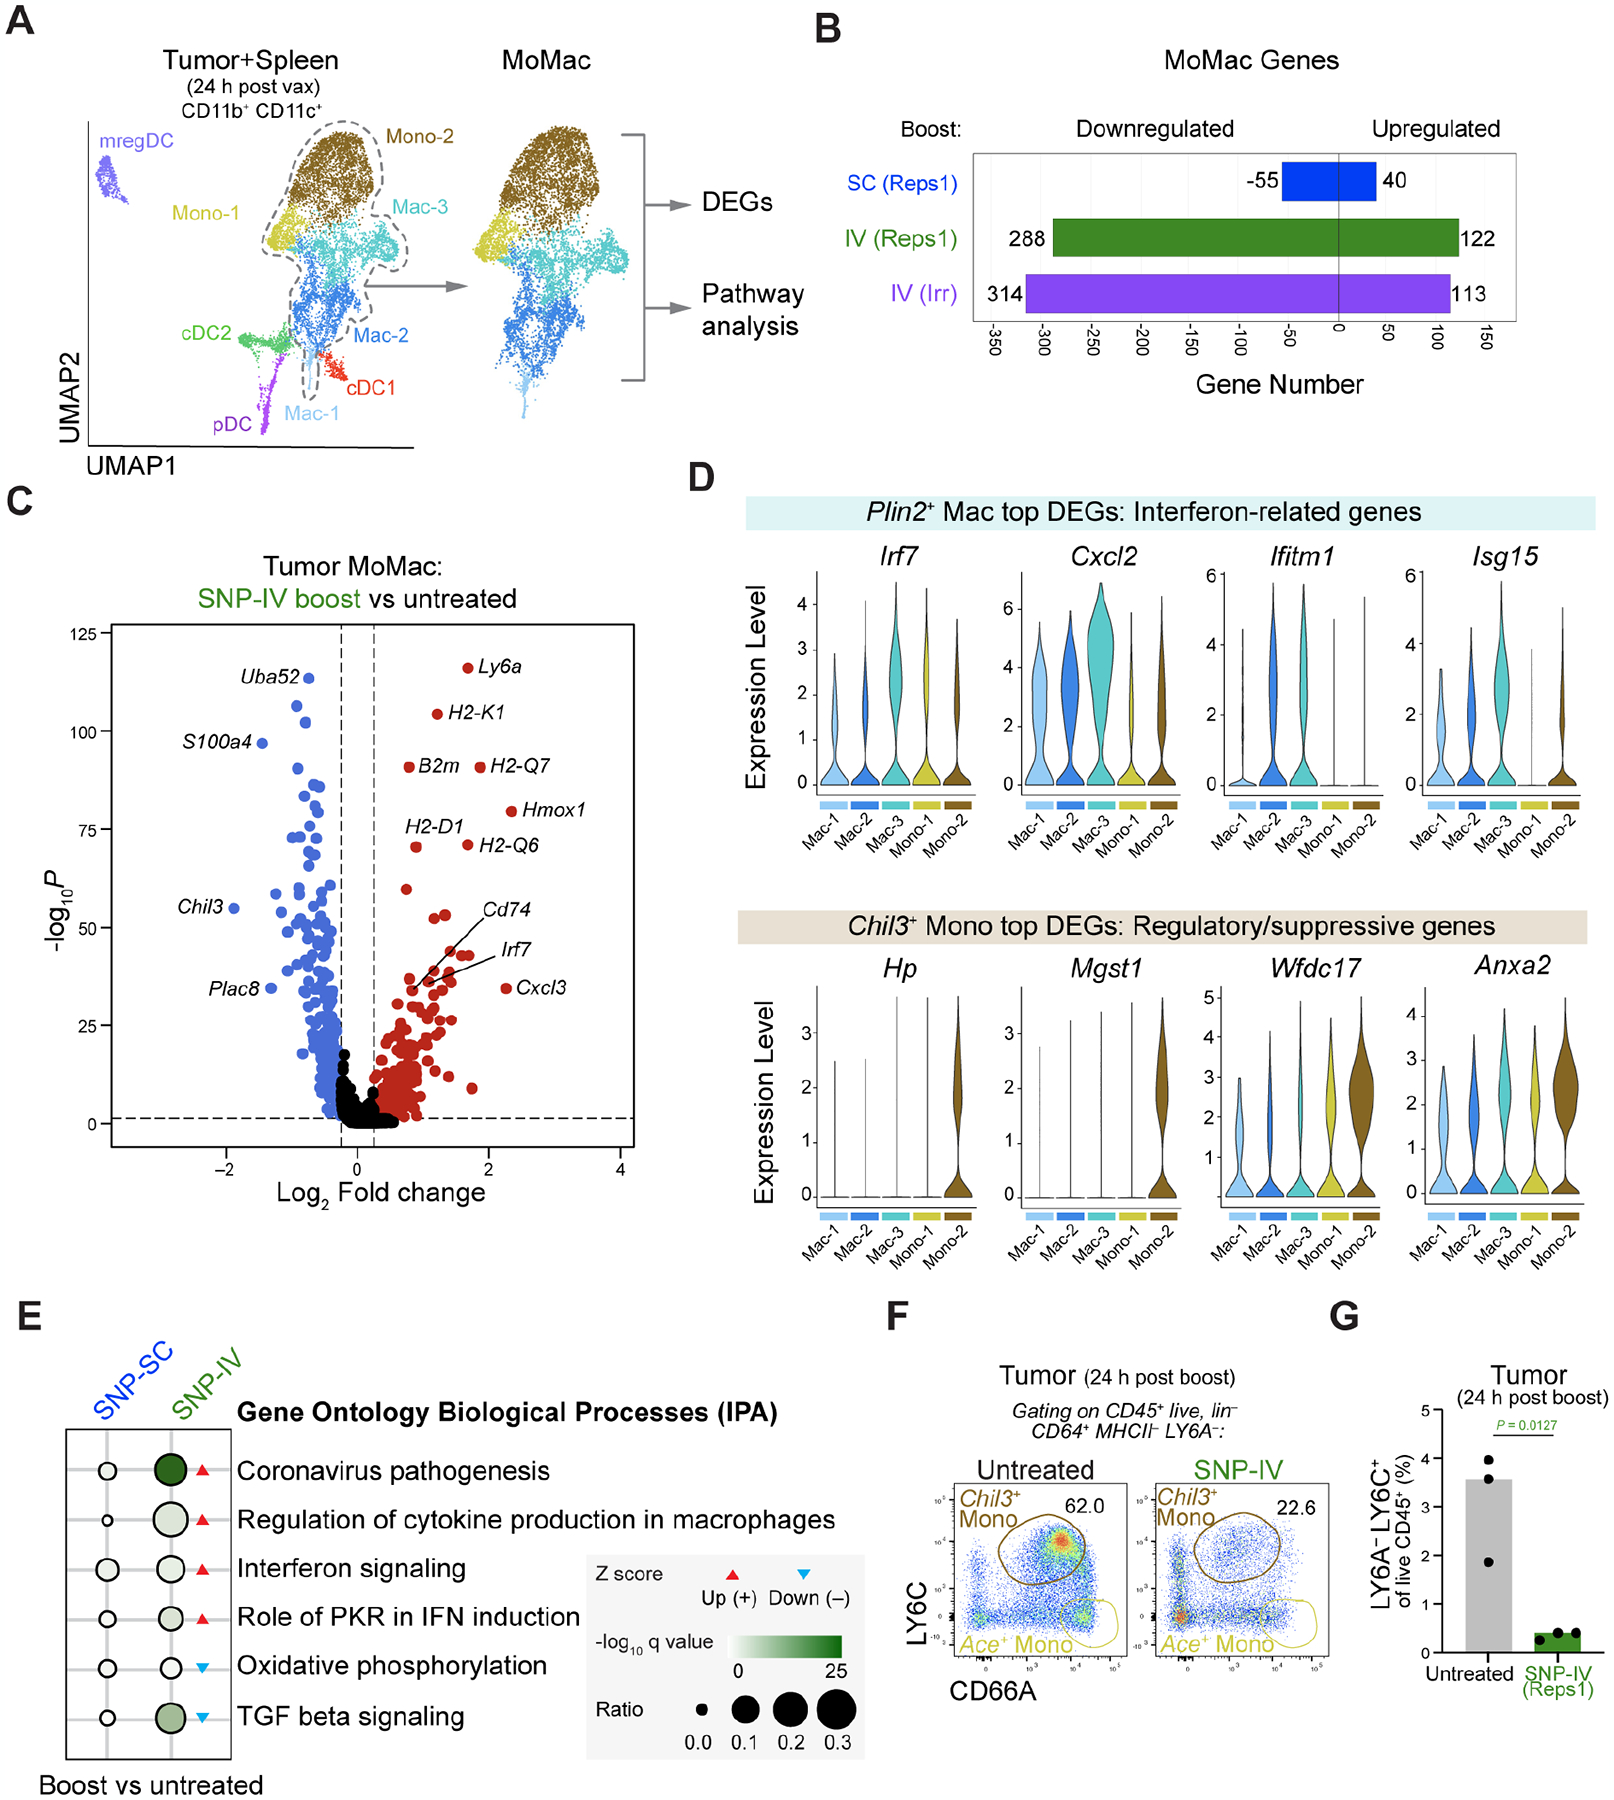
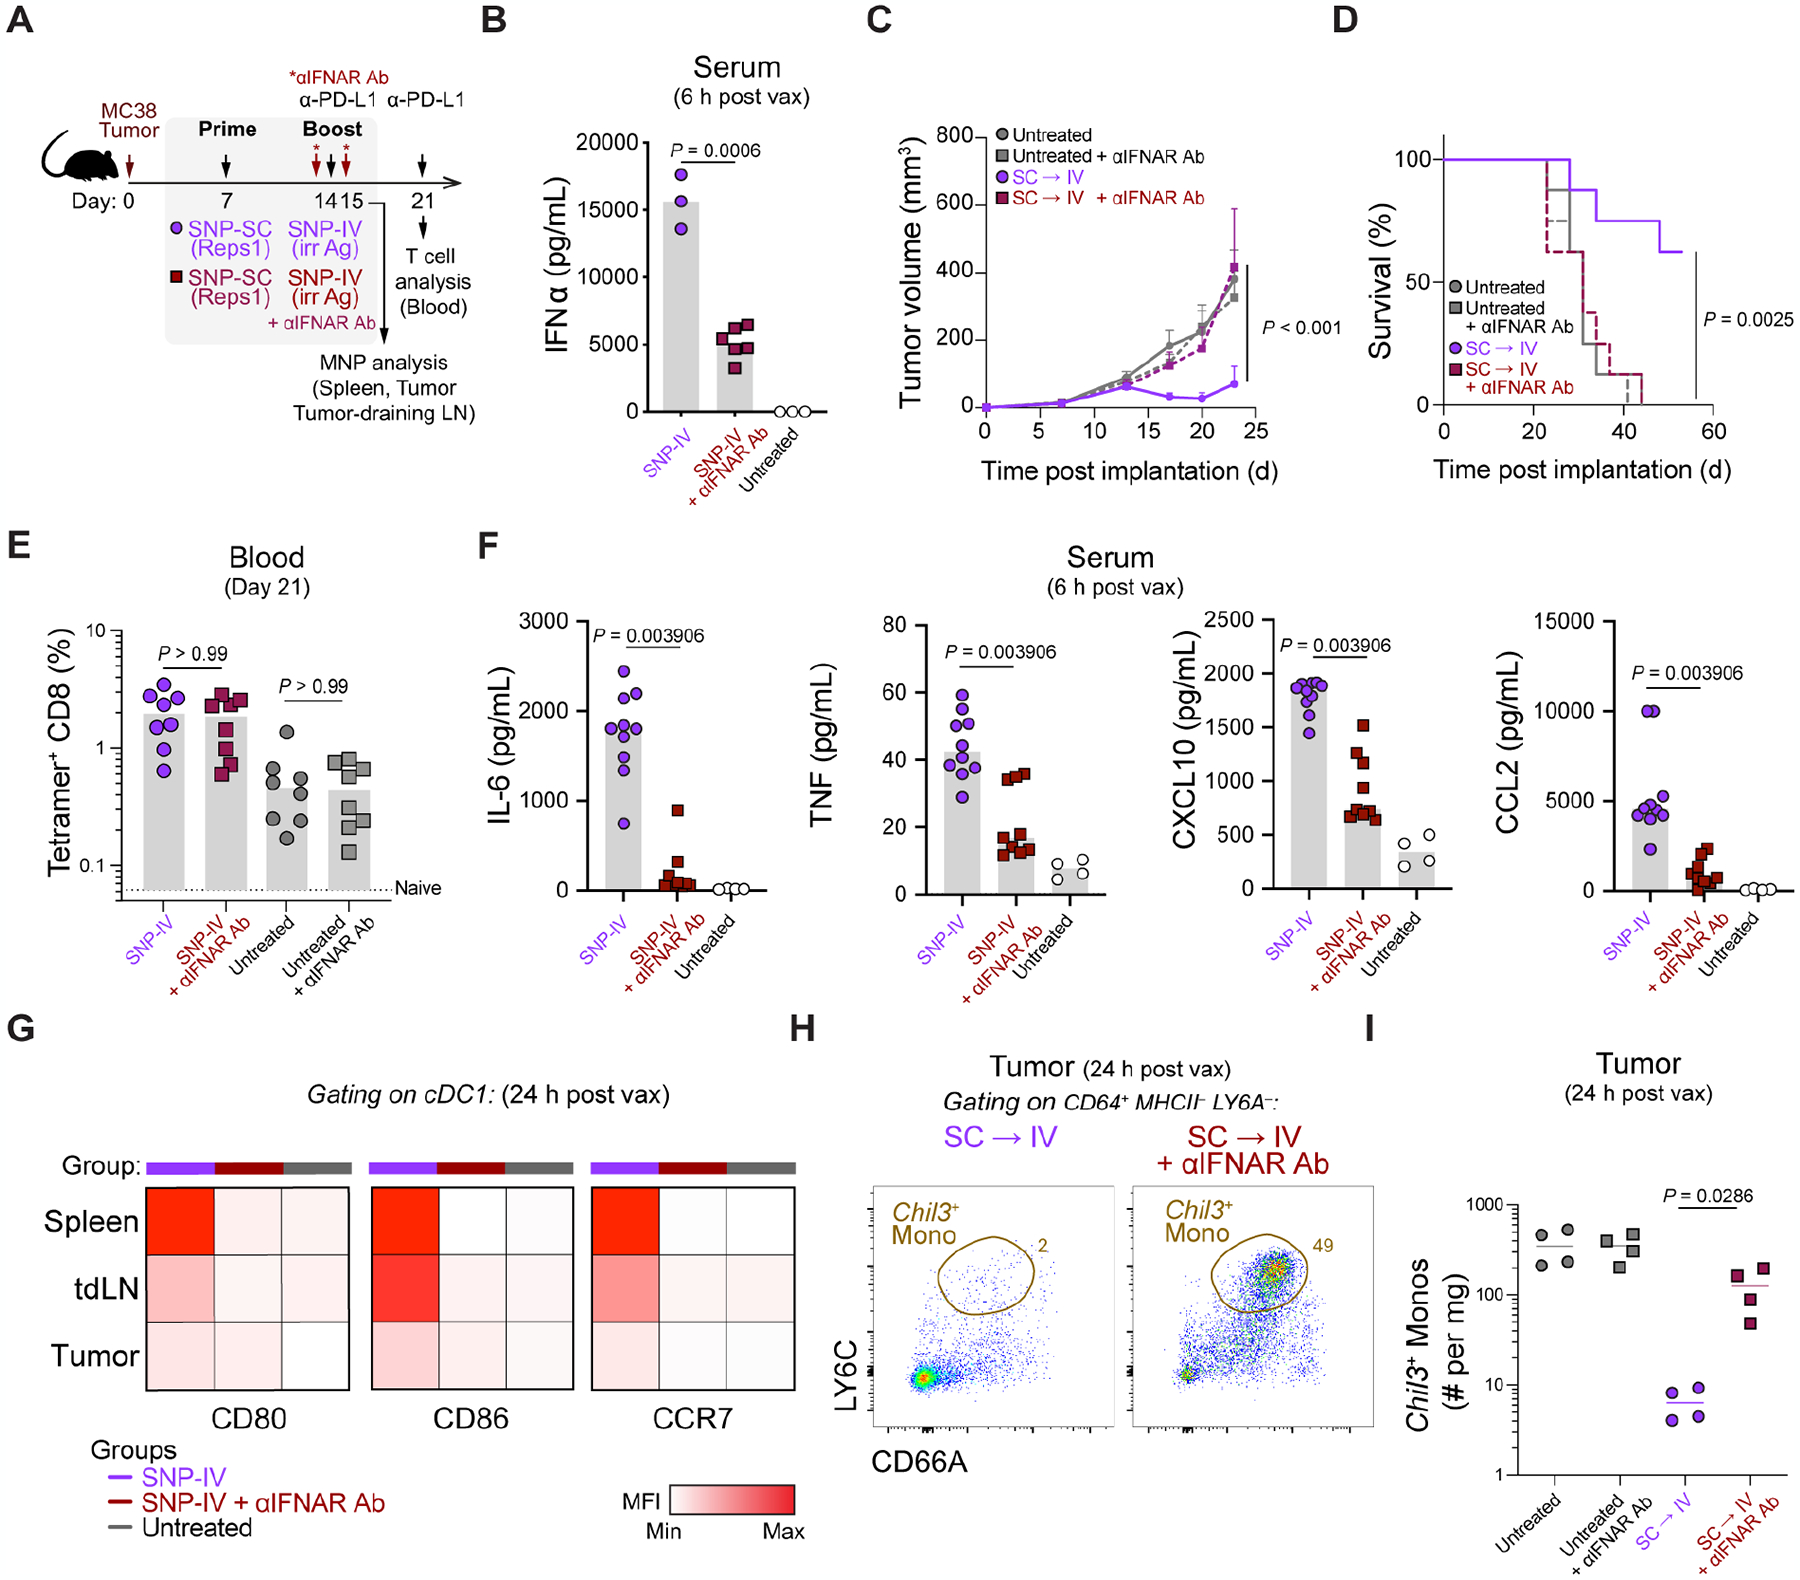
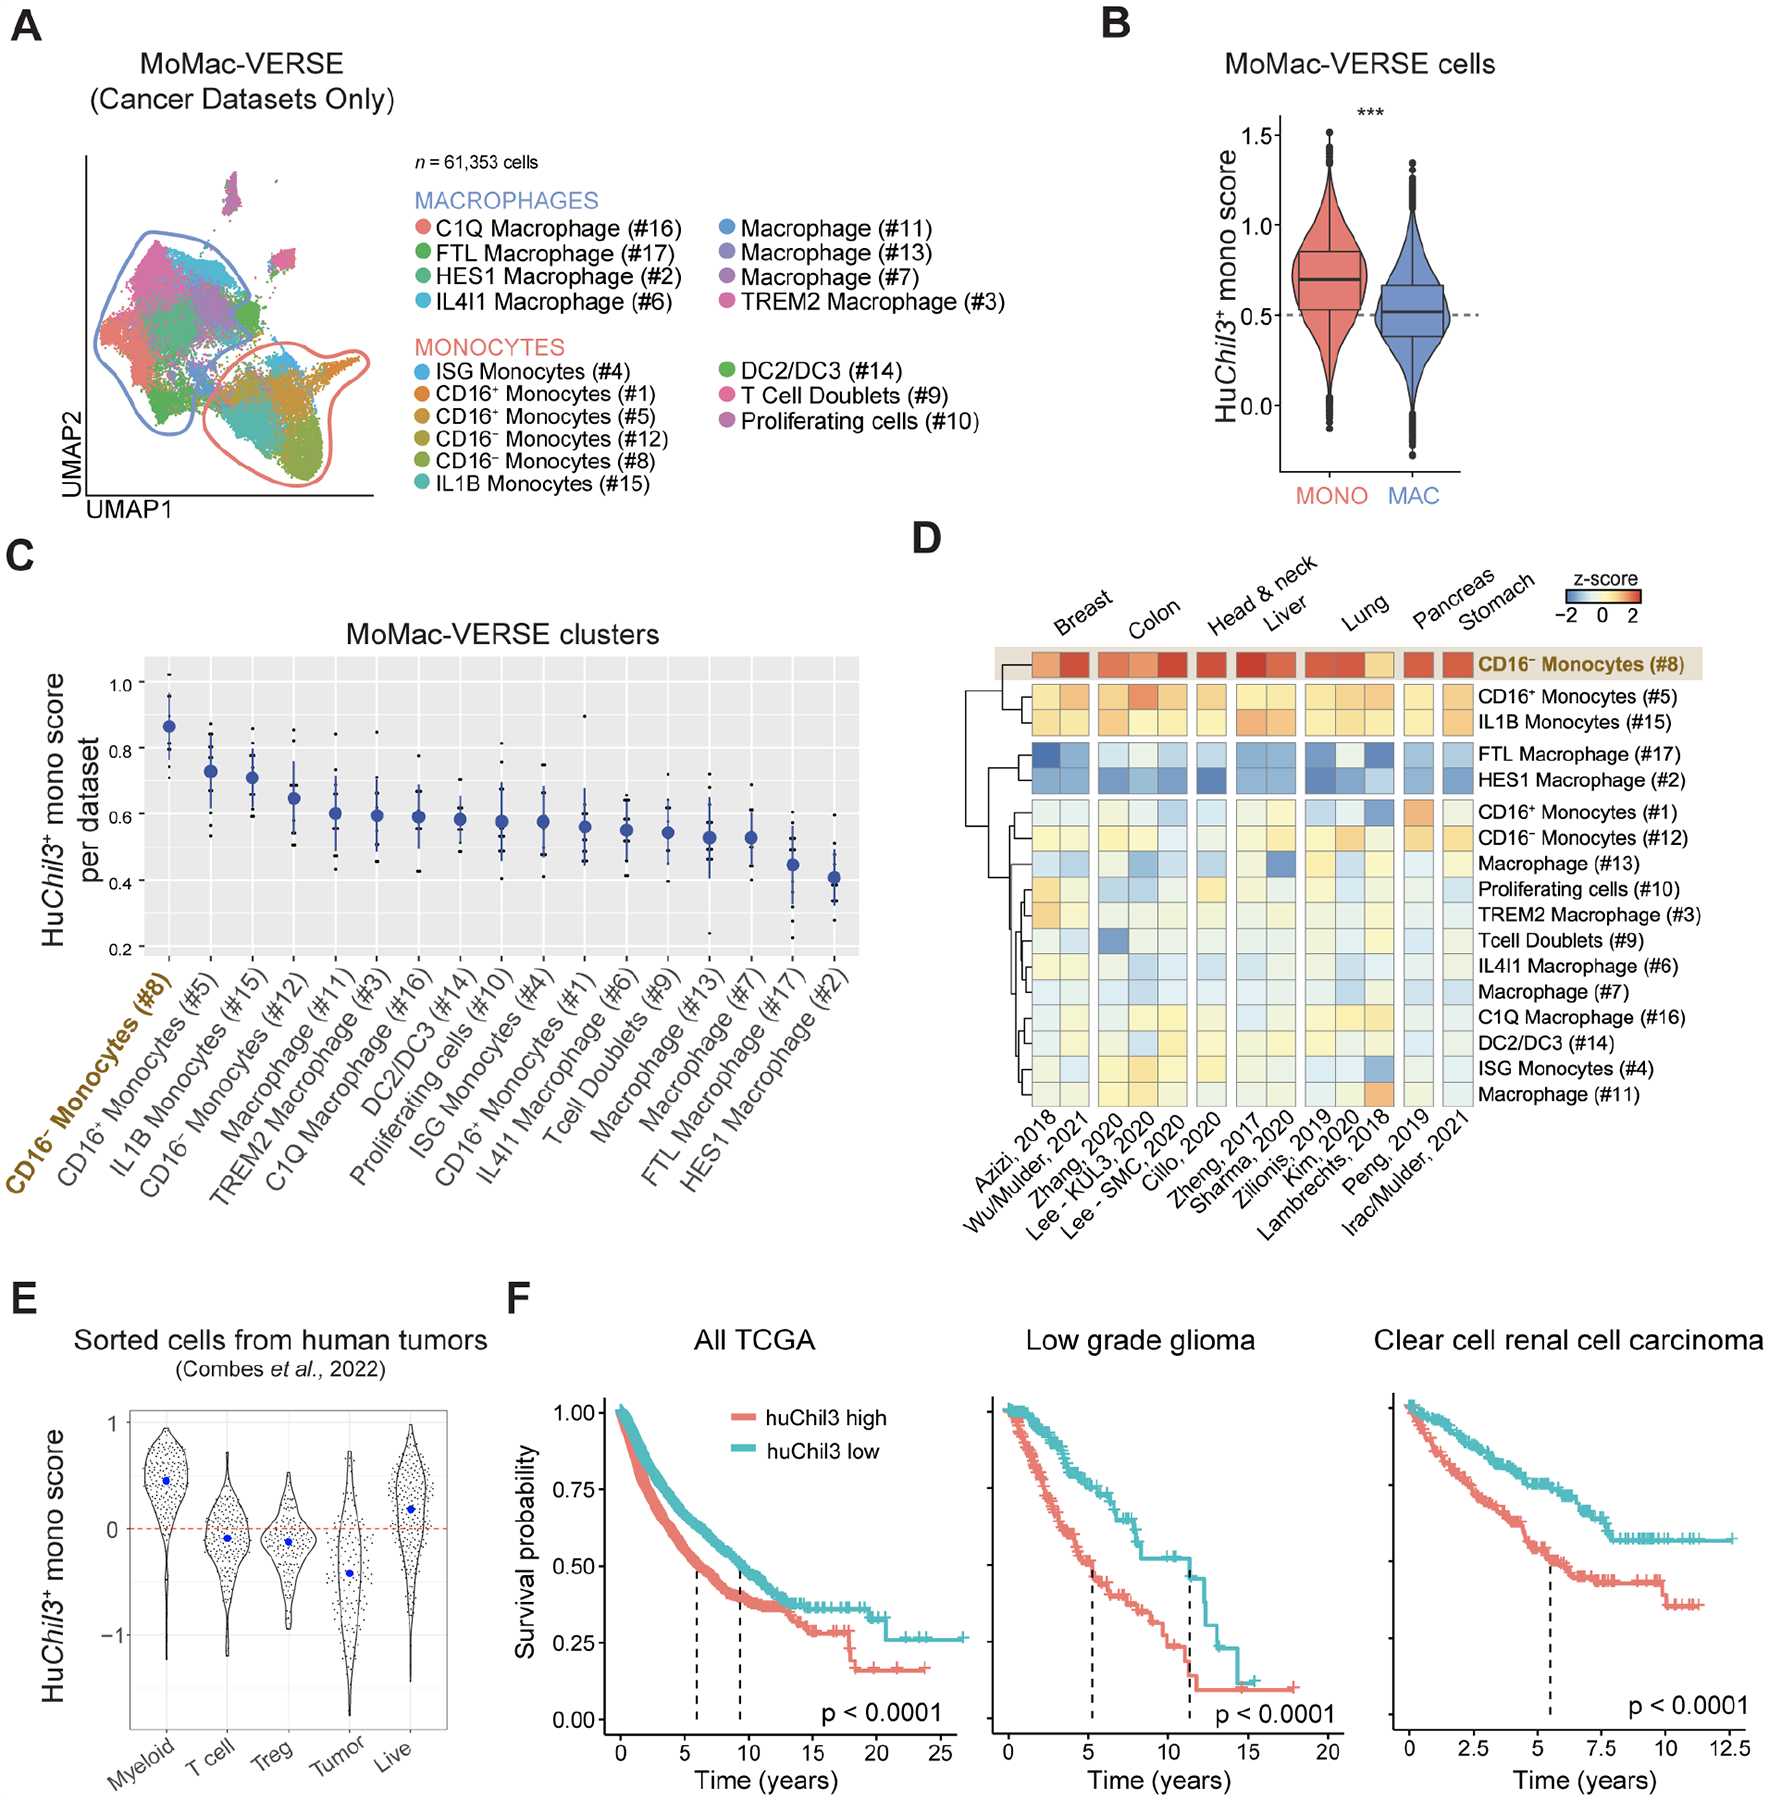
Therapeutic cancer vaccines are designed to increase tumor-specific T cell immunity. However, suppressive mechanisms within the tumor microenvironment (TME) may limit T cell function. Here, we assessed how the route of vaccination alters intratumoral myeloid cells. Using a self-assembling nanoparticle vaccine that links tumor antigen peptides to a Toll-like receptor 7/8 agonist (SNP-7/8a), we treated tumor-bearing mice subcutaneously (SNP-SC) or intravenously (SNP-IV). Both routes generated antigen-specific CD8+ T cells that infiltrated tumors. However, only SNP-IV mediated tumor regression, dependent on systemic type I interferon at the time of boost. Single-cell RNA-sequencing revealed that intratumoral monocytes expressing an immunoregulatory gene signature (Chil3, Anxa2, Wfdc17) were reduced after SNP-IV boost. In humans, the Chil3+ monocyte gene signature is enriched in CD16- monocytes and associated with worse outcomes. Our results show that the generation of tumor-specific CD8+ T cells combined with remodeling of the TME is a promising approach for tumor immunotherapy.


Conflict of interest statement

Declaration of interests A.S.I., G.M.L., and R.A.S. are listed as inventors on patents describing polymer-based vaccines. A.S.I. and G.M.L. are employees of Vaccitech North America, which is commercializing polymer-based drug delivery technologies for immunotherapeutic applications. F.B. and S.M. are employees of Genentech, a member of the Roche group, which develops and markets drugs for profit.

Figures

Figure 1.
Figure 1.. Tumor-specific CD8+ T cells generated by SNP-SC controlled tumor growth when followed by IV adjuvant delivery
(A) Schematic of therapeutic study design. Mice were implanted with MC38 and treated with SNP-7/8a (Reps1) on day 7 and day 14 together with CPI. (B) Tumor growth following treatment with SNP-IV prime and boost (red), SNP-SC prime and boost (blue) or SNP-SC prime and SNP-IV boost (green) (n=10). Statistics were assessed by two-way ANOVA. (C) Survival curve following treatment or in untreated mice (grey) (n=30). Statistics were assessed by log-rank test. (D) Tumor growth following treatment with SNP-SC prime with Reps1 (solid line) or an irrelevant antigen (dashed line) (n=10). Statistics were assessed by two-way ANOVA. (E) Tumor growth following treatment SNP-SC prime (Reps1) followed by SNP-IV boost containing an irrelevant antigen (purple) or polyIC:LC (orange) (n=10). Statistics were assessed by two-way ANOVA. (F) Survival curve following SNP-IV boost containing an irrelevant antigen (purple) or polyIC:LC (orange) or untreated (grey) (n=30). Statistics were assessed by log-rank test. (G) Flow cytometry analysis of blood stained with tetramer and CD44 antibody (concatenated, n=10). (H) Bar graph summarizes the frequency of tetramer+ CD8 T cells in blood after treatment (n=30). Statistics were assessed by Kruskal Wallis test. (I) Heatmaps represent the median MFI of PD-1, Tim-3 and NKG2A on tetramer+ CD8+ T cells in blood (n=10) and spleens (n=5) on day 21. (J) Histograms summarize the MFI PD-1, Tim-3 and NKG2A and CD39 on CD8+ T cells in tumors (n=5) on day 21.
Figure 2.
Figure 2.. SNP-IV but not SNP-SC resulted in intratumoral vaccine distribution and DC maturation
(A) In vivo imaging of mice following vaccination with fluorescently-labeled SNP-7/8a (n=4). (B) Fluorescence radiant efficiency over time after fluorescently-labeled SNP-SC or SNP-IV gating on tumor as the region of interest (ROI) (n=4). (C) Harvested tumor (top) and tumor-draining LNs (bottom) after SNP-IV or SNP-SC over time (n=2). (D) Flow cytometry analysis of fluorescently-labeled SNP-7/8a and CD80 in tumor (top) and tumor-draining LN (n=4). (E) Bar graphs summarize the frequency of myeloid cell populations of total vaccine+ cells in tumor (left) or tumor-draining LN (right) (n=4). (F) Measurement of cytokines IFNα (left) and IL-12 (right) in sera of mice after SNP-SC or SNP-IV at 8 nmol and 32 nmol (n=3). (G) Bar graphs summarize the numbers of cDC1 in spleen (left), tumor (middle) and tumor-draining LN (right) of mice that were untreated (white) or treated with SNP-IV prime and boost (red), SNP-SC prime and boost (blue) or SNP-SC prime followed by SNP-IV boost (green) (n=4–6). (H) Flow cytometry analysis of cDC1s 24 h after SNP-SC or SNP-IV vaccination in the spleen (top) and tumor (bottom) (n=6). (I) Heatmaps represent the median MFI of CD86 after SNP-IV prime and boost (red), SNP-SC prime and boost (blue) or SNP-SC prime followed by SNP-IV boost (n=6).
Figure 3.
Figure 3.. scRNA-seq of tumors revealed that intratumoral Chil3+ monocytes were significantly reduced after SNP-IV
(A) Schematic of therapeutic study design. Mice (n=3) were implanted with MC38 and treated with SNP-7/8a (Reps1) on day 7 and day 14 together with CPI. Spleens and tumors were harvested on day 15. scRNA-seq was performed on flow sorted myeloid cells. (B) UMAP of total monocytes, macrophages and DCs identified as 9 metaclusters in spleen and tumor on day 15. (C) Dot plot of canonical markers identifying specific DC, monocyte and macrophage subsets. (D) Bar graph shows proportion of individual metaclusters identified in spleen or tumor. (E) Feature plots highlight individual genes C1qb, Plin2, Ace and Chil3 used to annotate monocyte/macrophage clusters. (F) UMAPs of tumor MNP in untreated mice or mice treated with SNP-SC prime followed by SNP-SC boost (blue), SNP-IV (Reps1) boost (green) or SNP-IV (irrelevant antigen) boost (purple). (G) Bar graphs summarize frequencies of individual metaclusters in SNP-SC (blue), SNP-IV (Reps1) (green), or SNP-IV (irrelevant antigen) boosted animals. Statistics were assessed by one-way ANOVA.
Figure 4.
Figure 4.. Chil3+ monocytes expressed immunoregulatory gene signature while Plin2+ macrophages expressed interferon-related gene signature
(A) Downstream analyses focused on monocyte/macrophage (MoMac) populations. (B) Bar graph shows number of genes downregulated or upregulated by monocyte/macrophage populations following SNP-7/8a boost compared to untreated controls. (C) Volcano plot comparing significantly (P value < 0.05) upregulated (fold change > 0.25, red) or downregulated (fold change <0.25, blue) genes within tumor macrophages in SNP-IV treated animals compared to untreated. (D) Violin plots highlighting top DEGs related to Plin2+ macrophages (top) and Chil3+ monocytes (bottom). (E) Dot plot highlighting top pathways upregulated (red arrow) or downregulated (blue arrow) in SNP-SC or SNP-IV treated groups compared to untreated. (F) Flow cytometry plots show identification of Chil3+ monocytes in tumors 24 h after boosting with SNP-IV compared to untreated animals (concatenated, n=3). (G) Bar graph summarizes the frequency of Chil3+ monocytes in tumors 24 h after boosting with SNP-IV compared to untreated animals (n=3).
Figure 5.
Figure 5.. Interferon alpha required for mediating anti-tumor efficacy after SNP-IV treatment
(A) Schematic of therapeutic study design. Mice were implanted with MC38 and treated with SNP-7/8a (Reps1) on day 7 and SNP-7/8a (Irrelevant antigen) on day 14 together with CPI. Blocking antibodies against IFNAR (MAR1–5A3) were given on day 13 (500 μg) and day 15 (200 μg). (B) Measurement of IFNα in sera of mice after SNP-IV boost with isotype control or IFNAR blocking antibody (n=3–6). Statistics were assessed by Kruskal Wallis test. (C) Tumor growth following treatment with SNP-SC prime followed by SNP-IV with isotype control (purple) or IFNAR blocking antibody (maroon) (n=8). Statistics were assessed by two-way ANOVA. (D) Survival curve following treatment with SNP-SC prime followed by SNP-IV with isotype control (purple) or IFNAR blocking antibody (maroon) (n=8). Statistics were assessed by log-rank test. (E) Bar graph summarizes the frequency of tetramer+ CD8 T cells in blood after treatment (n=8). Statistics were assessed by Kruskal Wallis test. (F) Measurement of cytokines and chemokines in sera of mice after SNP-IV boost with isotype control or IFNAR blocking antibody (n=3–6). Statistics were assessed by Mann-Whitney test. (G) Heatmaps represent the median MFI of CD80, CD86 and CCR7 on cDC1s in the spleen, tumor-draining LNs and tumors after treatment (n=5). (H) Flow cytometry plots show identification of “Chil3+ monocytes” in tumors 24 h after boosting with SNP-IV with isotype control (purple) or IFNAR blocking antibody (maroon) (concatenated, n=4). (I) Bar graph summarizes the frequency of “Chil3+ monocytes” in tumors of untreated animals (gray) or 24 h after boosting with SNP-IV with isotype control (purple) or IFNAR blocking antibody (maroon) (n=4). Statistics were assessed by Mann-Whitney test.
Figure 6.
Figure 6.. Chil3+ monocyte markers in human tumor-associated myeloid cells
(A) UMAP representation of macrophages and monocytes in the MoMac-VERSE (Mulder et al. Immunity 2021) filtered to contain cancer studies sequenced with 10x technology. (B) Violin plot comparing the scores for huChil3 between monocytes and macrophages from (B). Statistics were assessed by Wilcoxon Rank Sum test (***, P < 0.0001). (C) Median score (y-axis) of huChil3 in each dataset of the MoMac-VERSE (dots) for each of the macrophage/monocyte subsets (x-axis). Mean ± SD across studies represented as blue circles and lines, respectively. Statistics were assessed by one-way Anova (P < 0.0001). Adjusted P value (Tukey’s HSD test) < 0.1 comparing #8 with any other cluster. (D) Heatmap showing a hierarchical clustering of median scores for huChil3 in each dataset and cluster (z-scored per dataset). (E) Scores (y-axis) for huChil3 in bulk RNA-seq samples (dots) from sorted populations (x-axis) of 364 individual tumors across 12 cancer types (Combes et al. Cell 2022). Blue dots indicate median in each group. (F) Survival curves across all TCGA (left), low grade glioma (middle) and clear cell renal cell carcinoma (right). Patients (n = 8,911) were stratified as high- or low-expression cohorts based on median huChil3 geneset scores. Statistics were assessed by log-rank test.

References

    1. Allen BM, Hiam KJ, Burnett CE, Venida A, DeBarge R, Tenvooren I, Marquez DM, Cho NW, Carmi Y, and Spitzer MH (2020). Systemic dysfunction and plasticity of the immune macroenvironment in cancer models. Nat Med 26, 1125–1134. - PMC - PubMed
    1. Aran D, Hu Z, and Butte AJ (2017). xCell: digitally portraying the tissue cellular heterogeneity landscape. Genome Biol 18, 220. - PMC - PubMed
    1. Azizi E, Carr AJ, Plitas G, Cornish AE, Konopacki C, Prabhakaran S, Nainys J, Wu K, Kiseliovas V, Setty M, et al. (2018). Single-Cell Map of Diverse Immune Phenotypes in the Breast Tumor Microenvironment. Cell 174, 1293–1308 e1236. - PMC - PubMed
    1. Baharom F, Ramirez-Valdez RA, Tobin KKS, Yamane H, Dutertre CA, Khalilnezhad A, Reynoso GV, Coble VL, Lynn GM, Mule MP, et al. (2021). Intravenous nanoparticle vaccination generates stem-like TCF1(+) neoantigen-specific CD8(+) T cells. Nat Immunol 22, 41–52. - PMC - PubMed
    1. Binnewies M, Roberts EW, Kersten K, Chan V, Fearon DF, Merad M, Coussens LM, Gabrilovich DI, Ostrand-Rosenberg S, Hedrick CC, et al. (2018). Understanding the tumor immune microenvironment (TIME) for effective therapy. Nat Med 24, 541–550. - PMC - PubMed

Publication types