. 2022 Sep 1;36(17-18):985-1001.
doi: 10.1101/gad.350026.122. Epub 2022 Oct 27.

An integrated SAGA and TFIID PIC assembly pathway selective for poised and induced promoters

Affiliations

An integrated SAGA and TFIID PIC assembly pathway selective for poised and induced promoters

Chitvan Mittal et al. Genes Dev. .

Abstract

Genome-wide, little is understood about how proteins organize at inducible promoters before and after induction and to what extent inducible and constitutive architectures depend on cofactors. We report that sequence-specific transcription factors and their tethered cofactors (e.g., SAGA [Spt-Ada-Gcn5-acetyltransferase], Mediator, TUP, NuA4, SWI/SNF, and RPD3-L) are generally bound to promoters prior to induction ("poised"), rather than recruited upon induction, whereas induction recruits the preinitiation complex (PIC) to DNA. Through depletion and/or deletion experiments, we show that SAGA does not function at constitutive promoters, although a SAGA-independent Gcn5 acetylates +1 nucleosomes there. When inducible promoters are poised, SAGA catalyzes +1 nucleosome acetylation but not PIC assembly. When induced, SAGA catalyzes acetylation, deubiquitylation, and PIC assembly. Surprisingly, SAGA mediates induction by creating a PIC that allows TFIID (transcription factor II-D) to stably associate, rather than creating a completely TFIID-independent PIC, as generally thought. These findings suggest that inducible systems, where present, are integrated with constitutive systems.

Keywords: ChIP-seq; SAGA; Saccharomyces; gene regulation; genomics; transcription preinitiation complex.


Figures

Figure 1.
Figure 1.
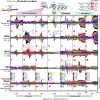
Protein architectures of constitutive and inducible (RP, induced, poised, and condition-specific) promoters. Composite plots of chromatin immunoprecipitation exonuclease (ChIP-exo) tag 5′ ends (exonuclease stop sites as illustrated) for 70 representative promoter/gene-associated proteins (out of 400) are shown distributed around the indicated X-axis reference point (UAS, Sua7, or +1 nuc) within each promoter class (rows of panels). Each target protein in a vertical column is defined by one color whose legend is at the bottom. Selected complexes that are represented by a protein are pointed out in particular panels. See the Materials and Methods for details. X-axis intervals are orientated such that transcription proceeds to the right. UAS corresponds to a ssTF binding site or the equivalent distance upstream (150 bp) of a transcription start site (TSS) when no UAS was present. Sua7 (TFIIB) corresponds to the Sua7 ChExMix peak closest to an annotated TSS and is essentially the PIC location. +1 nuc is the downstream nucleosome midpoint closest to a TSS. Alignment to these reference features provided high positional resolution. Opposite-strand data are inverted. “N” denotes class membership count. The Y-axis occupancy scale is the same and thus comparable for a particular target across the different promoter classes (analysis ID: CM701–CM707).
Figure 2.
Figure 2.
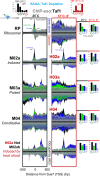
SAGA binding at UASs depends on Hsf1, and TBP binding depends on Tra1. Composite plots of ChIP-exo tag 5′ ends of the indicated proteins (SAGA or TBP) are distributed around the Sua7 reference point within each promoter class at the indicated cellular temperature (25°C; 6 min at 37°C). Each fill color represents a target or mutant that is pointed out in a panel. See Figure 1 and the Materials and Methods for plotting details. The Y-axis occupancy scale is linear and the same for a particular target (or control) within a promoter class for both mutant and WT and is quantified in the bar graphs at the right of the relevant panel set. Quantified regions in the bar graphs are demarcated by the red bars in traces in B. The Y-axis occupancy is scaled separately among promoter classes to maximize visual distinction and thus (unlike Fig. 1) is not directly comparable. Their comparable WT values are provided in the bar graphs at the top. Consequently, RP (6 min at 37°C) and M04 plots show essentially background SAGA occupancy that is magnified on the Y-axis (see IgG control). (A) Positional organization of SAGA subunits upstream of the PIC. Bar graph quantification is relative to the reference point (Sua7) from −400 to −100 on the top (TSS) strand and from −300 to 0 on the bottom strands (analysis ID: CM04 and CM05). (B) SAGA (Sgf73) occupancy is shown upon rapid depletion of Hsf1 (cyan fill) or a mock depletion (orange fill) and compared with an IgG-negative control (gray fill) under acute heat shock conditions (6 min at 37°C). (Right) Bar graph quantifications are relative to the reference point (Sua7) from −400 to −100 on the top (TSS) and bottom strands (analysis ID: CM18). (C) TBP (PIC) occupancy is shown upon rapid depletion of Tra1 (via its Dtag). (Right) Bar graph quantifications are relative to the reference point (Sua7) from −70 to +30 on the top (TSS) strand plus from −40 to +60 on the opposite strand (analysis ID: CM47 and CM48).
Figure 3.
Figure 3.
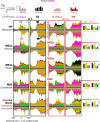
SAGA primarily drives induced PIC assembly. Composite plots are shown of ChIP-exo tag 5′ ends of TBP upon SAGA (Spt20) or TFIID (Taf1) depletion, distributed around the Sua7 reference point within each promoter class at the indicated cellular temperature (25°C; 6 min at 37°C). See Figure 1 and the Materials and Methods for plotting details. Also shown are violin plots of log2 fold changes of TBP occupancy of mutant over WT for individual promoters within each class. Two biological replicates are shown for each depletion mutant and independent WT and IgG controls. Bar graph quantification of Sua7 ChIP-exo conducted in parallel is shown at the far right (analysis ID: CM30, CM01, and CM02).
Figure 4.
Figure 4.
SAGA assembles a PIC that stabilizes TAF binding. Composite plots are shown of ChIP-exo tag 5′ ends of TFIID (Taf1) upon SAGA (Spt20) or Taf1 depletion, distributed around the Sua7 reference point within each promoter class at the indicated cellular temperature (25°C; 6 min at 37°C). See Figure 1 and the Materials and Methods for plotting details (analysis ID: CM43 and CM44).
Figure 5.
Figure 5.
SAGA acetylates +1 nucleosomes at inducible promoters, whereas non-SAGA Gcn5 acetylates constitutive promoters. Composite plots are shown of ChIP-exo tag 5′ ends of H3K9ac and H3 upon deletion of SAGA (sgf73Δ, spt20Δ, and gcn5Δ) or ADA (ahc1Δ) subunits, distributed around the +1 nucleosome midpoint within each promoter class at the indicated cellular temperature (25°C; 6 min at 37°C). See Figure 1 and the Materials and Methods for plotting details. Quantification bar graphs at the right show H3K9ac/H3 density ratios at +1 nucleosomes assessed from −100 to +50 on the top strand and −50 to +100 on the bottom strand (see example horizonal boxes in RP composite plots). See also Supplemental Figure S7 (analysis ID: CM102, CM105, CM108, and CM111).
Figure 6.
Figure 6.
SAGA deubiquitylase activity is specific to inducible promoters. Composite plots of ChIP-exo tag 5′ ends of H2Bub and H2B upon deletion of SAGA (sgf73Δ, spt20Δ, and gcn5Δ) subunits, distributed around the +1 nucleosome midpoint within each promoter class at the indicated cellular temperature (25°C; 6 min at 37°C). See Figure 1 and the Materials and Methods for plotting details. Quantification bar graphs at the right show H2Bub/H2B density ratios at +1 nucleosomes assessed from −100 to +500 on the top strand, and −50 to +500 on the bottom strand (see example horizonal boxes in RP composite plots; analysis ID: CM113–116).
Figure 7.
Figure 7.
Model of PIC assembly at induced, poised, and constitutive promoters. (Top left) At induced promoters, ssTFs anchor activated cofactors such as SAGA that promote PIC assembly through TBP and H3K9 acetylation, which then locks in the TAF/TFIID complex. (Middle and bottom left) Poised promoters have essentially the same architecture, except the cofactors are relatively inactive for augmented PIC assembly. (Right) Constitutive promoters lack the inducible architecture and so depend predominantly on TFIID for PIC assembly. They use Gcn5 apart from SAGA to acetylate +1 nucleosomes (analysis ID: CM900).

Similar articles

Cited by

References

    1. Allard S, Utley RT, Savard J, Clarke A, Grant P, Brandl CJ, Pillus L, Workman JL, Cote J. 1999. Nua4, an essential transcription adaptor/histone H4 acetyltransferase complex containing Esa1p and the ATM-related cofactor Tra1p. EMBO J 18: 5108–5119. 10.1093/emboj/18.18.5108 - DOI - PMC - PubMed
    1. Badjatia N, Rossi MJ, Bataille AR, Mittal C, Lai WKM, Pugh BF. 2021. Acute stress drives global repression through two independent RNA polymerase II stalling events in Saccharomyces. Cell Rep 34: 108640. 10.1016/j.celrep.2020.108640 - DOI - PMC - PubMed
    1. Baptista T, Grünberg S, Minoungou N, Koster MJE, Timmers HTM, Hahn S, Devys D, Tora L. 2017. SAGA is a general cofactor for RNA polymerase II transcription. Mol Cell 68: 130–143.e5. 10.1016/j.molcel.2017.08.016 - DOI - PMC - PubMed
    1. Batta K, Zhang Z, Yen K, Goffman DB, Pugh BF. 2011. Genome-wide function of H2B ubiquitylation in promoter and genic regions. Genes Dev 25: 2254–2265. 10.1101/gad.177238.111 - DOI - PMC - PubMed
    1. Bhaumik SR, Green MR. 2002. Differential requirement of SAGA components for recruitment of TATA-box-binding protein to promoters in vivo. Mol Cell Biol 22: 7365–7371. 10.1128/MCB.22.21.7365-7371.2002 - DOI - PMC - PubMed

Publication types

MeSH terms