. 2023 Jan 1;34(1):26-39.
doi: 10.1681/ASN.2022040471. Epub 2022 Oct 27.

Early Effect of the Circular Model of Kidney Allocation in the United States

Affiliations

Early Effect of the Circular Model of Kidney Allocation in the United States

Chethan M Puttarajappa et al. J Am Soc Nephrol. .

Abstract

Background: In March 2021, the United States implemented a new kidney allocation system (KAS250) for deceased donor kidney transplantation (DDKT), which eliminated the donation service area-based allocation and replaced it with a system on the basis of distance from donor hospital to transplant center within/outside a radius of 250 nautical miles. The effect of this policy on kidney discards and logistics is unknown.

Methods: We examined discards, donor-recipient characteristics, cold ischemia time (CIT), and delayed graft function (DGF) during the first 9 months of KAS250 compared with a pre-KAS250 cohort from the preceding 2 years. Changes in discards and CIT after the onset of COVID-19 and the implementation of KAS250 were evaluated using an interrupted time-series model. Changes in allocation practices (biopsy, machine perfusion, and virtual cross-match) were also evaluated.

Results: Post-KAS250 saw a two-fold increase in kidneys imported from nonlocal organ procurement organizations (OPO) and a higher proportion of recipients with calculated panel reactive antibody (cPRA) 81%-98% (12% versus 8%; P <0.001) and those with >5 years of pretransplant dialysis (35% versus 33%; P <0.001). CIT increased (mean 2 hours), including among local OPO kidneys. DGF was similar on adjusted analysis. Discards after KAS250 did not immediately change, but we observed a statistically significant increase over time that was independent of donor quality. Machine perfusion use decreased, whereas reliance on virtual cross-match increased, which was associated with shorter CIT.

Conclusions: Early trends after KAS250 show an increase in transplant access to patients with cPRA>80% and those with longer dialysis duration, but this was accompanied by an increase in CIT and a suggestion of worsening kidney discards.


Conflict of interest statement

V. Gunabushanam reports that his spouse is employed by Fitch Ratings. S. Hariharan reports being the owner of Transplant Interface, LLC. C. Puttarajappa reports research funding from NIH (NIDDK) and that his spouse is a site Primary Investigator for contracted clinical research with Abeona/Ultragenyx, Denali, Regenxbio, and Shire. S. Mohan reports consultancy for Angion Biomedica, eGenesis, and HSAG; an advisory or leadership role for ASN Quality Committee (member), ETCLC (National Faculty Chair), Kidney International Reports (ISN; deputy editor), SRTR Review Committee (member), and UNOS data advisory committee (vice chair); and research funding from NIH (NIDDK, NIHMD and NIBIB) and the Kidney Transplant Collaborative. All remaining authors have nothing to disclose.

Figures

None
Graphical abstract
Figure 1.
Figure 1.
Study outline and cohort selection. Figure shows derivation of the donor and recipient cohorts for both the pre-KAS250 and post-KAS250 periods. Donor cohorts were compared to assess discard rates and changes in donor characteristics. Comparison of recipient cohorts provided changes in characteristics of DDKT recipients, post-transplant outcomes (DGF & CIT), and process-related changes (i.e., machine perfusion and virtual cross-match use). CIT, cold ischemia time; DDKT, deceased donor kidney transplantation; DGF, delayed graft function; KAS250, kidney allocation system 250.
Figure 2.
Figure 2.
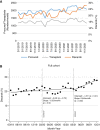
Kidney procurement and utilization over the study period. (A) Shown are trends for kidneys procured (numbers/month), transplanted (numbers/month) and discarded (percentage of procured kidneys) over the study period. After an initial drop in percentage of discarded kidneys (orange line) immediately after KAS250, an upward trend in discards was witnessed. (B) Interrupted time series analysis for kidney discards. Kidney discards over the study period are shown, with vertical dashed lines indicating the two demarcation time points corresponding to COVID19 (first line) and KAS250 (second line). Individual data points in the graph represent "predicted" monthly discard percentages derived from a KDPI-adjusted regression model that used individual kidney-level data. There was a statistically significant increase in discard rates beginning in March 2021 (after KAS250) with an average increase in discard rates of 0.6%/month. There was no significant change in discards in the time period between the COVID19 pandemic onset in March 2020 and KAS250 implementation in March 2021. COVID19, coronavirus disease 2019; KAS250, kidney allocation system 250; KDPI, kidney donor profile index.
Figure 3.
Figure 3.
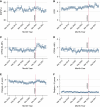
Interrupted time series analysis for kidney discards among subgroups. Kidney discards over the study period are shown for subgroups, with vertical dashed lines in each subplot indicating the two demarcation time points corresponding to COVID-19 (first line) and KAS250 (second line). A statistically significant increase in discards over time after KAS250 was seen for (A) KDPI<20, (C) DBD donors, and (F) creatinine>2 mg/dl groups. Although an increasing trend in discards was also noted for (B) KDPI>85, (D) DCD, (E) and creatinine<2 mg/dl, the change in slope was not statistically significant compared with the pre-KAS250 period. None of the subgroups showed a statistically significant change in discards between the onset of the COVID-19 pandemic in March 2020 and the implementation of KAS250 in March 2021. Discards were adjusted for kidney donor profile index.
Figure 4.
Figure 4.
Trends for select recipient and donor characteristics over the study period. Shown are (A) changes in average donor KDPI, (B) proportion of DCD kidneys, (C) recipients with cPRA 80%–98%, (D) recipients with cPRA>98%, (E) pretransplant dialysis duration of >5 years, and (F) pretransplant dialysis duration of >10 years. The vertical dashed line in each subplot indicates the demarcation corresponding to the implementation of KAS250 in March 2021. Only the proportion of cRPA 80%–98% saw a noticeable increase in the post-KAS250 period, which persisted at above the pre-KAS250 average at the end of study period. There was no change in the very highly sensitized cPRA>98% group. The initial increase noted among groups with dialysis >5 years did not seem to persist after the first 3 months after KAS250.
Figure 5.
Figure 5.
Proportion of transplant kidneys imported from nonlocal OPO and cold ischemia time among the UNOS regions. Nonlocal OPO kidneys (A) and average cold ischemia times (B) increased across all UNOS regions but with some variation in magnitude of change.
Figure 6.
Figure 6.
Cold ischemia during the study period. Trends in cold ischemia time (in hours) before and after the implementation of KAS250 are shown with a vertical dashed line indicating the demarcation corresponding to the KAS250 implementation in March 2021. Shown are results for kidneys from (A) local OPO and nonlocal OPO and (B) overall cohorts. CIT increased significantly even among kidneys from local OPOs. CIT for nonlocal OPO kidneys decreased but remained higher than that of local OPO kidneys. The combination of these two changes along with nonlocal kidneys comprising two thirds of transplanted kidneys after KAS250 resulted in overall increase in average CIT for the post-KAS250 cohort.
Figure 7.
Figure 7.
Interrupted time series analysis for cold ischemia time. CIT changes over the study period are shown, with vertical dashed lines indicating the two demarcation time points corresponding to COVID-19 (first line) and KAS250 (second line). Individual data points in the graph represent “predicted” monthly CIT averages derived from an adjusted (for KDPI, biopsy, and machine perfusion) regression model that used individual kidney-level data. There was a statistically significant immediate increase (i.e., change in intercept) in CIT after KAS250 (second vertical dashed line) without any subsequent change in trends with time (nonsignificant change in slope). Similarly, there was a statistically significant decrease in CIT immediately after the onset of COVID-19 (first dashed line) but without any subsequent change in trends with time (nonsignificant change in slope).

References

    1. Israni A, Wey A, Thompson B, Miller J, Casingal V, Pavlakis M, et al. : New kidney and pancreas allocation policy: Moving to a circle as the first unit of allocation. J Am Soc Nephrol 32: 1546–1550, 2021 - PMC - PubMed
    1. Klarman SE, Formica RN, Jr: The broader sharing of deceased donor kidneys is an ethical and legal imperative. J Am Soc Nephrol 31: 1174–1176, 2020 - PMC - PubMed
    1. Gustafson SWT, Wey A, Salkowski N, Pyke J, Thompson B, Audette K, et al. : KPSAM simulation data on effect of removing DSA and region from kidney/pancreas/kidney-pancreas organ allocation policy, 2019. Available at: https://optn.transplant.hrsa.gov/media/2985/ki2019_01_analysisreport.pdf. Accessed August 1, 2021
    1. Adler JT, Husain SA, King KL, Mohan S: Greater complexity and monitoring of the new kidney allocation system: Implications and unintended consequences of concentric circle kidney allocation on network complexity. Am J Transplant 21: 2007–2013, 2021 - PubMed
    1. Organ Procurement and Transplantation Network : Continuous Distribution: Creating a More Fair and Patient-focused System for Organ Allocation. Available at: https://optn.transplant.hrsa.gov/policies-bylaws/a-closer-look/continuou.... Accessed March 21, 2022

Publication types