. 2022 Oct 27;6(1):e202201406.
doi: 10.26508/lsa.202201406. Print 2023 Jan.

Miro GTPase domains regulate the assembly of the mitochondrial motor-adaptor complex

Affiliations

Miro GTPase domains regulate the assembly of the mitochondrial motor-adaptor complex

Kayla Davis et al. Life Sci Alliance. .

Abstract

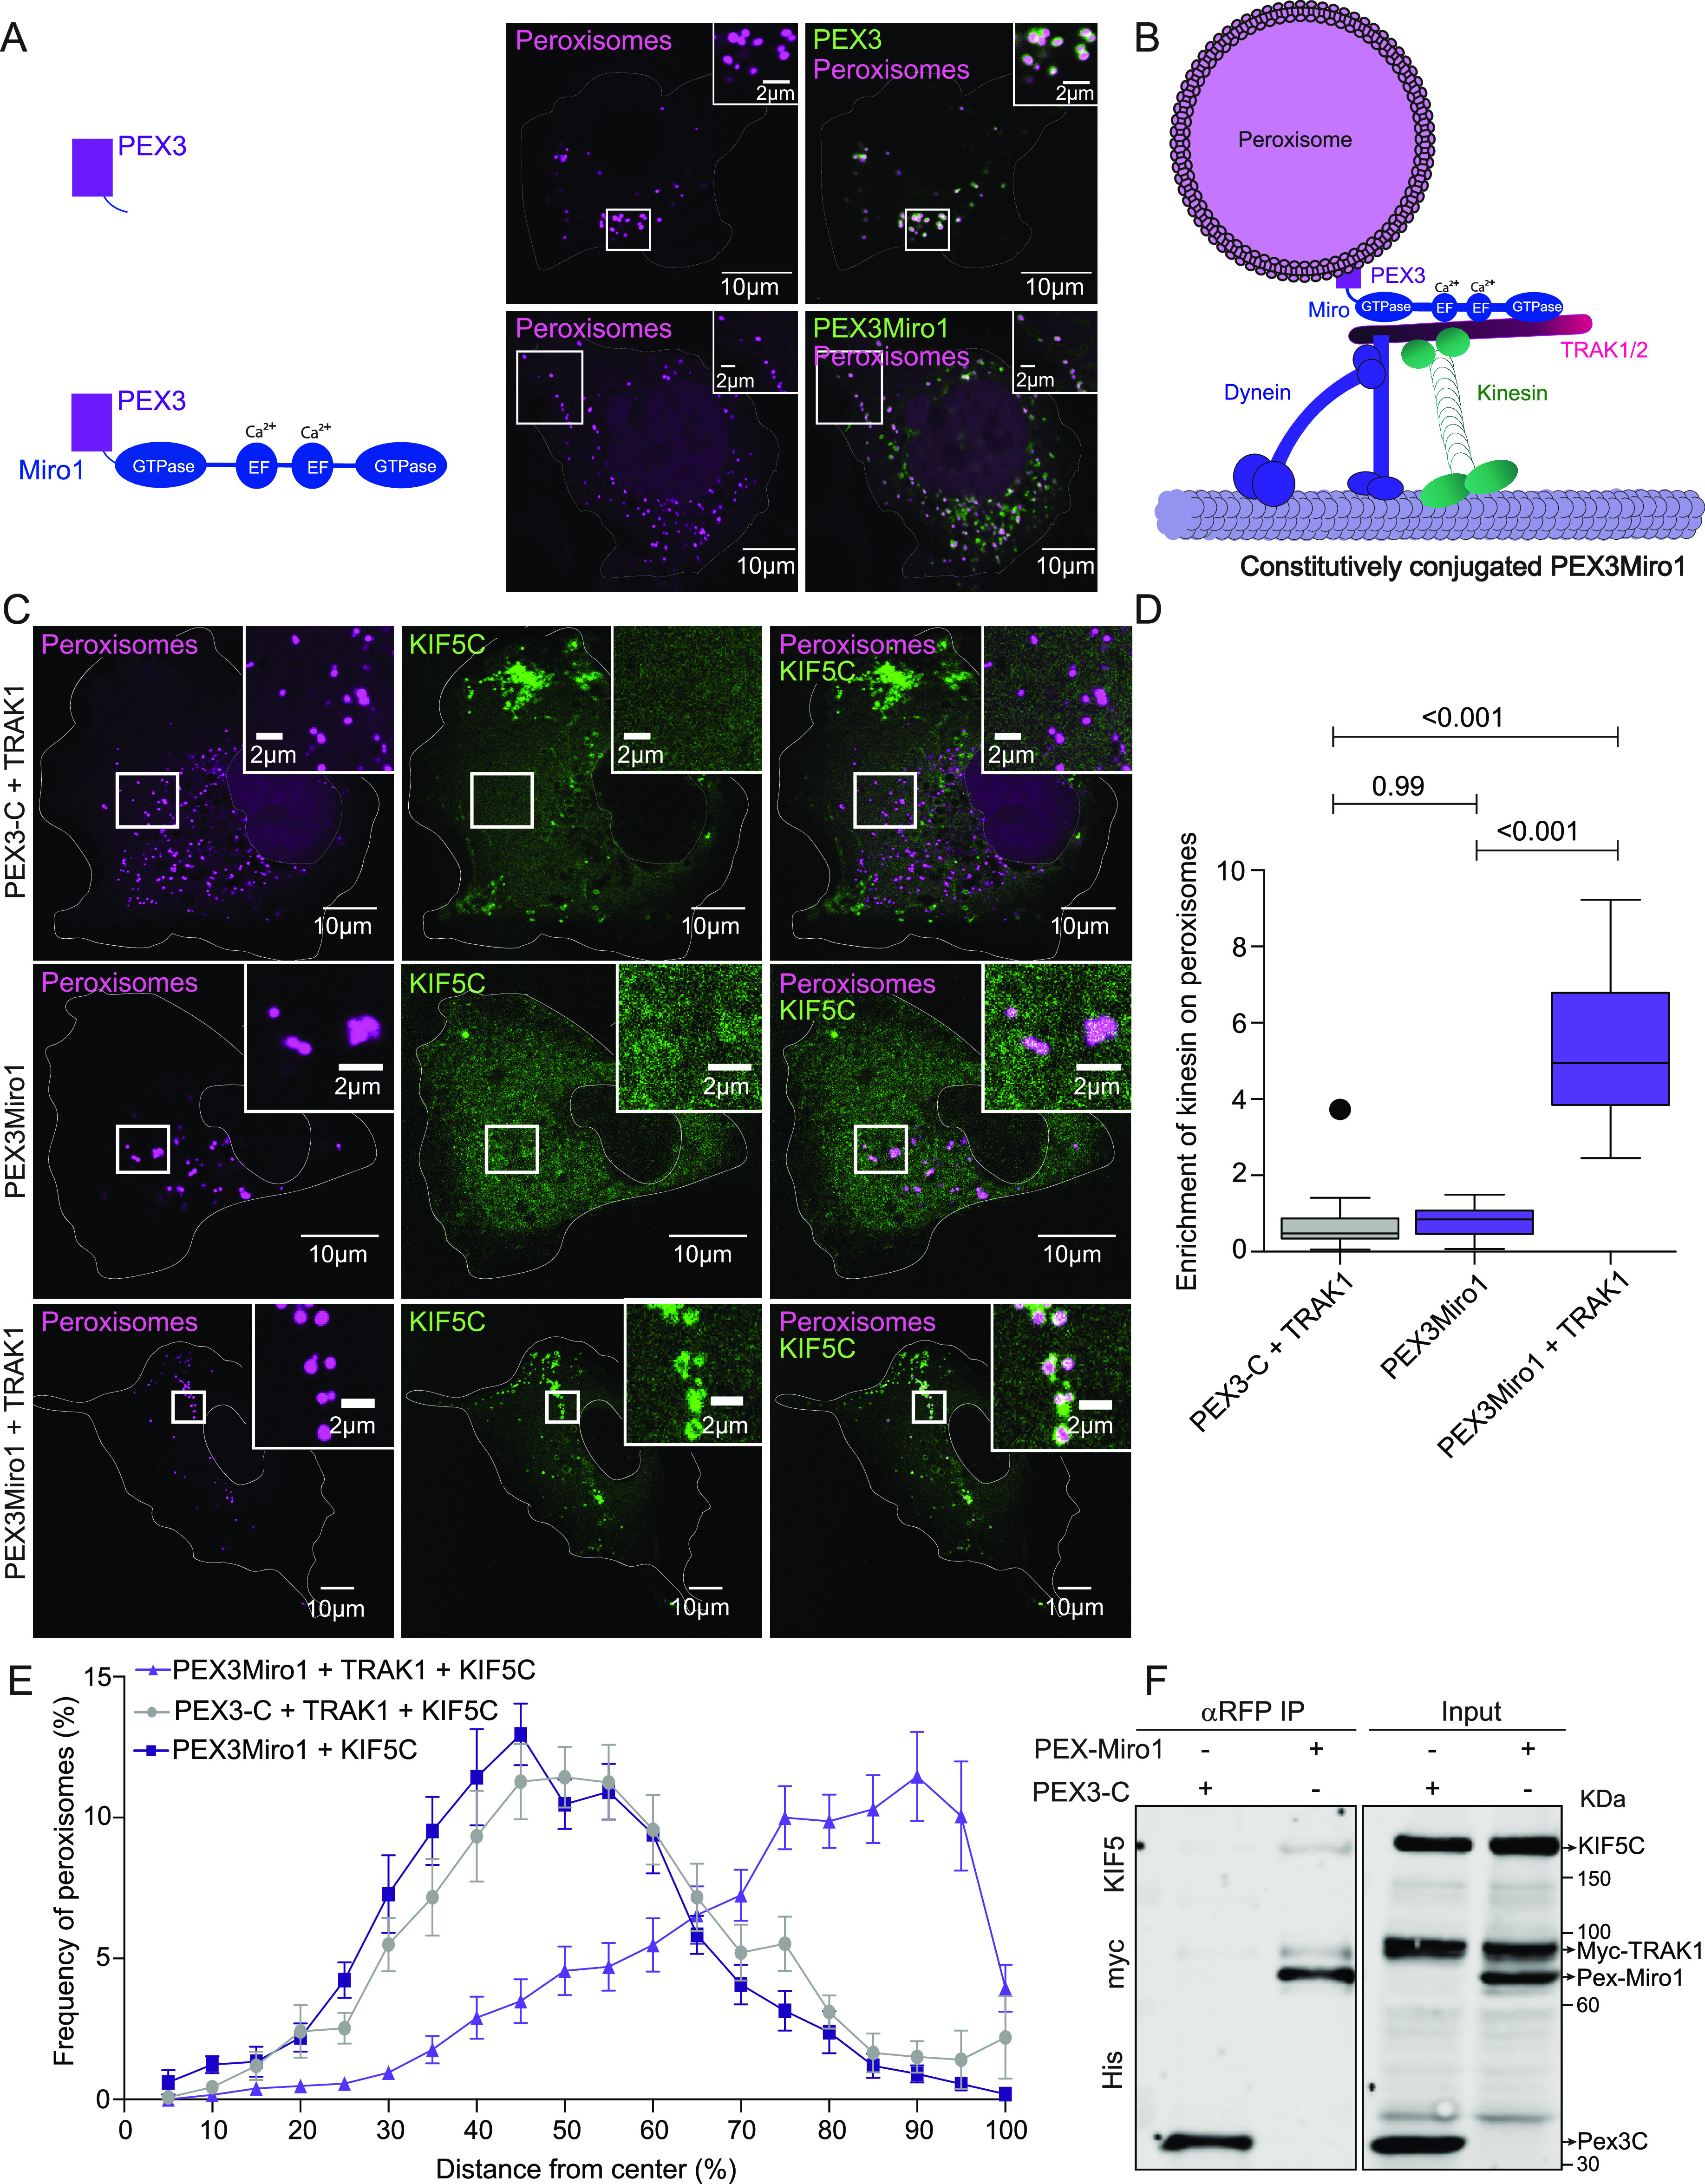
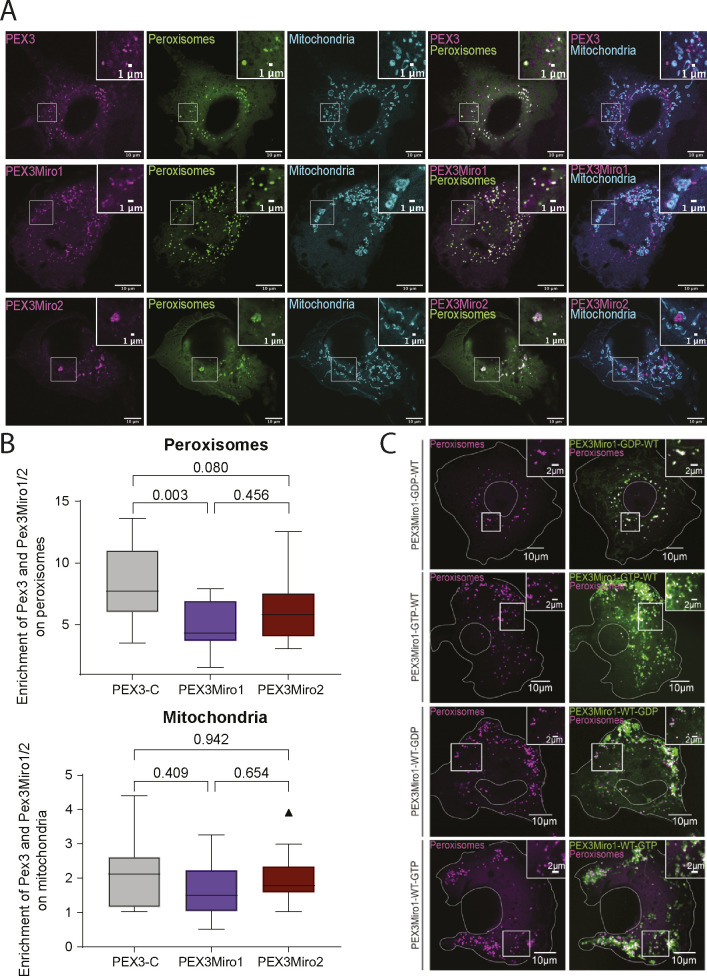
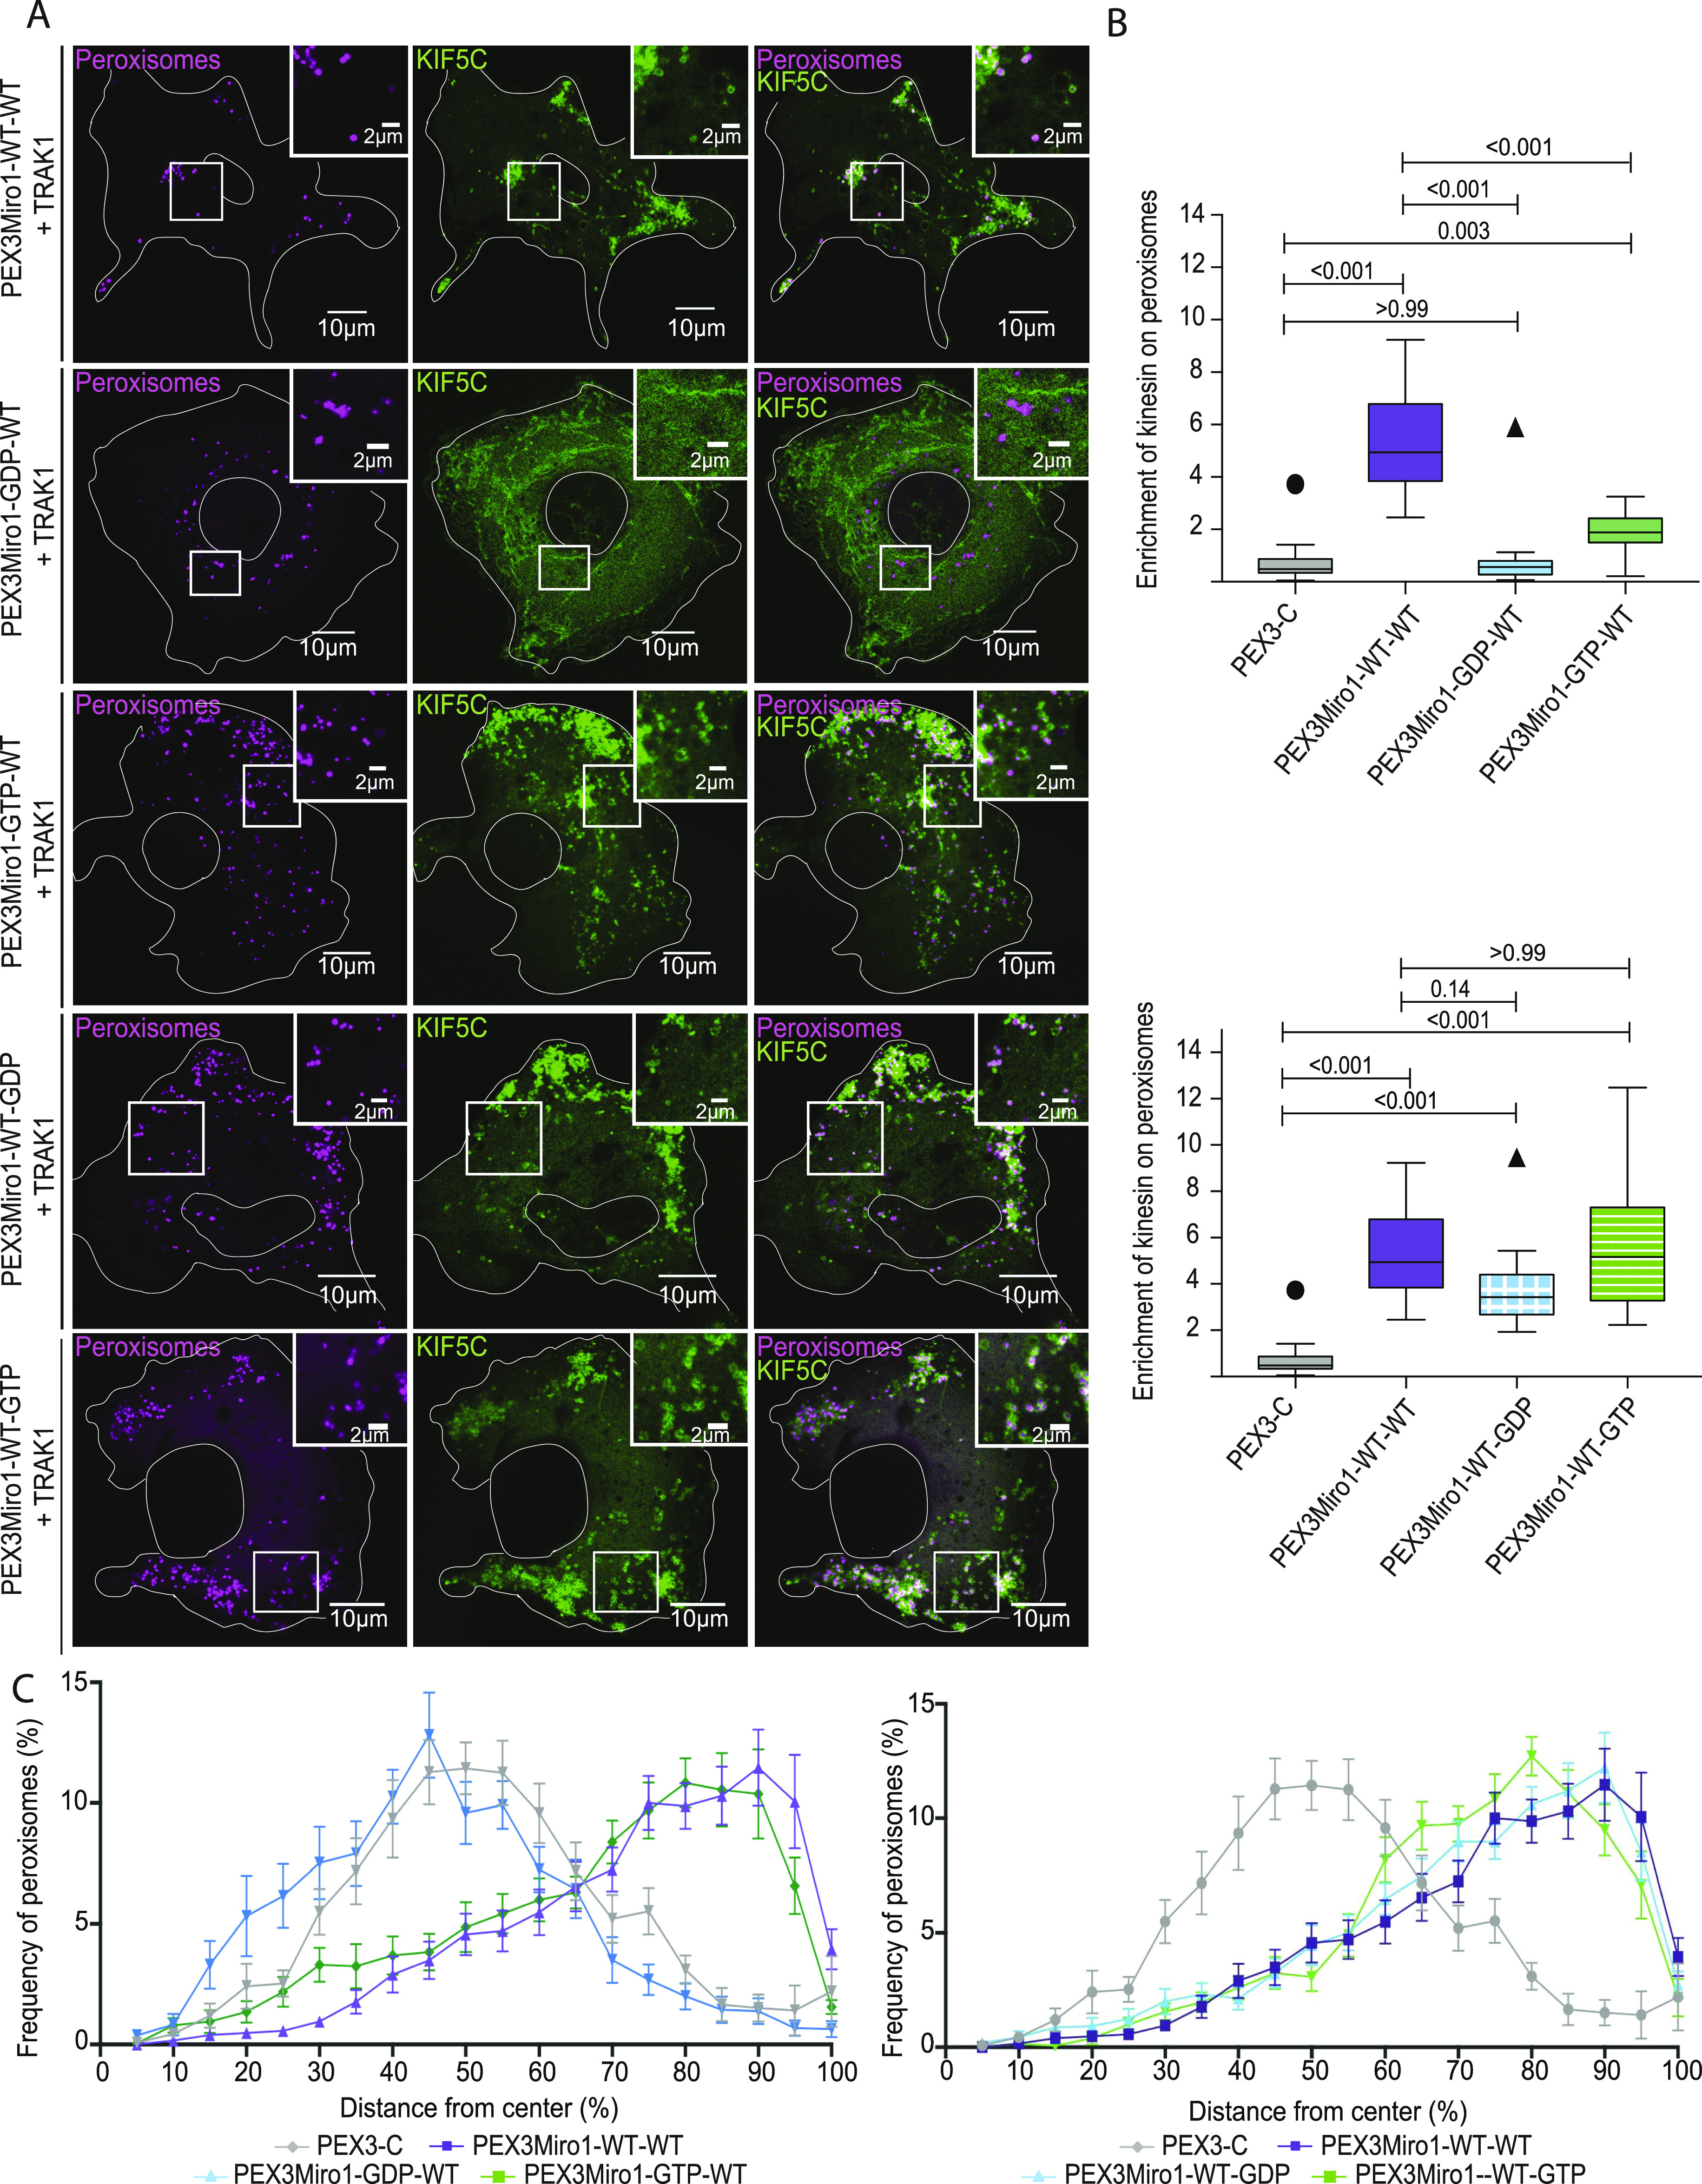
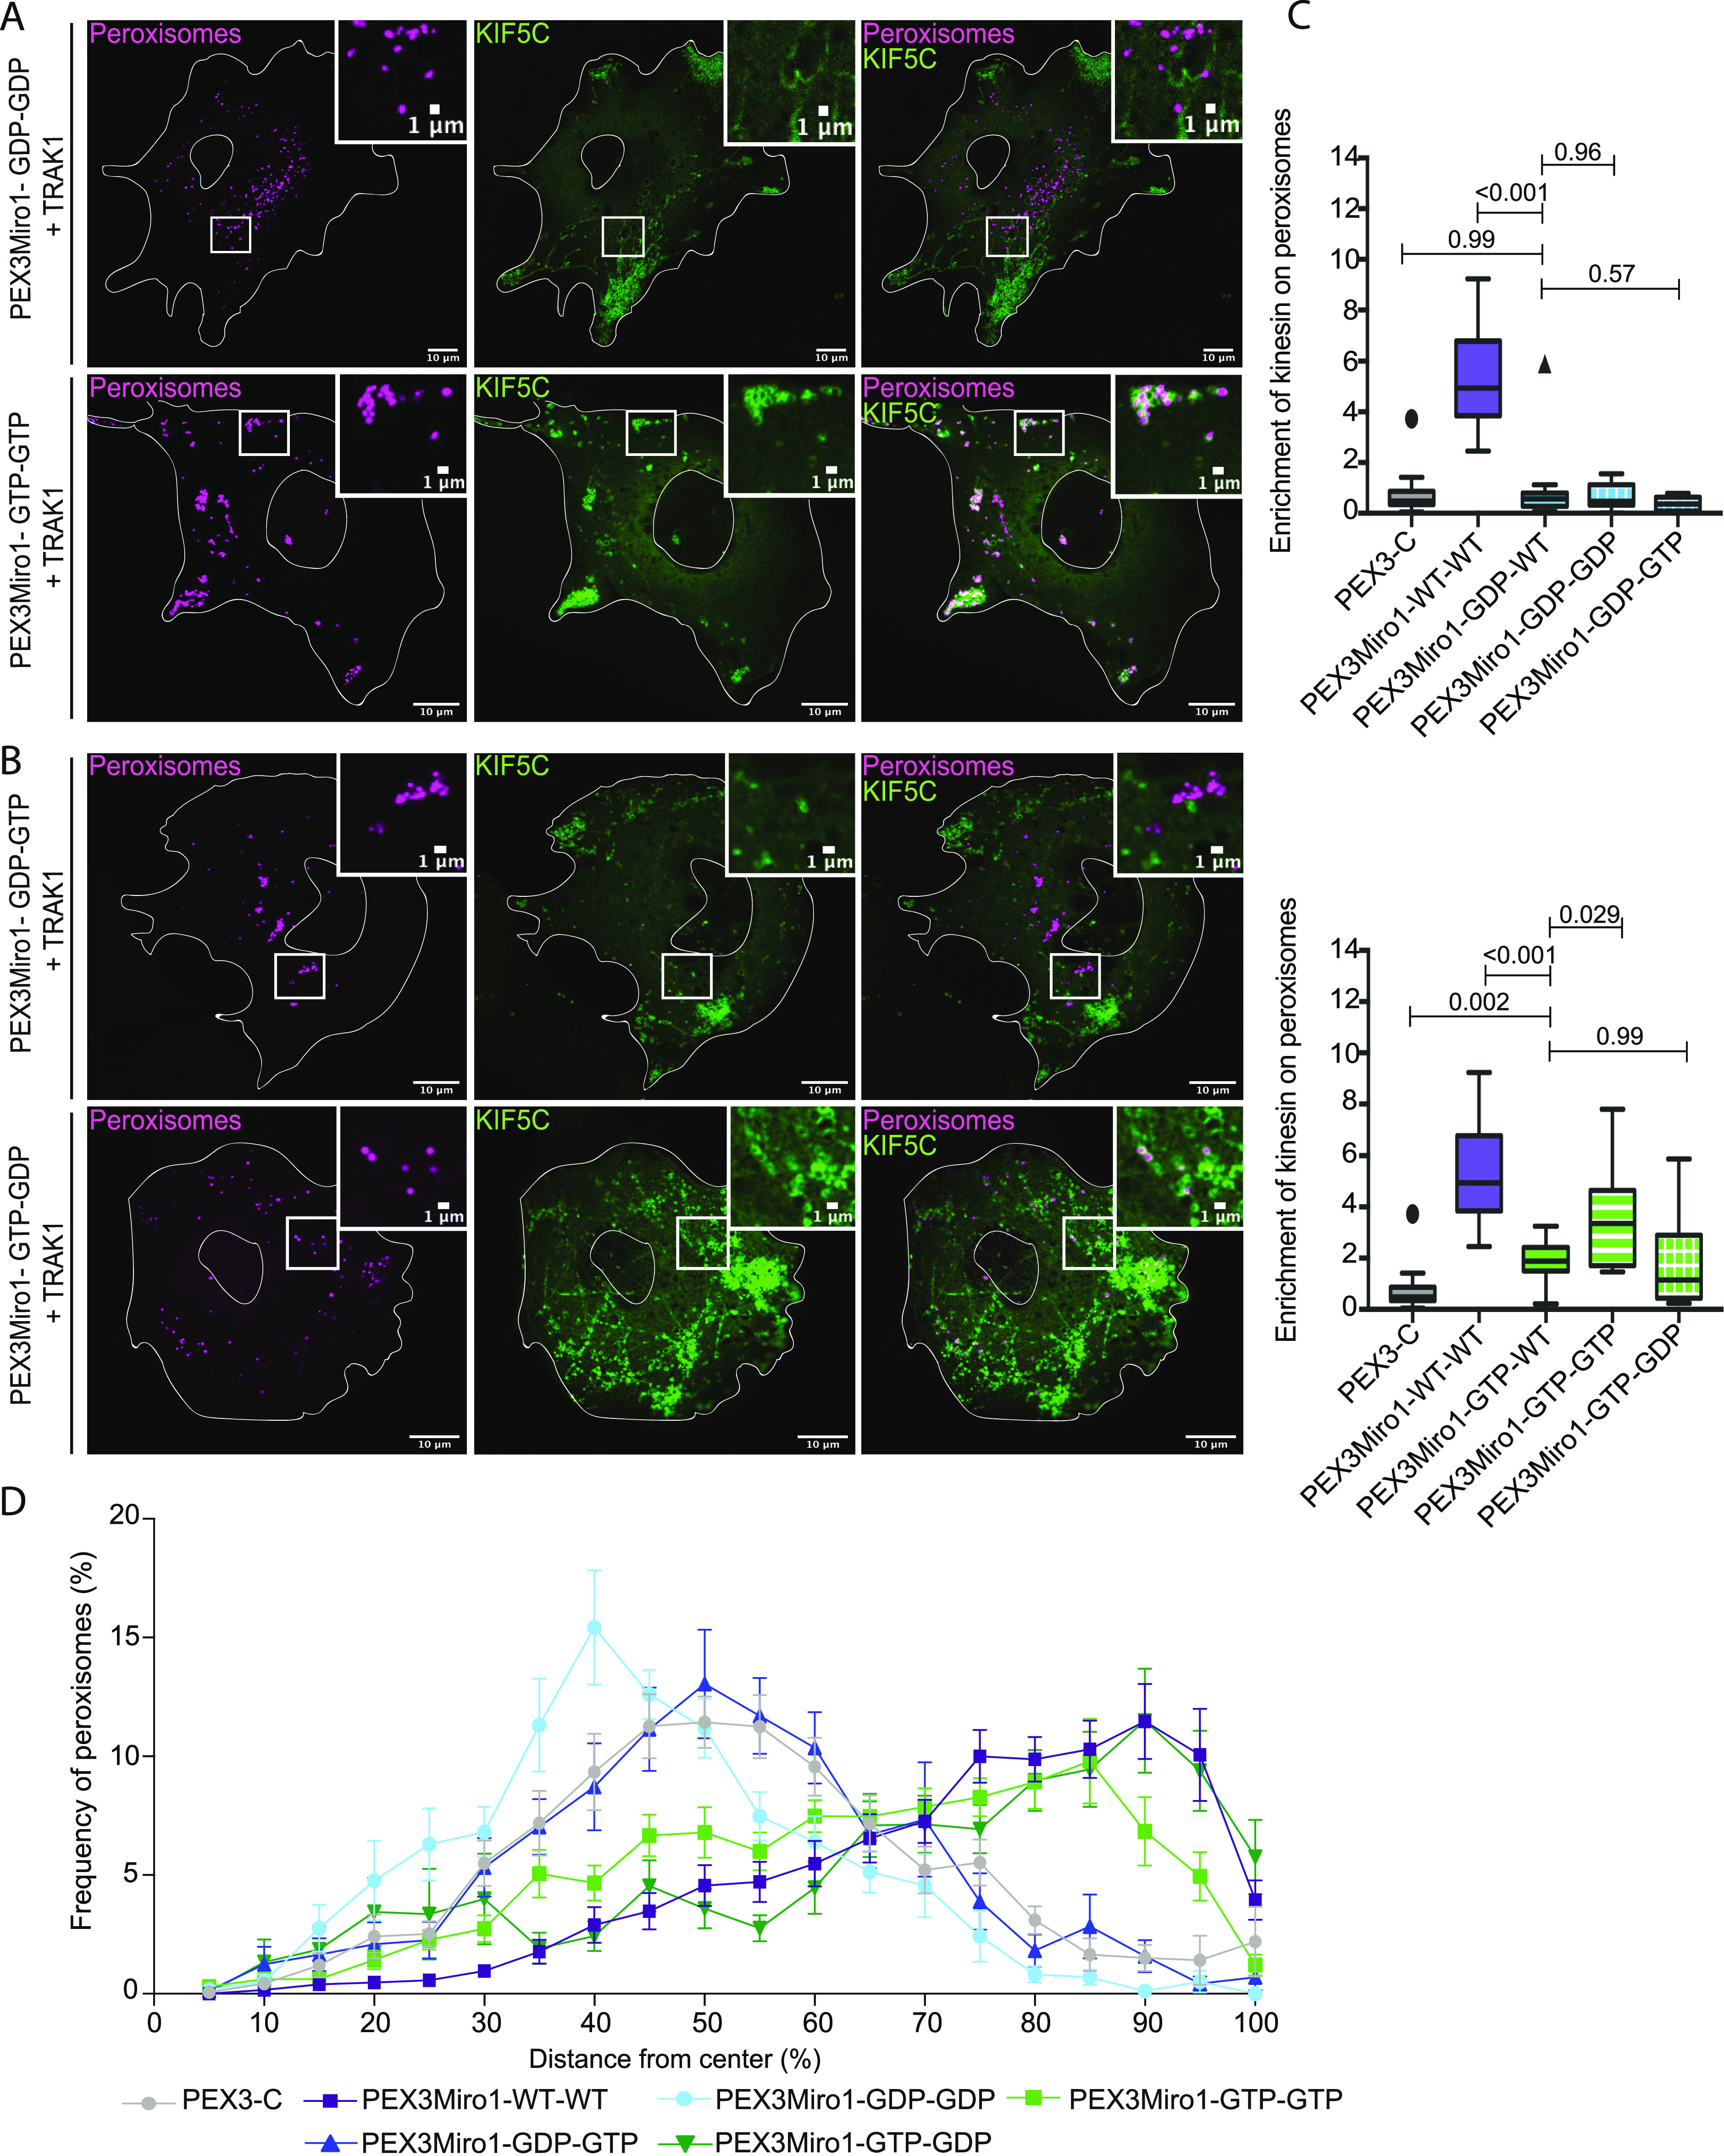
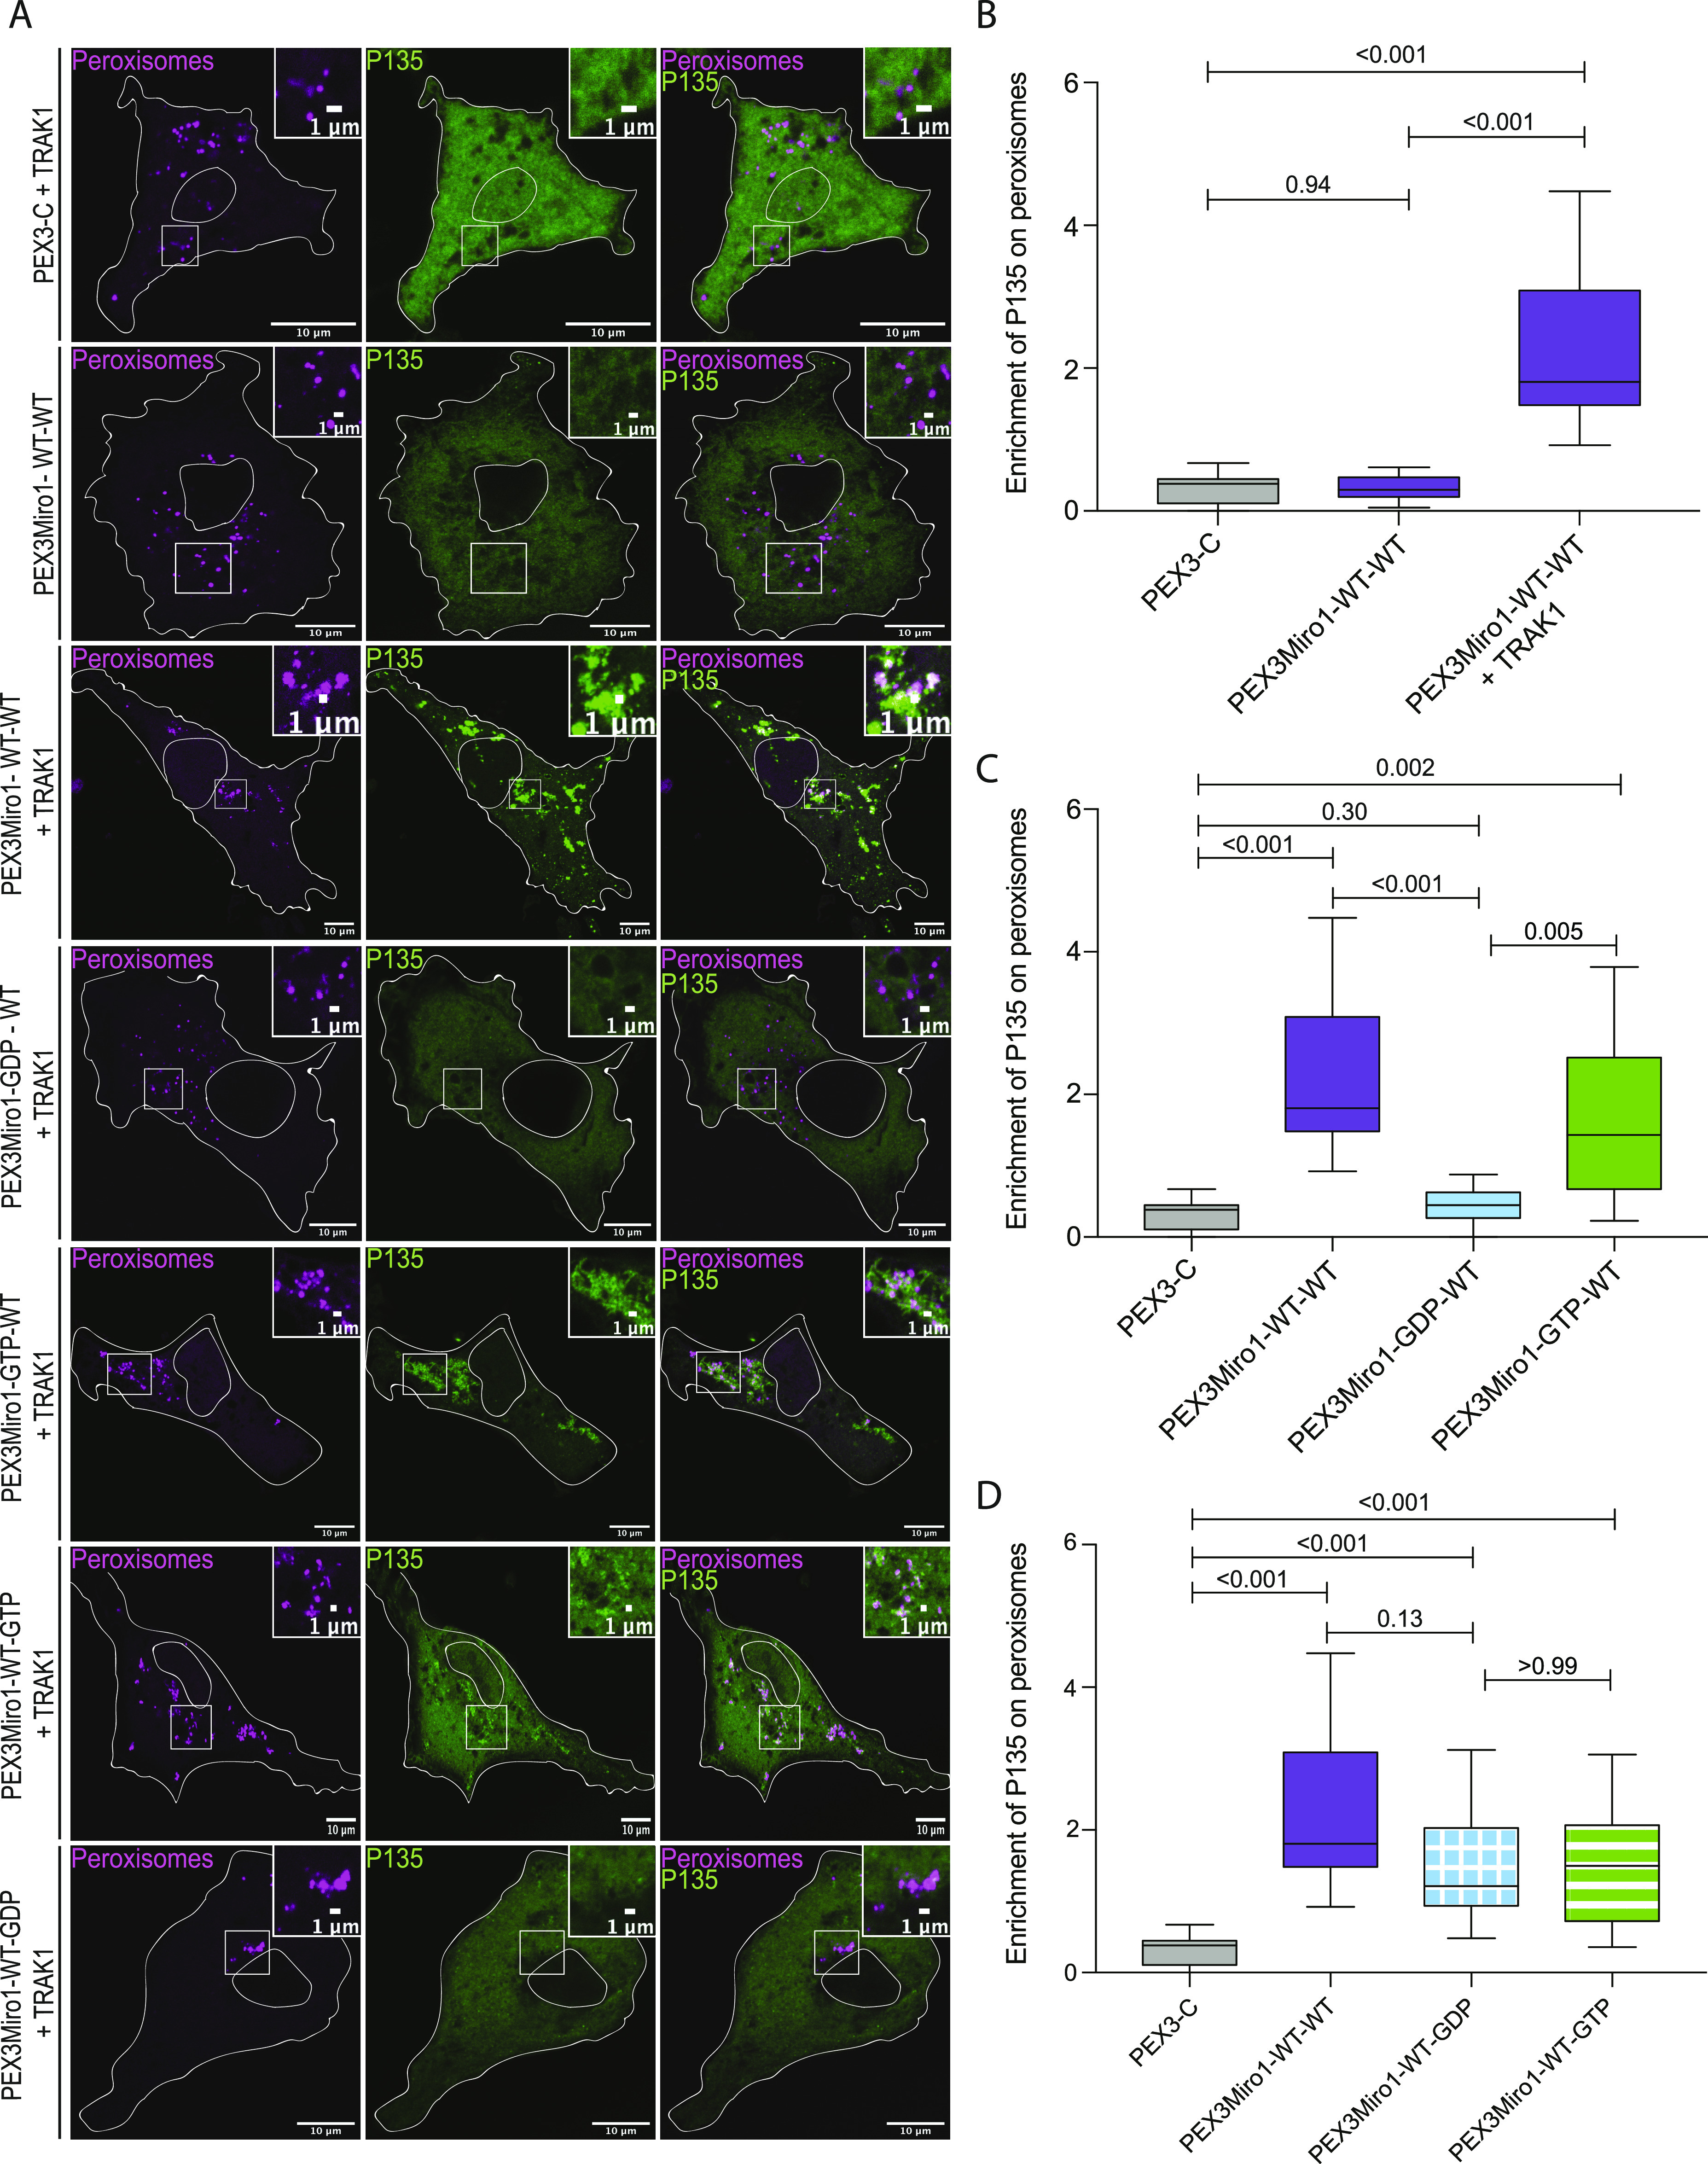
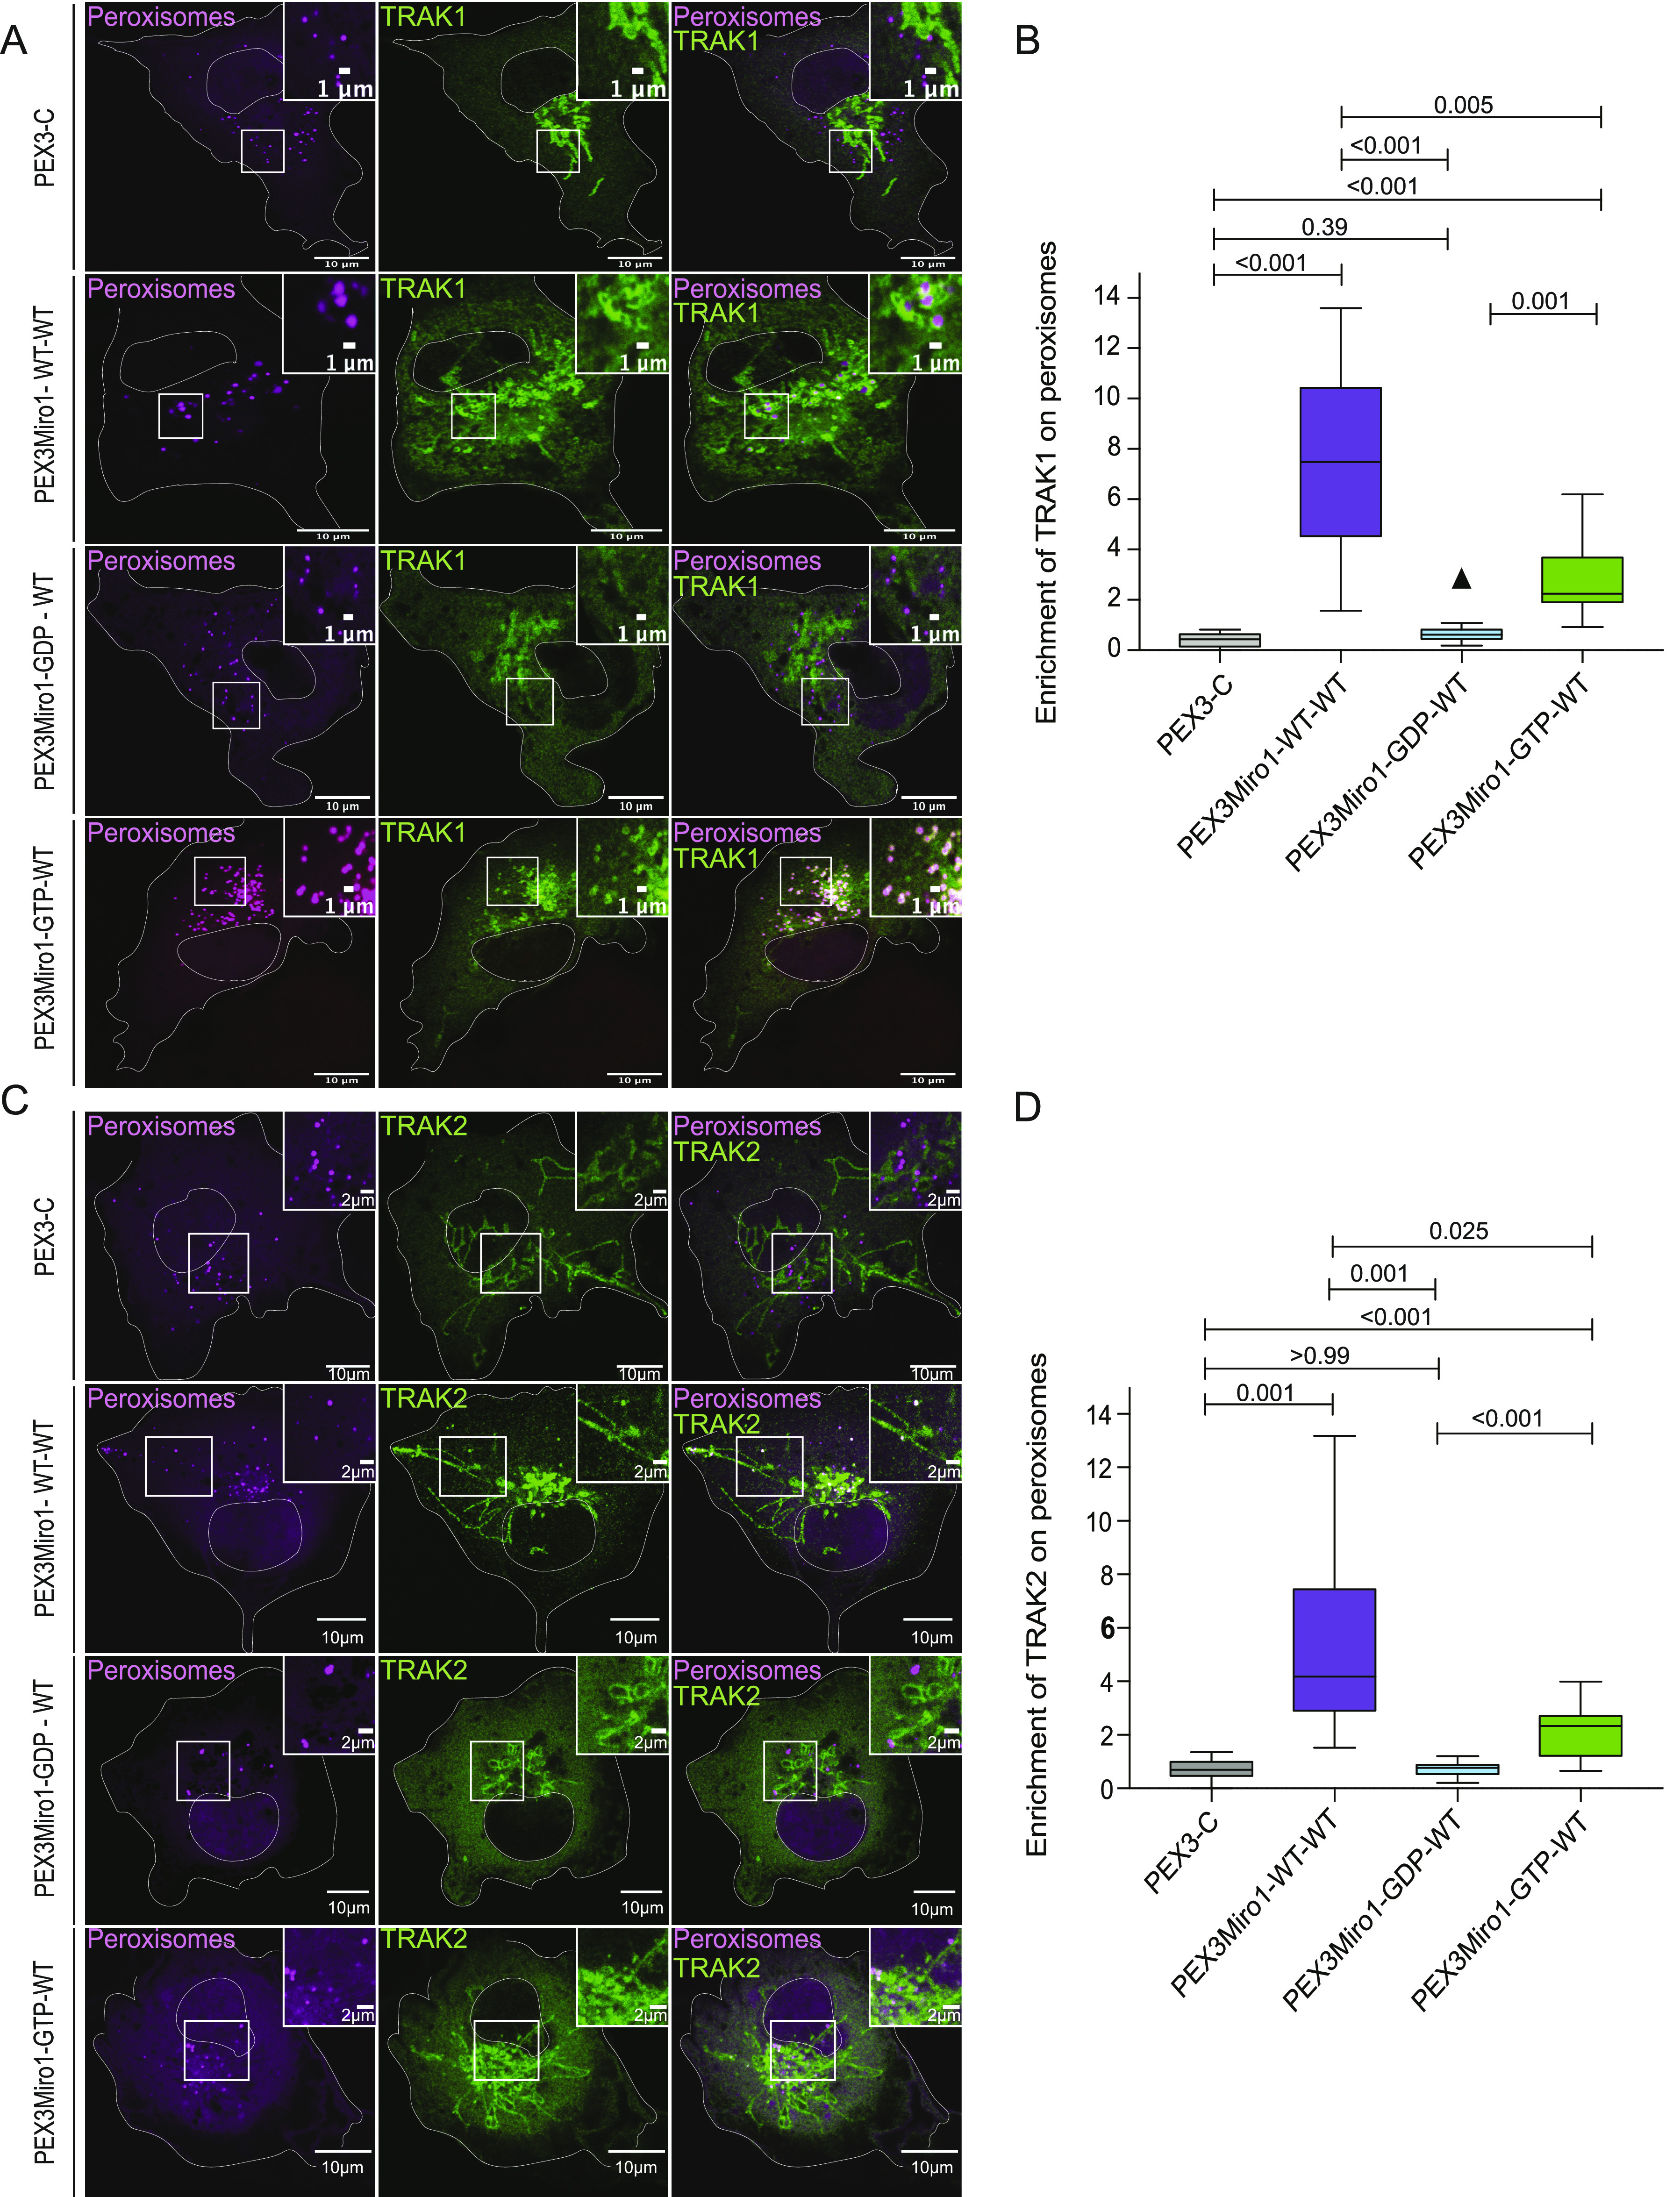
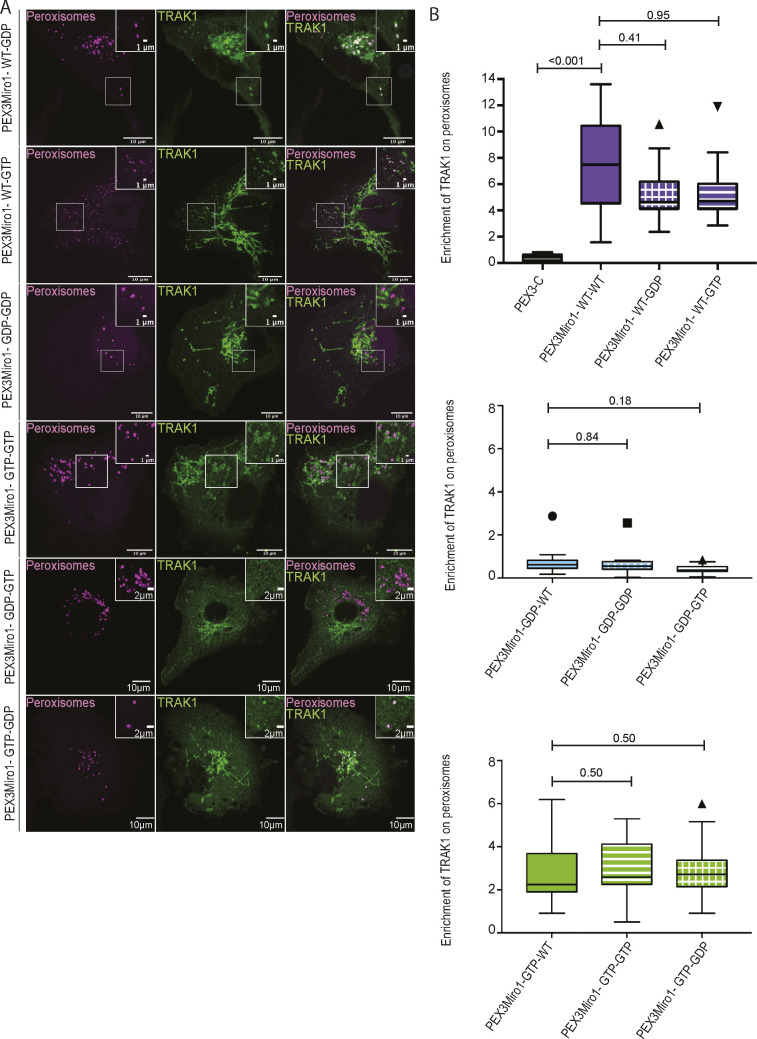
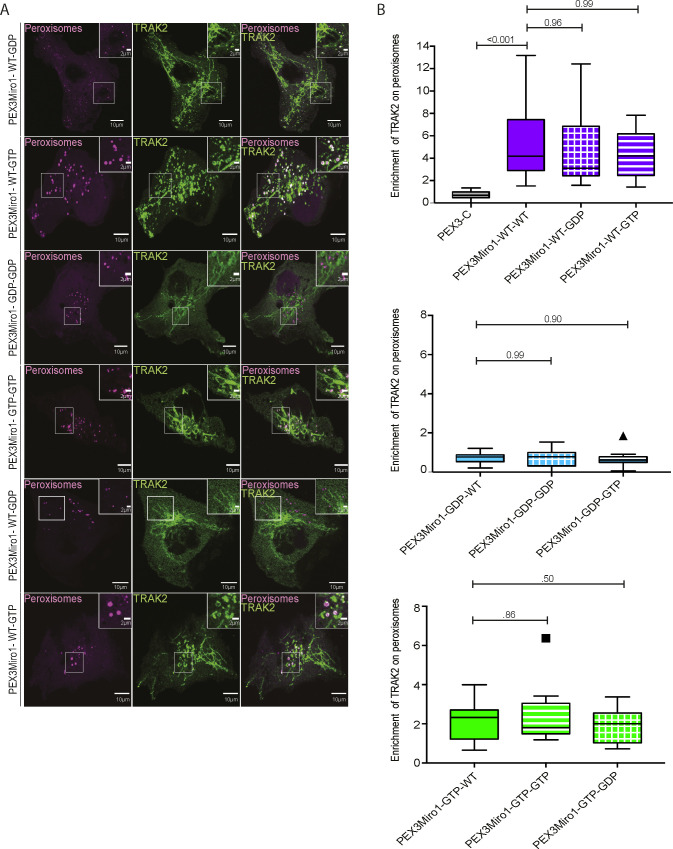
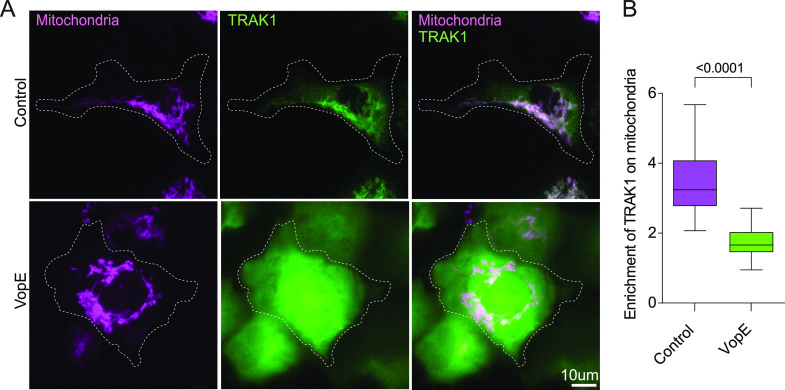
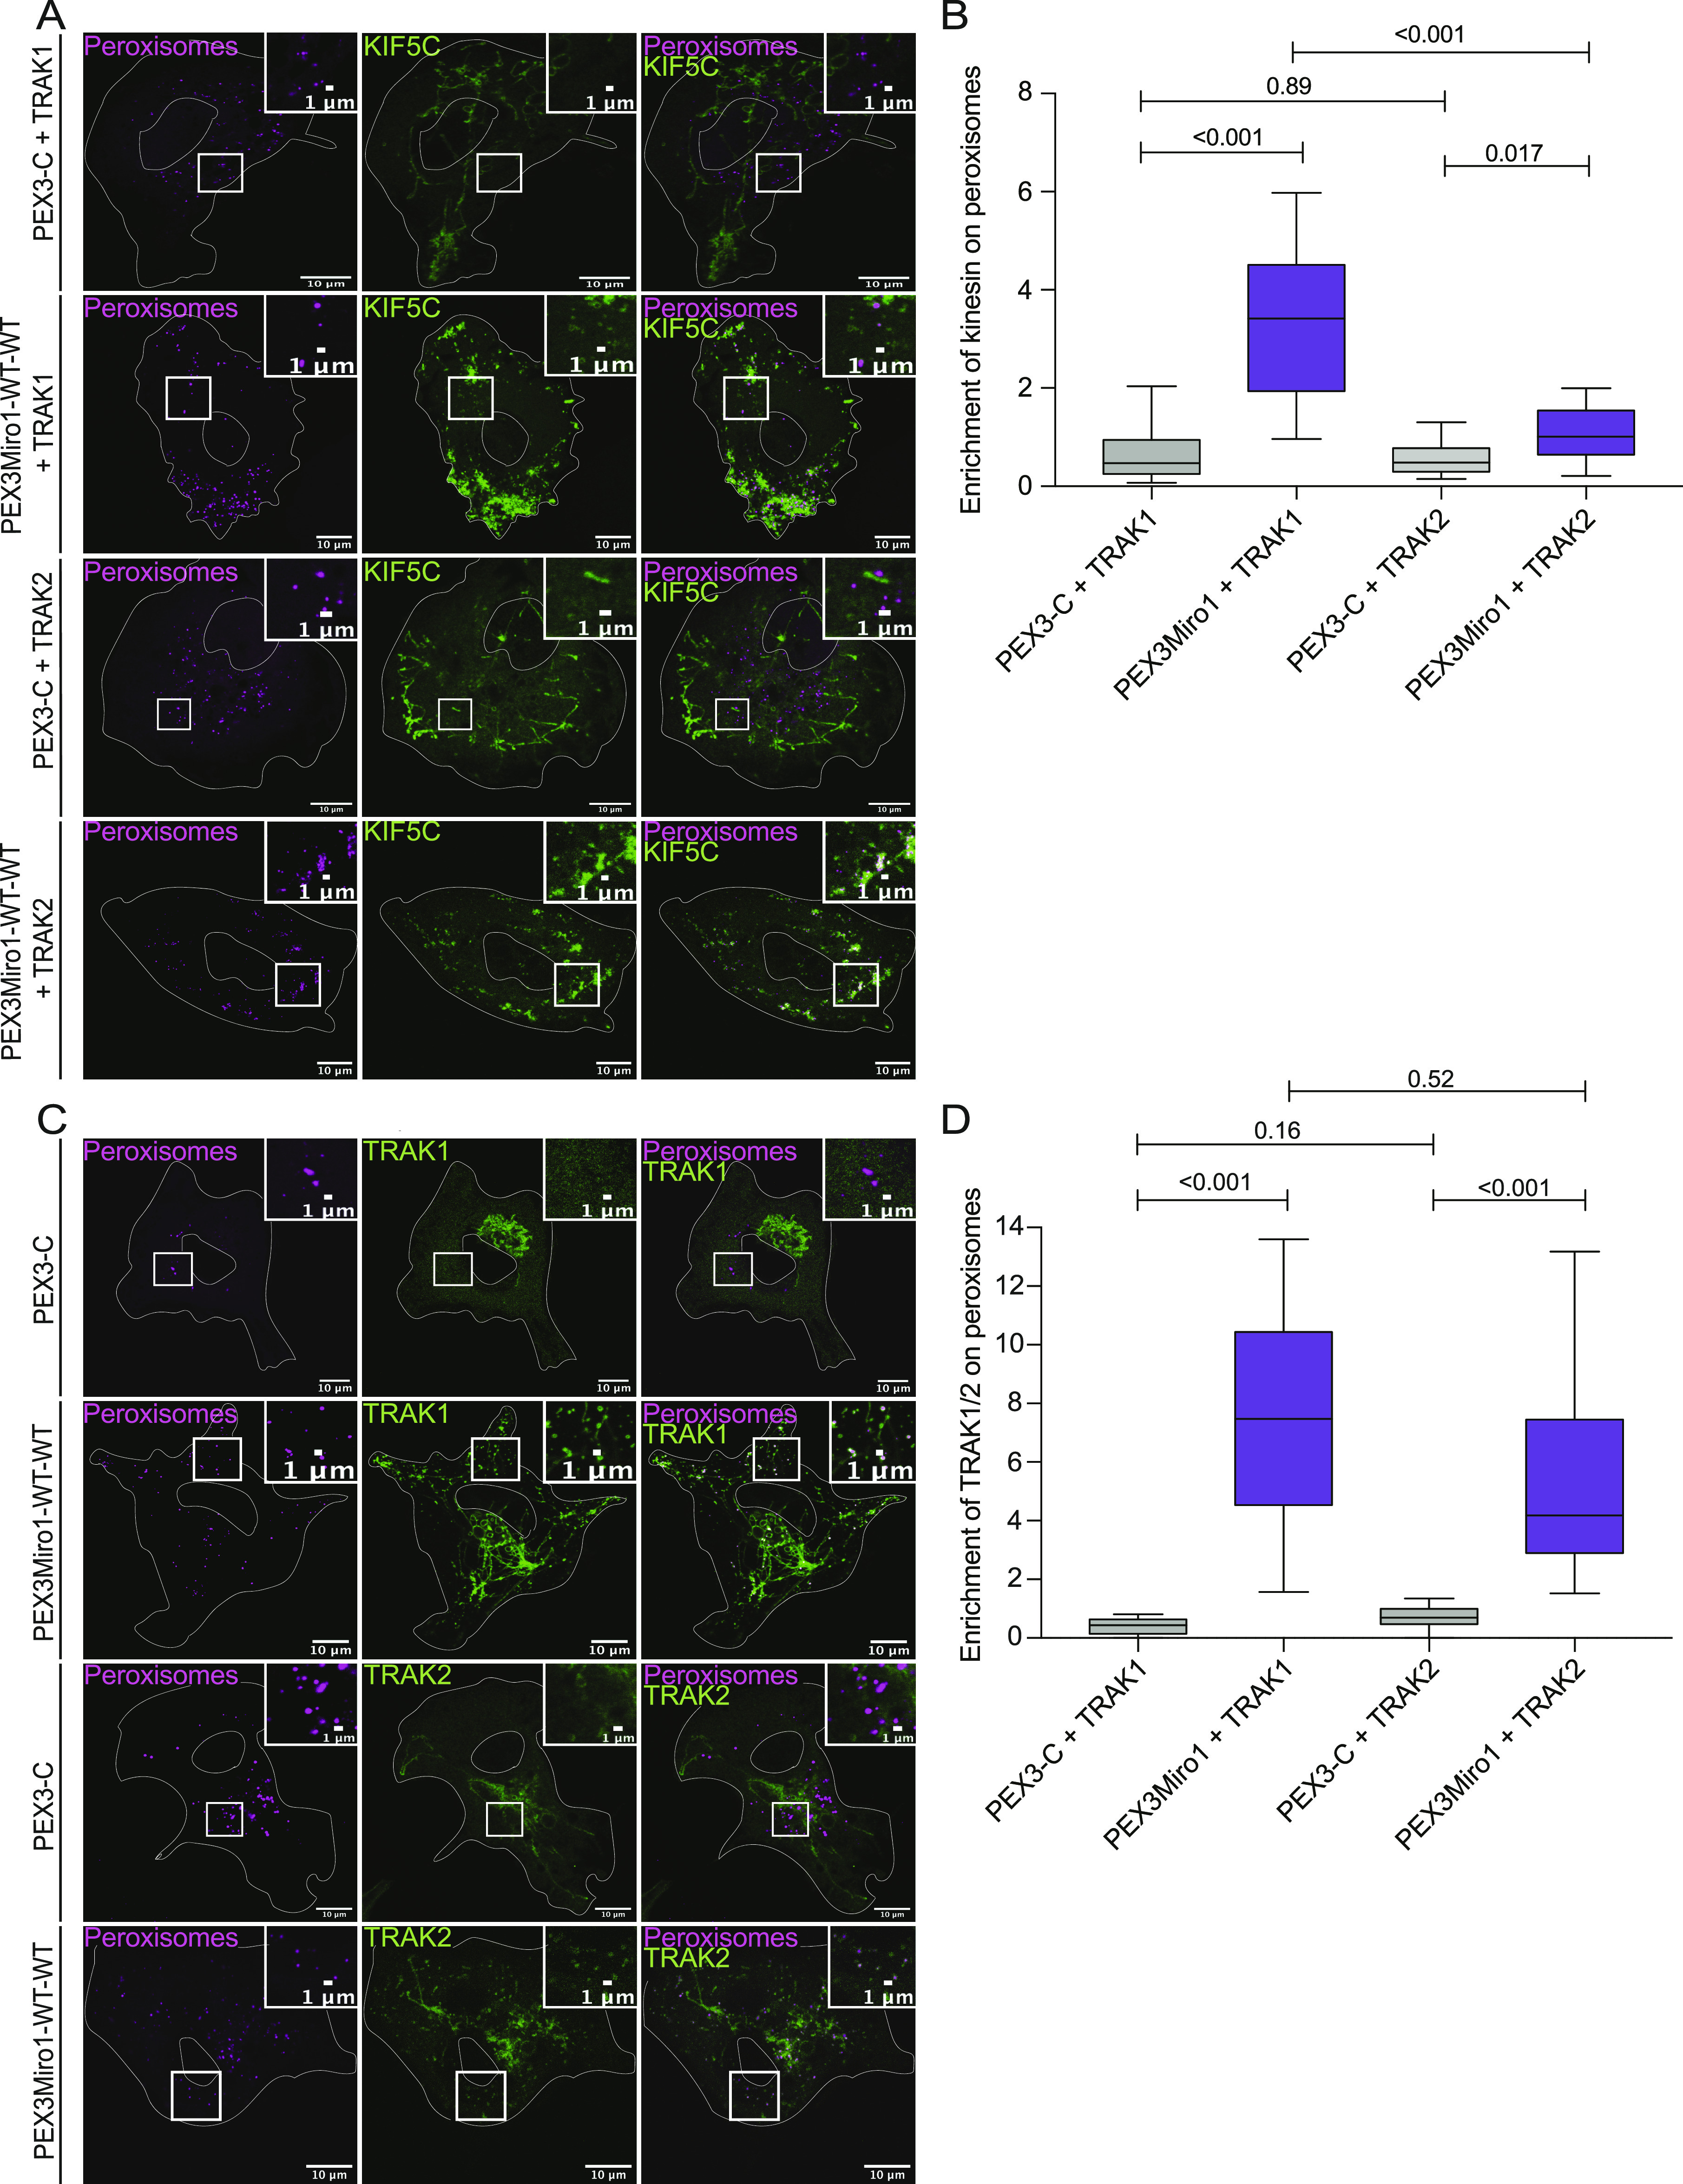
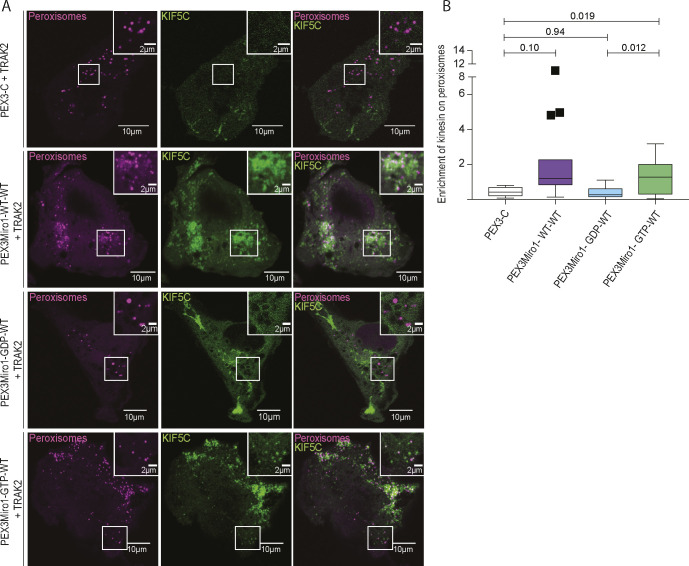
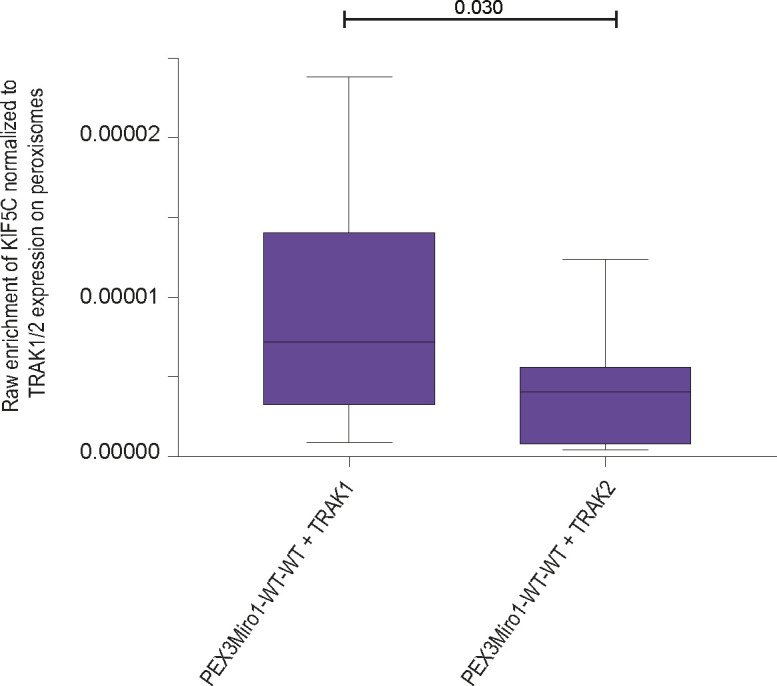
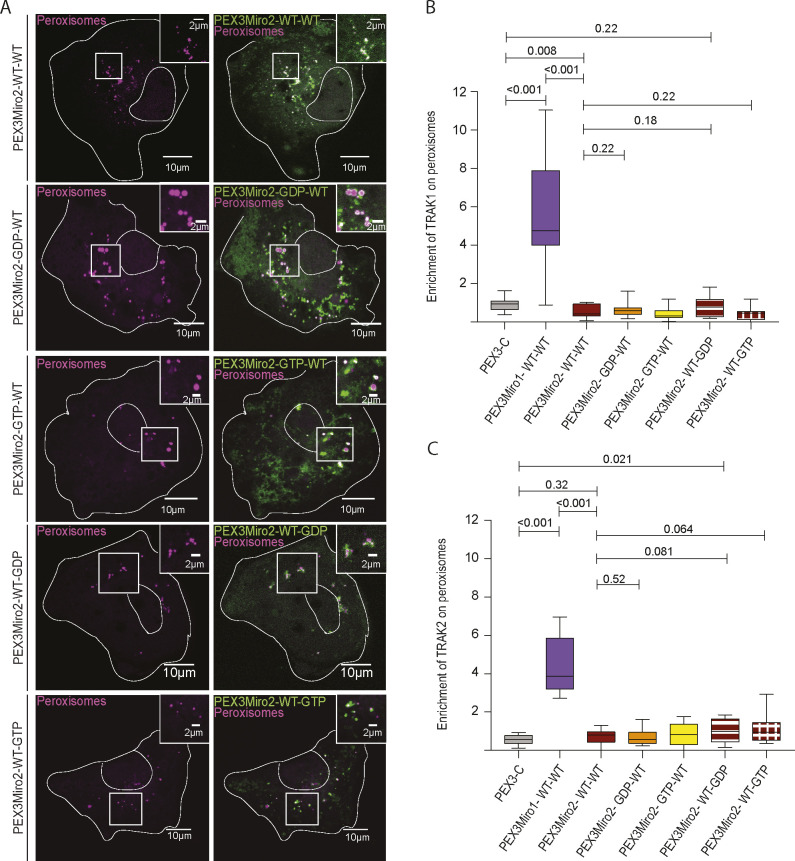
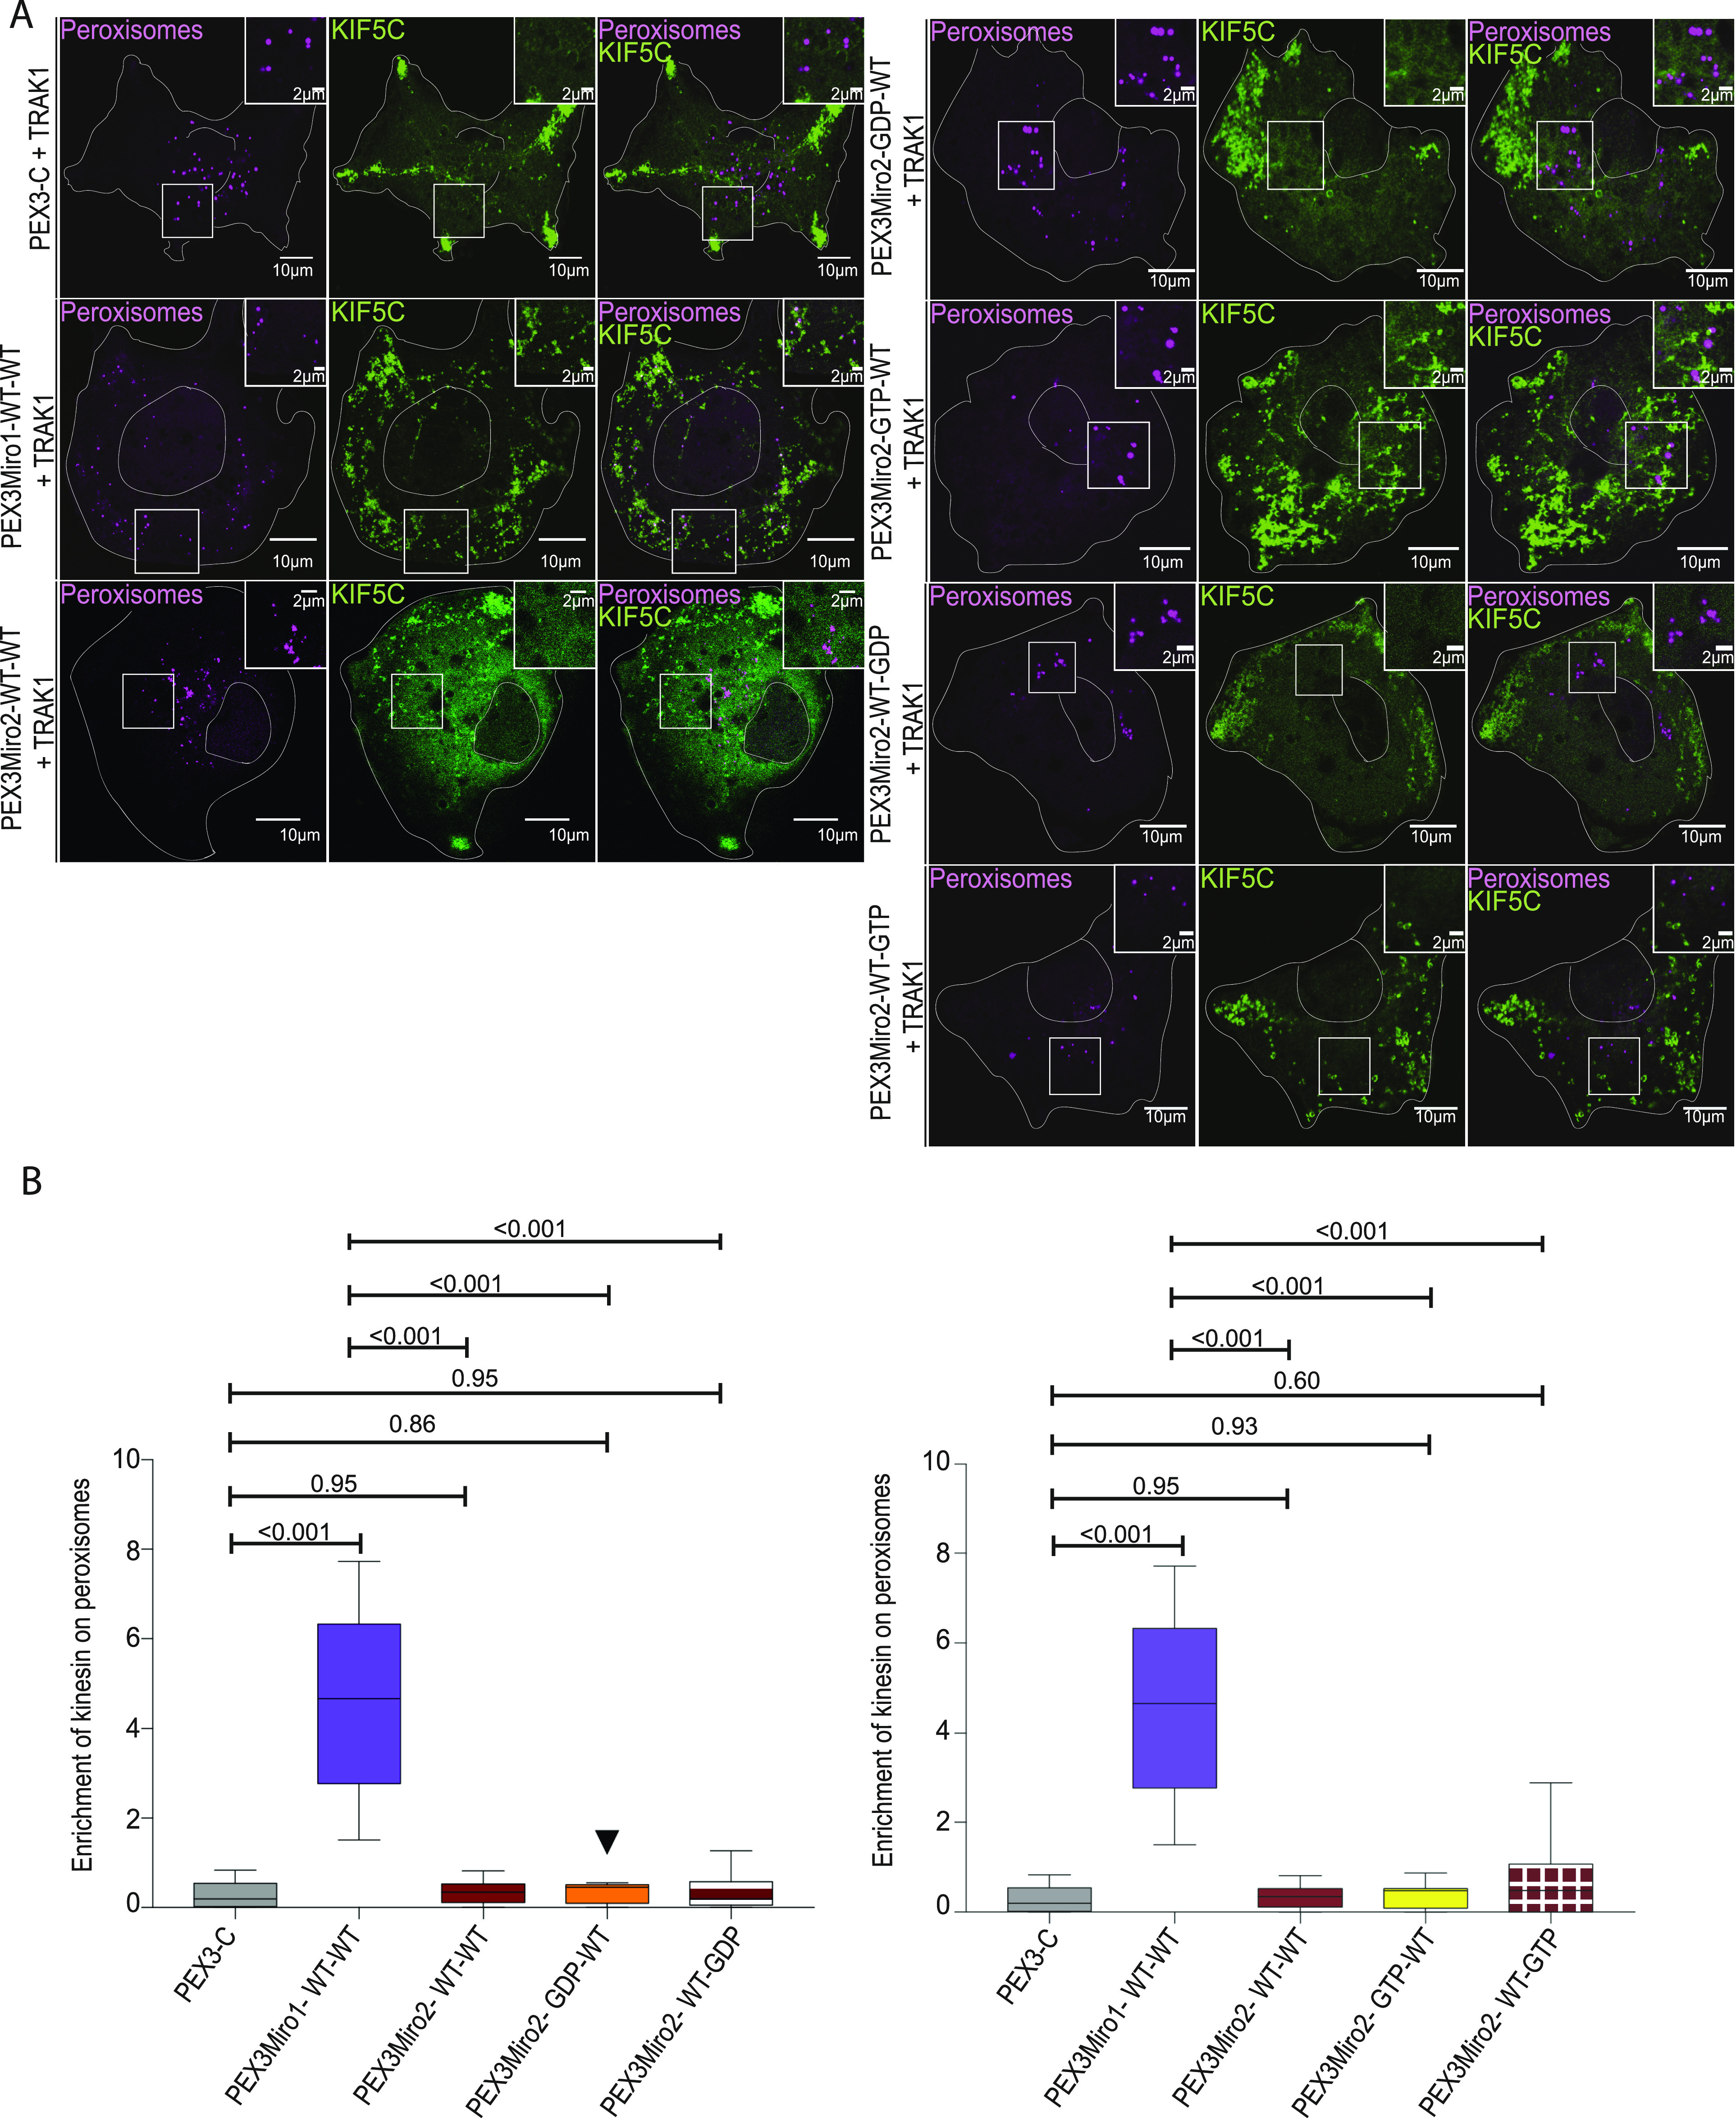
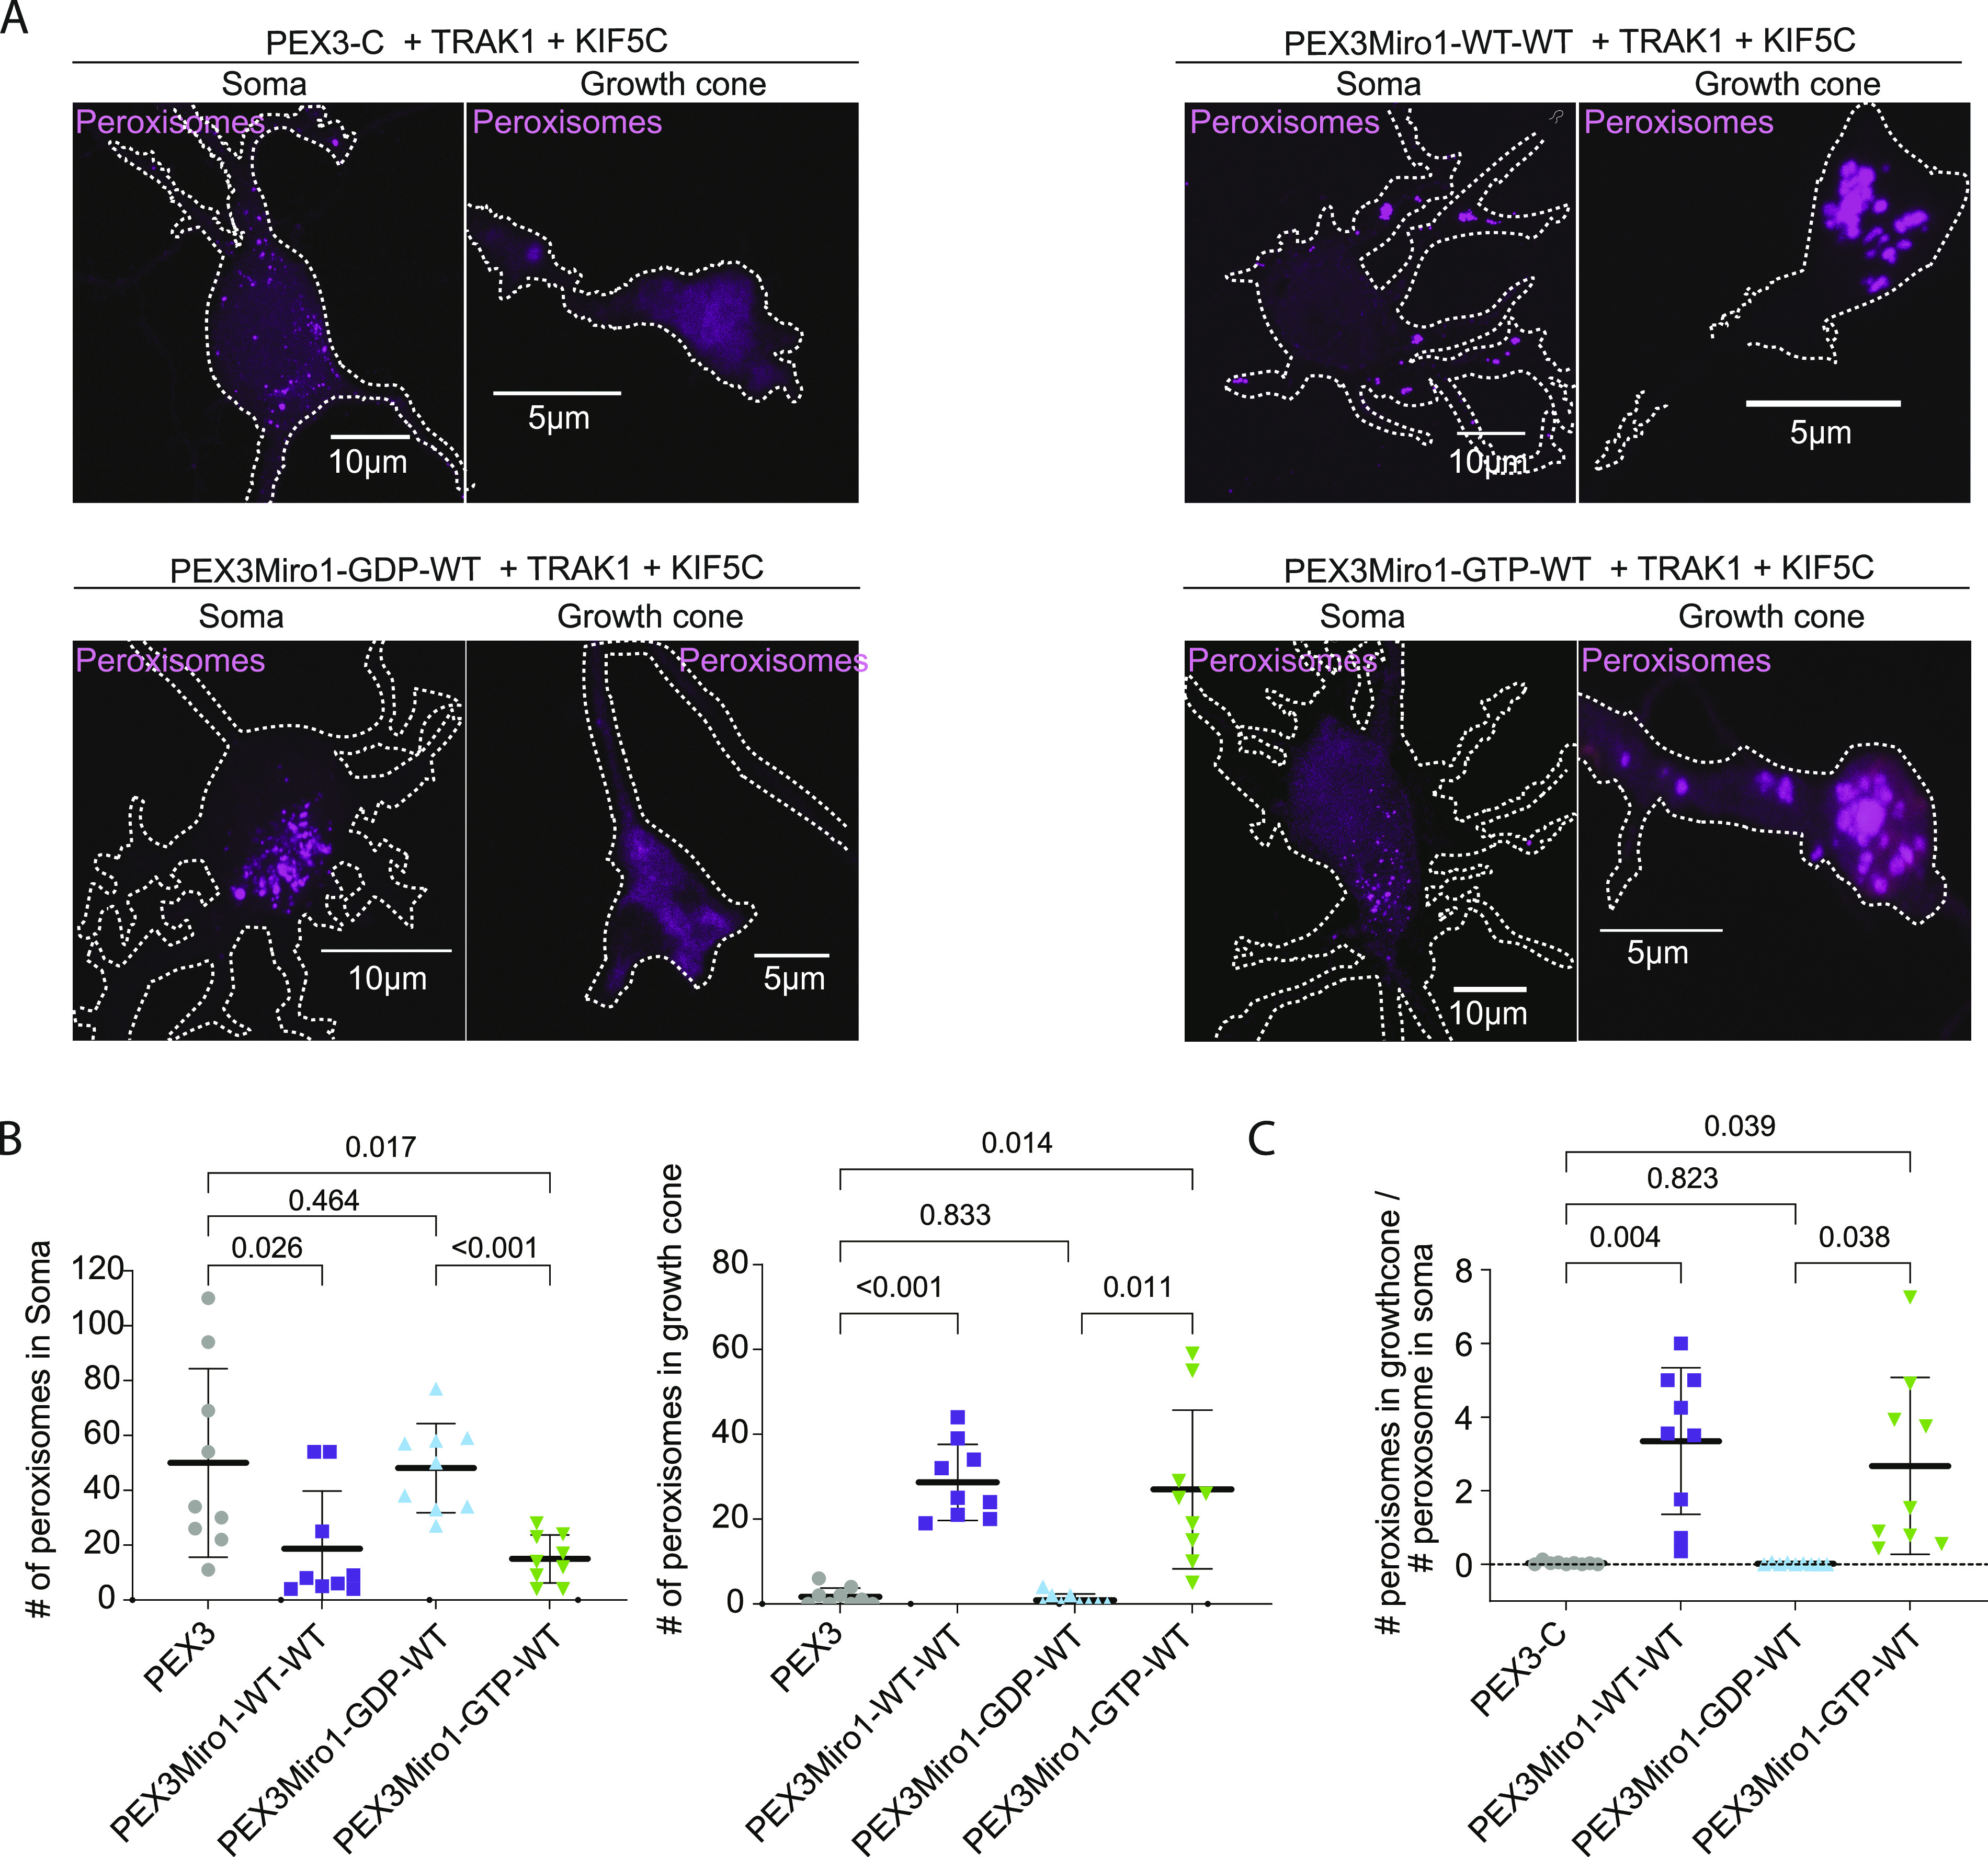
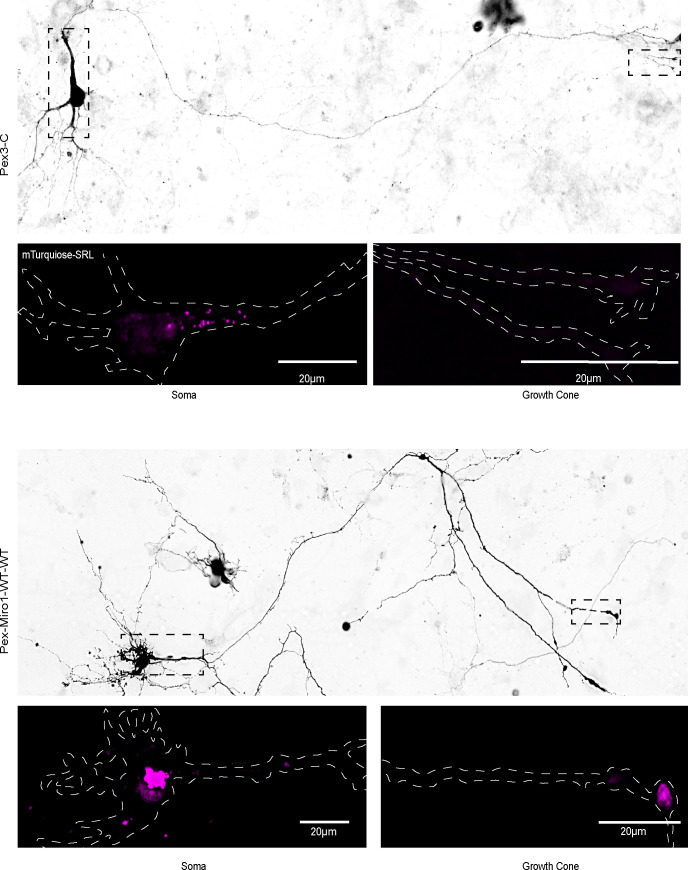
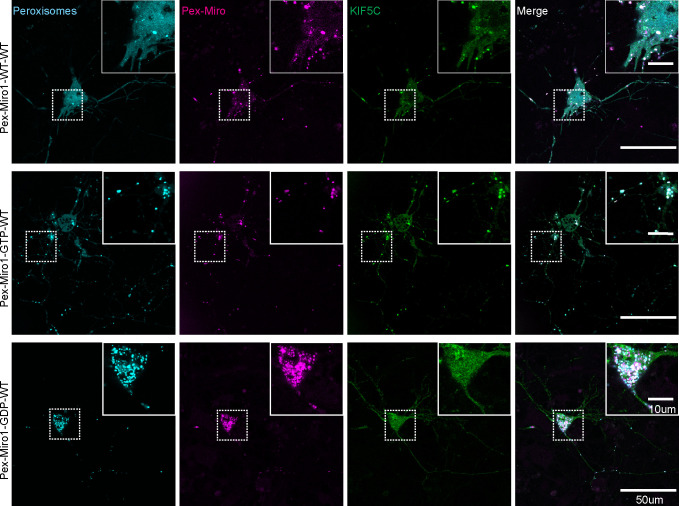
Mitochondrial transport relies on a motor-adaptor complex containing Miro1, a mitochondrial outer membrane protein with two GTPase domains, and TRAK1/2, kinesin-1, and dynein. Using a peroxisome-directed Miro1, we quantified the ability of GTPase mutations to influence the peroxisomal recruitment of complex components. Miro1 whose N-GTPase is locked in the GDP state does not recruit TRAK1/2, kinesin, or P135 to peroxisomes, whereas the GTP state does. Similarly, the expression of the MiroGAP VopE dislodges TRAK1 from mitochondria. Miro1 C-GTPase mutations have little influence on complex recruitment. Although Miro2 is thought to support mitochondrial motility, peroxisome-directed Miro2 did not recruit the other complex components regardless of the state of its GTPase domains. Neurons expressing peroxisomal Miro1 with the GTP-state form of the N-GTPase had markedly increased peroxisomal transport to growth cones, whereas the GDP-state caused their retention in the soma. Thus, the N-GTPase domain of Miro1 is critical for regulating Miro1's interaction with the other components of the motor-adaptor complex and thereby for regulating mitochondrial motility.


Conflict of interest statement

The authors declare that they have no conflict of interest.

Figures

Figure 1.
Figure 1.. PEX3Miro1 localizes to peroxisomes and, with TRAK1 overexpression, can localize KIF5C to peroxisomes.
(A) In COS-7 cells, expressed PEX3-6×His-mRFP (PEX3-C) or PEX3-6×His-mRFP-Miro1 (PEXMiro1) (green) co-localizes with the mTurquoise-SRL peroxisomal marker (magenta). Scale bar: 10 μm. Inset scale bar: 2 μm. (B) Schematic of the PEX3Miro1 construct recruiting TRAK1/2 and KIF5C to the surface of a peroxisome. (C) Expression of mTurquoise-SRL (magenta) with either PEX3-C or PEX3Miro1 and mCitrine-KIF5C (green) with or without the co-expression of myc-TRAK1 in COS-7 cells. The presence of PEX3-C and PEXMiro1 on peroxisomes was confirmed in each cell by imaging their RFP tags. Scale bar: 10 μm. Inset scale bar: 2 μm. (D) Quantification of the amount of KIF5C enriched on peroxisomes that carry PEX3-C control or PEX3Miro1 with or without the overexpression of myc-TRAK1. The quantifications here and subsequently are represented as “box-and-whisker” plots with the median value indicated. Outliers are represented as individual dots and are considered in statistical calculations. Here and in subsequent figures, P-values are indicated and were determined by one-way ANOVA with Dunnett’s T3 correction for multiple comparisons. (E) Distribution of peroxisomes marked with mTurquoise-SRL in the COS-7 cells analyzed in (D). Distance from the center of the cell in concentric shells was quantified using the DoveSonoPro FIJI macro (linked in the Materials and Methods section). N = 15 cells over three biological replicates. Error bars represent the SD. (F) PEX3-C or PEX3Miro1 was expressed in HEK293T cells along with myc-TRAK1 and mCitrine-KIF5C and co-immunoprecipitated using antibodies to the RFP tag on the PEX3-C and PEX3Miro1 constructs. Western blots were stained using anti-His, myc, and KIF5 antibodies. Data are from >3 biological replicates throughout. N = 15 for panels (A, C, D, E). The corner inserts show the enlargement of the boxed regions.
Figure S1.
Figure S1.. PEX3, PEX3Miro1, and PEX3Miro2 localization on peroxisomes and mitochondria.
(A) COS-7 cells were co-transfected with PEX3-C, PEX3Miro1, or PEX3Miro2 together with the peroxisomal marker mCitrine-PTS1 (green) and the mitochondrial marker Mito-mTurquoise (blue). The corner inserts show the enlargement of the boxed regions. Scale bar: 10 μm. Inset scale bar: 1 μm. (B) From cells as in (A), the quantification of the RFP tags on PEX3-C and PEX3Miro that co-localized with the peroxisomal and mitochondrial markers. The data are represented as “box-and-whisker” plots with the median value indicated. The indicated P-values were obtained from one way-ANOVA with Dunnett’s T3 correction for multiple comparisons. N = 15 cells over three biological replicates. (C) PEX3Miro1 (green) localized appropriately to peroxisomes (magenta) despite mutations in the GTPase domain. The cells shown are the same as those in Fig 2A. The localization of KIF5C in Fig 2A is identical to that of PEX3Miro1 except in cells expressing PEX3Miro1 GDP-WT, where the KIF5C no longer co-localizes with the Miro construct and the peroxisomal marker.
Figure 2.
Figure 2.. GTPase domains of Miro1 regulate co-localization with KIF5C on peroxisomes.
(A) Expression in COS-7 cells of mTurquoise-SRL (magenta), myc-TRAK1, and mCitrine-KIF5C (green) with either PEX3Miro1 wild-type or PEX3Miro1 carrying a mutation of either the N- or C-GTPase domains: N-GDP-state T18N, N-GTP-state P13V, C-GDP-state S432N, and C-GTP-state K427N. The presence of the PEXMiro1 constructs on peroxisomes was confirmed in each cell by imaging their RFP tags. The corner inserts show the enlargement of the boxed regions. Here and in subsequent figures, the status of the two GTPase domains is abbreviated as either WT, GTP, or GDP for first the N-domain and then the C-domain. Scale bar: 10 μm. Inset scale bar: 2 μm. (B) Quantification of the amount of KIF5C enriched on peroxisomes carrying PEX3-C and the constructs shown in (A). For clarity, the mutations of the N-GTPase domain (above) are plotted separate from those of the C-GTPase (below) although transfected and imaged in the same experiments with the same controls. The quantification is represented as “box-and-whisker” plots with the median value indicated. Outliers are represented as single plot points and are included in all statistical calculations. P-values were determined by one-way ANOVA with Dunnett’s T3 correction for multiple comparisons. N = 15 cells over three biological replicates. (C) Quantification of peroxisomal distribution in concentric shells radiating from the center of the cell in the same cells analyzed in (B), with separate plots for mutations of the N-GTPase (left) and C-GTPase (right) for clarity, as in (B). N = 15 cells over three biological replicates. Error bars represent the SD. The data for the negative control (PEX3C) and the positive control (PEX3Miro1-WT-WT) are repeated from Fig 1 for clarity and are from experiments conducted at the same time.
Figure 3.
Figure 3.. N-GTPase of Miro1 has a predominant influence on KIF5C recruitment.
(A) Expression of PEX3Miro1 N-GTPase and C-GTPase double mutants in which both domains were in either the GTP or the GDP state and its consequences for mCitrine-KIF5C (green) recruitment to peroxisomes (mTurquoise-SRL, magenta) with the co-expression of myc-TRAK1. The corner inserts show the enlargement of the boxed regions. Scale bar: 10 μm. Inset scale bar: 1 μm. (B) Expression of PEX3Miro1 N-GTPase and C-GTPase double mutants in which the two domains were in opposite states and its consequences for mCitrine-KIF5C (green) recruitment to peroxisomes (mTurquoise-SRL, magenta) with the co-expression of myc-TRAK1. In (A, B), the presence of the PEXMiro1 constructs on peroxisomes was confirmed in each cell by imaging their RFP tags. (C) Quantification of the amount of KIF5C enriched on cells transfected as in (A, B). If the N-GTPase is in the GDP-bound state (upper graph) or in the GTP-bound state (lower graph), the state of the C-GTPase has little or no effect, except for a modest enhancement of KIF5C recruitment when both domains are GTP-bound rather than only the N-GTPase. The quantification is represented as “box-and-whisker” plots with the median value indicated. Outliers are represented as single plot points and are included in all statistical calculations. Indicated P-values are determined by one-way ANOVA with Dunnett’s T3 correction for multiple comparisons. N = 15 cells over three biological replicates. (D) Quantification of the peroxisomal distribution from the cells imaged for (C). Error bars represent the SD. The data for the negative control (PEX3C) and the positive control (PEX3Miro1-WT-WT) are repeated from Fig 1 for clarity and are from experiments conducted at the same time.
Figure 4.
Figure 4.. GTPase domains of Miro1 regulate co-localization with P135.
(A) PEX3-C, PEX3Miro1, or PEX3Miro1 with mutations of either the N- or C-GTPase domains and with or without TRAK (as indicated) were expressed in COS-7 cells with mCitrine-P135 (green) and the peroxisomal marker mTurquoise-SRL (magenta). The presence of the PEXMiro1 constructs on peroxisomes was confirmed in each cell by imaging their RFP tags. The corner inserts show the enlargement of the boxed regions. Scale bar: 10 μm. Inset scale bar: 1 μm. (B, C, D) P135 co-localization with peroxisomes quantified from cells transfected as in (A) and represented as “box-and-whisker” plots with the median value indicated. Outliers are plotted as single points and are included in all statistical calculations. P-values were determined by one-way ANOVA with Dunnett’s T3 correction for multiple comparisons. N = 15 cells over three biological replicates. The data for the negative control (PEX3C) and the positive control (PEX3Miro1-WT-WT) are repeated in each graph for clarity and are from experiments conducted at the same time. (B) Quantification of the amount of P135 enriched on PEX3-C control or PEX3Miro1 peroxisomes with or without the expression of myc-TRAK1. (C) Quantification of the amount of P135 enriched on peroxisomes bearing PEX3Miro1 wild-type or the PEX3Miro1 N-GTPase mutants co-expressed with myc-TRAK1. (D) Quantification of the amount of P135 enriched on peroxisomes bearing PEX3Miro1 wild-type or the PEX3Miro1 C-GTPase mutants co-expressed with myc-TRAK1.
Figure 5.
Figure 5.. PEX3Miro1 N-GTPase regulates co-localization of TRAK1 and TRAK2 with PEX3Miro1.
(A) PEX3-C, PEX3Miro1, or PEX3Miro1 with N-GTPase GDP- and GTP-state mutants was expressed in COS-7 cells with mCitrine-TRAK1 (green) and mTurquoise-SRL (magenta). The presence of the PEXMiro1 and PEX3-C constructs on peroxisomes was confirmed in each cell by imaging their RFP tags. Scale bar: 10 μm. Inset scale bar: 1 μm. (B) From cells as in (A), the quantification of the amount of TRAK1 enriched on peroxisomes bearing PEX3-C, PEX3Miro1, and PEX3Miro1 N-GTPase mutants. (C) PEX3-C, PEX3Miro1, or PEX3Miro1 with N-GTPase GDP- and GTP-state mutants was expressed in COS-7 cells with mCitrine-TRAK2 (green) and mTurquoise-SRL (magenta). The presence of the PEXMiro1 constructs on peroxisomes was confirmed in each cell by imaging their RFP tags. Scale bar: 10 μm. Inset scale bar: 2 μm. (D) From cells as in (C), the quantification of the amount of TRAK2 enriched on peroxisomes bearing PEX3-C, PEX3Miro1, and PEX3Miro1 N-GTPase mutants. In (B, D), TRAK co-localization with peroxisomes is represented as “box-and-whisker” plots with the median value indicated. Outliers are plotted as single points and are included in all statistical calculations. The indicated P-values are from analysis with one-way ANOVA. N = 15 cells over three biological replicates. N = 15 for all panels. The corner inserts show the enlargement of the boxed regions.
Figure S2.
Figure S2.. PEX3Miro1 C-GTPase has little influence on the co-localization of TRAK1 and PEX3Miro1.
(A) PEX3Miro1, with the indicated mutations of the N- and C-GTPase domains, was co-expressed with mCitrine-TRAK1 (green) and mTurquoise-SRL (magenta) in COS-7 cells. The corner inserts show the enlargement of the boxed regions. Scale bar: 10 μm. Inset scale bar: marked as either 1 or 2 μm. (B) Quantification of the amount of TRAK1 enriched on peroxisomes transfected as in (A). The data are represented as “box-and-whisker” plots with the median value indicated. Outliers are represented as individual dots and are considered in all statistical calculations. The indicated P-values were determined by one-way ANOVA with Dunnett’s T3 correction for multiple comparisons. N = 15 cells over three biological replicates. All experiments were conducted and imaged in parallel except the GDP-GTP and GTP-GDP forms of PEXMiro1; they were performed together with controls that were consistent with the values of the other data shown.
Figure S3.
Figure S3.. PEX3Miro1 C-GTPase has little influence on the co-localization of TRAK2 and PEX3Miro1.
(A) PEX3Miro1, with the indicated mutations of the N- and C-GTPase domains, was co-expressed with mCitrine-TRAK2 (green) and mTurquoise-SRL (magenta) in COS-7 cells. The corner inserts show the enlargement of the boxed regions. Scale bar: 10 μm. Inset scale bar: 2 μm. (B) Quantification of the amount of TRAK2 enriched on peroxisomes transfected as in (A). The data are represented as “box-and-whisker” plots with the median value indicated. Outliers are represented as individual dots and are considered in all statistical calculations. The indicated P-values were determined by one-way ANOVA with Dunnett’s T3 correction for multiple comparisons. N = 15 cells over three biological replicates. All experiments were conducted and imaged in parallel except the GDP-GTP and GTP-GDP forms of PEXMiro1; they were performed together with controls that were consistent with the values of the other data shown.
Figure 6.
Figure 6.. MiroGAP VopE causes TRAK1 to dissociate from mitochondria.
(A) Representative images of COS-7 cells transfected with plasmids expressing mCitrine-TRAK1 (green) and mito-dsRED (magenta), and with or without a plasmid expressing VopE. Scale bar: 10 μm. (B) For each cell as in (A), the amount of TRAK1 present on mitochondria was quantified. The quantifications are represented as “Tukey’s box-and-whisker” plots with the median value indicated. The indicated P-value was derived from a two-tailed t test with Welsh’s correction. N = 100 cells from four independent experiments.
Figure 7. Both
Figure 7. Both. TRAK1 and TRAK2 serve as adaptors for KIF5C but differ in their ability to recruit KIF5C.
(A) Either myc-TRAK1 or myc-TRAK2 was expressed in COS-7 cells together with mCitrine-KIF5C (green), mTurquoise-SRL (magenta), and PEX3-C or PEX3Miro1. The presence of the PEX3Miro1 or PEX3-C constructs on peroxisomes was confirmed in each cell by imaging their RFP tags. The corner inserts show the enlargement of the boxed regions. Scale bar: 10 μm. Inset scale bar: 1 μm. (B) From cells transfected as in (A), quantification of the amount of KIF5C enriched on peroxisomes with either myc-TRAK1 or myc-TRAK2. (C) Either mCitrine-TRAK1 or mCitrine-TRAK2 (green) was expressed in COS-7 cells together with mTurquoise-SRL (magenta) and PEX3-C or PEX3Miro1. The presence of the PEX3Miro1 and PEX3-C constructs on peroxisomes was confirmed in each cell by imaging their RFP tags. Scale bar: 10 μm. Inset scale bar: 1 μm. (D) From cells transfected as in (C), the quantification of the amount of mCitrine-TRAK1 or mCitrine-TRAK2 enriched on peroxisomes. In (B, D), co-localization with peroxisomes is represented as “box-and-whisker” plots with the median value indicated. The indicated P-values were determined by one-way ANOVA with Dunnett’s T3 correction for multiple comparisons. N = 15 cells over three biological replicates.
Figure S4.
Figure S4.. PEX3Miro1 N-GTPase regulates co-localization of KIF5C in the presence of TRAK2.
(A) Either wild-type or N-GTPase mutations of PEX3Miro were expressed in COS-7 cells together with myc-TRAK2, mCitrine-KIF5C (green), and mTurquoise-SRL (magenta). Expression of PEX3Miro constructs on peroxisomes was confirmed by visualization of their RFP tags. The corner inserts show the enlargement of the boxed regions. Scale bar: 10 μm. Inset scale bar: 2 μm. (B) From cells as in (A), the quantification of mCitrine-KIF5C on peroxisomes. The data are represented as “box-and-whisker” plots with the median value indicated. The indicated P-values were determined by one-way ANOVA with Dunnett’s T3 correction for multiple comparisons. Outliers are represented as single plot points and are included in all statistical calculations. N = 15 cells over three biological replicates.
Figure S5.
Figure S5.. TRAK1 and TRAK2 differ in their recruitment of KIF5C to peroxisomes.
COS-7 cells were transfected with mTurquoise-KIF5C, PEX3Miro1, and either mCitrine-TRAK1 or mCitrine-TRAK2. The amount of mTurquoise on peroxisomes was normalized to the intensity of mCitrine on peroxisomes to determine the relative efficacy of the two TRAKs isoforms for recruiting KIF5C. The data are represented as “box-and-whisker” plots with the median value indicated. The indicated P-value was obtained from the two-tailed unpaired t test with Welch’s correction. N = 15 cells over three biological replicates.
Figure S6.
Figure S6.. PEX3Miro2 does not recruit TRAK1 or TRAK2 to peroxisomes.
(A) PEX3Miro2 (green) localized appropriately to peroxisomes (magenta). The cells shown are the same as those expressing PEX3Miro2 in Fig 8A. Scale bar: 10 μm. Inset scale bar: 2 μm. (B, C) Quantification of the amount of mCitrine-TRAK1 (B) or mCitrine-TRAK2 (C) enriched on peroxisomes carrying PEX3-C, PEX3Miro1, PEX3Miro2, or the PEX3Miro2 GTPase mutant constructs as indicated on the x-axis. Peroxisomes were marked with mTurquoise-SRL. The quantification is represented as “box-and-whisker” plots with the median value indicated. Outliers have been removed from this data set using the ROUT method (Q = 1%) and are not included in statistical calculations. Indicated P-values were determined by one-way ANOVA with Dunnett’s T3 correction for multiple comparisons. N = 15 cells over three biological replicates.
Figure 8.
Figure 8.. PEX3Miro2 does not recruit KIF5C to peroxisomes.
(A) Expression in COS-7 cells of mTurquoise-SRL (magenta), myc-TRAK1, and mCitrine-KIF5C (green) with either PEX3-C, PEX3Miro1, PEX3Miro2, or PEX3Miro2 carrying a mutation of either the N- or C-GTPase domains: N-GDP-state T18N, N-GTP-state A13V, C-GDP-state S430N, and C-GTP-state A425V. The presence of the PEX3Miro2 constructs on peroxisomes was confirmed in each cell by imaging their RFP tags. The corner inserts show the enlargement of the boxed regions. Scale bar: 10 μm. Inset scale bar: 2 μm. (B) Quantification of the amount of KIF5C enriched on peroxisomes carrying the constructs shown in (A). For clarity, the mutations to GDP state and GTP state are plotted separately. The quantification is represented as “box-and-whisker” plots with the median value indicated. Outliers have been removed from this data set using the ROUT method (Q = 1%) and are not included in statistical calculations. Indicated P-values were determined by one-way ANOVA with Dunnett’s T3 correction for multiple comparisons. N = 15 cells over three biological replicates.
Figure S7.
Figure S7.. PEX3Miro2 interacts with Myo19 and its MyMOMA domain.
(A) PEX3-C or PEX3Miro2 was expressed in HEK293T cells together with GFP or Myo19-GFP and co-immunoprecipitated using anti-GFP. Western blots were stained using anti-His to recognize the 6×His tag in the PEX3-C and PEX3Miro2 constructs, with anti-GFP to recognize Myo19, and with anti-GAPDH. (B) PEX3-C or PEX3Miro2 was expressed in HEK293T cells together with GFP or MyMOMA-GFP and immunoprecipitated and analyzed as above. To better detect PEXMiro2 co-IP, a longer exposure is also shown. The data are representative of three biological replicates.
Figure 9.
Figure 9.. PEX3Miro1-dependent redistribution of peroxisomes in hippocampal neurons is regulated by the N-GTPase.
(A) Expression of mTurquoise-SRL peroxisomal marker (magenta) with either PEX3 control, wild-type PEX3Miro1, or PEX3Miro1 N-GTPase mutants together with myc-TRAK1 (signal not shown) and mCitrine-KIF5C (signal not shown) in soma and growth cone of rat hippocampal neurons. Cells were fixed at DIV5. Scale bar: for soma panel, 10 μm; and for growth cone panel, 5 μm. (B) Quantification of the distribution of peroxisomes from neurons as in (A). For each neuron, peroxisomes within a single representative growth cone or soma were counted. All data points are plotted, N = 9 neurons from three independent experiments. For each data set, the line indicates mean, and the whisker indicates SD. The indicated P-values were obtained by one-way ANOVA with Dunnett’s T3 correction for multiple comparisons. (C) Quantification of the distribution of peroxisomes from neurons as in (A). For each neuron, peroxisomes within a single representative growth cone were counted and then expressed as a ratio relative to the number of peroxisomes in the soma of that neuron. All data points are plotted, N = 9 neurons from three independent experiments. The indicated P-values were obtained by one-way ANOVA with Dunnett’s T3 correction for multiple comparisons.
Figure S8.
Figure S8.. Examples of neurons from which the somatic and growth cone levels of peroxisomes were quantified.
Neurons were transfected as in Fig 9, that is, with a PEX3-C or a PEX3Miro1 construct, along with mTurquoise-SRL, myc-TRAK1, and mCitrine-KIF5. The mTurquoise-SRL marker was used to visualize the distribution of peroxisomes throughout the neurons and enabled the peroxisomal counts in the soma and growth cone in Fig 9. The mCitrine-KIF5C signal was used to get a low-resolution image of the entire cell. Representative neurons expressing PEX3-C and PEX3Miro1-WT-WT are shown. Upper panels show a full neuron. The soma and growth cone whose peroxisomal signals appear below are marked (dotted lines). Scale bar: 20 μm.
Figure S9.
Figure S9.. Recruitment of KIF5C to neuronal peroxisomes depends on the N-GTPase.
Representative images of neurons transfected with the indicated form of PEX3Miro1, myc-TRAK1, mCitrine-KIF5C, and mTurquoise-SRL (peroxisomal marker). These neurons were among those whose peroxisomal distribution was quantified in Fig 9, and consistent with the redistribution of peroxisomes in that figure, the WT and GTP-locked forms of the N-GTPase recruited KIF5C to peroxisomes, but the GDP-bound form did not. Scale bar: 50 μm. Inset scale bar: 10 μm.

Similar articles

Cited by

References

    1. Abdul KM, Terada K, Yano M, Ryan MT, Streimann I, Hoogenraad NJ, Mori M (2000) Functional analysis of human metaxin in mitochondrial protein import in cultured cells and its relationship with the Tom complex. Biochem Biophys Res Commun 276: 1028–1034. 10.1006/bbrc.2000.3589 - DOI - PubMed
    1. Armstrong LC, Komiya T, Bergman BE, Mihara K, Bornstein P (1997) Metaxin is a component of a preprotein import complex in the outer membrane of the mammalian mitochondrion. J Biol Chem 272: 6510–6518. 10.1074/jbc.272.10.6510 - DOI - PubMed
    1. Babic M, Russo GJ, Wellington AJ, Sangston RM, Gonzalez M, Zinsmaier KE (2015) Miro’s N-terminal GTPase domain is required for transport of mitochondria into axons and dendrites. J Neurosci 35: 5754–5771. 10.1523/jneurosci.1035-14.2015 - DOI - PMC - PubMed
    1. Basu H, Pekkurnaz G, Falk J, Wei W, Chin M, Steen J, Schwarz TL (2021) FHL2 anchors mitochondria to actin and adapts mitochondrial dynamics to glucose supply. J Cell Biol 220: e201912077. 10.1083/jcb.201912077 - DOI - PMC - PubMed
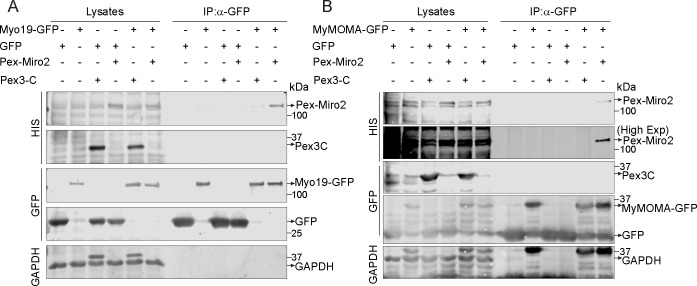
    1. Bocanegra JL, Fujita BM, Melton NR, Cowan JM, Schinski EL, Tamir TY, Major MB, Quintero OA (2020) The MyMOMA domain of MYO19 encodes for distinct Miro-dependent and Miro-independent mechanisms of interaction with mitochondrial membranes. Cytoskeleton (Hoboken) 77: 149–166. 10.1002/cm.21560 - DOI - PMC - PubMed

Publication types

MeSH terms

LinkOut - more resources