. 2022 Oct 27;13(1):6401.
doi: 10.1038/s41467-022-33746-3.

The oncogenic fusion protein DNAJB1-PRKACA can be specifically targeted by peptide-based immunotherapy in fibrolamellar hepatocellular carcinoma

Affiliations

The oncogenic fusion protein DNAJB1-PRKACA can be specifically targeted by peptide-based immunotherapy in fibrolamellar hepatocellular carcinoma

Jens Bauer et al. Nat Commun. .

Abstract

The DNAJB1-PRKACA fusion transcript is the oncogenic driver in fibrolamellar hepatocellular carcinoma, a lethal disease lacking specific therapies. This study reports on the identification, characterization, and immunotherapeutic application of HLA-presented neoantigens specific for the DNAJB1-PRKACA fusion transcript in fibrolamellar hepatocellular carcinoma. DNAJB1-PRKACA-derived HLA class I and HLA class II ligands induce multifunctional cytotoxic CD8+ and T-helper 1 CD4+ T cells, and their cellular processing and presentation in DNAJB1-PRKACA expressing tumor cells is demonstrated by mass spectrometry-based immunopeptidome analysis. Single-cell RNA sequencing further identifies multiple T cell receptors from DNAJB1-PRKACA-specific T cells. Vaccination of a fibrolamellar hepatocellular carcinoma patient, suffering from recurrent short interval disease relapses, with DNAJB1-PRKACA-derived peptides under continued Poly (ADP-ribose) polymerase inhibitor therapy induces multifunctional CD4+ T cells, with an activated T-helper 1 phenotype and high T cell receptor clonality. Vaccine-induced DNAJB1-PRKACA-specific T cell responses persist over time and, in contrast to various previous treatments, are accompanied by durable relapse free survival of the patient for more than 21 months post vaccination. Our preclinical and clinical findings identify the DNAJB1-PRKACA protein as source for immunogenic neoepitopes and corresponding T cell receptors and provide efficacy in a single-patient study of T cell-based immunotherapy specifically targeting this oncogenic fusion.


Conflict of interest statement

J.B., N.K., Y.M., M.Z., S.D., M. Boerries, and J.S.W. are listed as inventors on a patent related to the DNAJB1-PRKACA T cell epitopes and TCRs (Peptides and antigen binding proteins for use in immunotherapy against fibrolamellar HCC and other cancers, Application number: EP21214728.4). H.-G.R. is listed as an inventor on a patent related to the adjuvant XS15 (Adjuvant for the induction of a cellular immune response: DE102016005550.2). The other authors declare no competing interests.

Figures
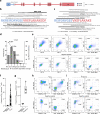
Fig. 1
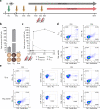
Fig. 1. Prediction of DNAJB1-PRKACA fusion protein-derived HLA class I and HLA class II ligands and characterization of DNAJB1-PRKACA-derived T cell epitopes.
a Overview of the DNAJB1-PRKACA fusion transcript with exon 1 from DNAJB1 and exon 2–10 from PRKACA. b HLA class II ligands from the DNAJB1-PRKACA protein fusion region indicating in gray and black in silico predicted and MS-identified ligands, respectively. Continuous lines illustrate the 9 amino acid binding cores, dashed lines the up to 15mer HLA ligand extensions. Allele numbers depict the number of HLA alleles, which are predicted to bind the respective core sequence. c HLA class I ligands from the DNAJB1-PRKACA protein fusion region indicating in gray in silico predicted, in black-bordered HLA refolded, and in black MS-identified ligands. d HLA allotype population coverage with predicted HLA class I epitopes within the long PII-1 of the DNAJB1-PRKACA fusion compared to the European population. The frequencies of individuals within the European population carrying up to six HLA class I allotypes (x-axis) are indicated as gray bars on the left y-axis. The cumulative percentage of population coverage is depicted as black dots on the right y-axis. e Representative example of flow cytometry-based functional characterization (n = 3) with indicated cytokines and surface markers of PII-1-specific CD4+ T cells derived from a healthy volunteer (HV) 8 after de novo priming with PII-1-loaded mature moDCs (upper panel). The negative control presents PII-1-primed CD4+ T cells stimulated with a negative peptide (lower panel). f, g Absolute frequencies of peptide-specific CD8+ T cells of CD8+ T cells primed with the PA*24 or the PA*68/A*02, and CD8+ T cells primed with an HLA-matched negative peptide, each dot represents the absolute frequency in one primed well. f PA*24-specific CD8+ T cells of HV1, HV2, HV6, HV7, and HV9 (n = 5). g PA*68/A*02-specific CD8+ T cells of HV10 (n = 1). For boxplots, all data points are shown, the band indicates the median, and the box indicates the first and third quartiles. h, i Representative example of IFN-γ and TNF production, as well as CD107a expression of peptide-specific CD8+ T cells after aAPC-priming, stimulated with an HLA-matched negative peptide (lower panel) compared to h, PA*24 for HV2 (n = 8) or i, PA*68/A*02 for HV10 (n = 1) (upper panel). Source data are provided as a Source Data file.
Fig. 2
Fig. 2. In-depth characterization of DNAJB1-PRKACA-specific CD8+ T cells and single-cell TCR sequencing.
a Heat map of single-cell RNA sequencing analysis of flow cytometry-based bulk sorted PA*24-specific CD8+ T cells of a healthy volunteer (HV) 1 and HV2 after aAPC-based priming with HLA-A*24-PA*24-monomer, showing log normalized gene expression for selected activated T cell markers. b Specific cell lysis by PA*24-specific CD8+ T cells from HV2, of PA*24-loaded autologous CD8- target cells (gray fill, dashed line (upper panel); red line (lower panel)) at various effector-to-target cell ratios compared to negative peptide-loaded autologous CD8- target cells (white fill, solid line (upper panel)). PA*24-unspecific CD8+ T cells showed no lysis of the target cells (black line (lower panel). Results are shown for three independent technical replicates. c Flow cytometry-based bulk sort of PA*24-specific CD8+ T cells of two HVs (HV1, HV2) after aAPC-based priming with HLA-A*24-PA*24-monomer (left panel) for single-cell T cell receptor (TCR) sequencing. The right panel depicts physiochemical properties and amino acid sequences of the CDR3-α/-β region of the most frequent TCR clone from each donor in comparison to their target peptide PA*24. On the y-axes, the hydrophilicity according to the Hopp-Woods scale is indicated and amino acids (AA) are grouped by their physiochemical properties with color code. Source data are provided as a Source Data file.
Fig. 3
Fig. 3. Mass spectrometry-based identification of naturally presented DNAJB1-PRKACA-derived HLA class I and HLA class II ligands.
a Schematic overview of Doxycycline (Dox)-inducible DNAJB1-PRKACA fusion gene expression. Hepatocellular carcinoma (HCC) cell lines transduced with DNAJB1-PRKACA Dox-inducible or control plasmid were treated with Dox followed by mass spectrometry (MS)-based immunopeptidome analysis of the HCC cell line, or of mature monocyte-derived dendritic cells (moDC) of a healthy volunteer (HV) incubated with HCC cell line lysate (created with BioRender.com). b Dox-induced DNAJB1-PRKACA expression by immunoblotting of HCC cell lines (HLE, SMMC-7721, and HepG2) carrying the DNAJB1-PRKACA Dox-inducible (+) or the control plasmid (−) with and without Dox treatment using an anti-Protein Kinase A (PKA) antibody (n = 3). The black arrow indicates the endogenous PKA band. GAPDH served as a loading control. c, f MS-identified peptides of c HCC cell lines (HLE n = 1, SMMC-7721 n = 3, and HepG2 n = 3) carrying the DNAJB1-PRKACA Dox-inducible or the control plasmid after Dox-treatment (data are presented as mean values ± SD) and f of mature moDCs of HVs incubated with HCC cell line lysate with or without expression of DNAJB1-PRKACA protein, respectively. d, g Distribution of MS-identified HLA ligands over the DNAJB1-PRKACA fusion protein sequence plotted with the frequency of amino acids (AA) per sample for, d HLA class I ligands of the HCC cell lines (n = 3) expressing DNAJB1-PRKACA and g HLA class II peptides of mature moDCs of HV3, HV4, and HV5 (n = 3) incubated with HCC cell line lysate expressing DNAJB1-PRKACA. e, h Fragment spectra (m/z on the x-axis) of the experimentally eluted peptides (e) of experimentally eluted HLA class I-presented ligands EIFDRYGEEV (PA*68/A*02, left) and IFDRYGEEV (PC*04/C*05, right) extracted from the DNAJB1-PRKACA expressing cell lines SMMC-7721 and HepG2, respectively (identification) by comparison to the respective synthetic peptide (validation, mirrored on the x-axis) with the calculated spectral correlation coefficient (R2). h Validation of the experimentally eluted HLA class II-presented peptide EVKEFLAKAKEDFLKK (PII-2) extracted from mature moDCs of a HV (identification) by comparison to the respective synthetic peptide isotope labeled on AA position two (validation, mirrored on the x-axis) with the calculated spectral correlation coefficient (R2). Identified b- and y-ions are marked in red and blue, respectively. Isotope-labeled ions are marked with asterisks. Source data are provided as a Source Data file.
Fig. 4
Fig. 4. FL-HCC patient vaccinated with a personalized DNAJB1-PRKACA-derived peptide vaccine.
a Schematic therapy course of a fibrolamellar hepatocellular carcinoma (FL-HCC) patient treated with a DNAJB1-PRKACA-derived peptide vaccine cocktail. After first diagnosis (FD) the patient was treated with four cycles of chemotherapy (CHX) analogous to the PHITT study (PHITT Group F) interrupted by an early liver transplant (LTx) one month (M1) after FD, as the tumor was assessed not resectable. Everolimus was used for post-transplantation immunosuppression. The patient experienced four relapses after LTx at months 11, 15, 19, and 21 post-FD. Tumor manifestations of the first, second, and fourth relapse were surgically resected, and for the third relapse, radiotherapy was applied. Starting at month 16 post-FD the patient was treated with Olaparib (poly (ADP-ribose) polymerase (PARP) inhibitor). At months 21 and 23, the patient received two vaccinations of a personalized DNAJB1-PRKACA-derived peptide vaccine comprising the peptides PA*68/A*02, PB*44, PC*04/C*05, and PII-1. Induction of vaccine peptide-specific T cell responses was observed six weeks after the second vaccination. b Vaccine peptide-specific T cell responses 6 weeks after the second vaccination were assessed by IFN-γ ELISPOT assay after in vitro stimulation with the vaccine cocktail peptides (PB*44, PII-1) compared to the negative peptide (neg.). c Longitudinal analysis of vaccine-induced T cell responses up to 18 months post-vaccination using IFN-γ ELISPOT assay after in vitro stimulation with the vaccine cocktail peptides (PA*68/A*02, PB*44, PC*04/C*05, and PII-1) in technical duplicates. d, e Flow cytometry-based characterization for indicated cytokines of d, CD4+ and CD8+ T cells stimulated with the PII-1 peptide and e, CD4+ and CD8+ T cells stimulated with the PB*44 peptide 14 weeks after the second vaccination in comparison to the respective negative (neg.) peptides. Source data are provided as a Source Data file.
Fig. 5
Fig. 5. Single-cell RNA sequencing of vaccine-induced PII-1 specific CD4+ T cells.
af Single-cell RNA-sequencing analysis of CD4+ T cells sorted from PII-1-stimulated PBMCs of the FL-HCC patient 31 weeks after the second vaccination with a personalized DNAJB1-PRKACA-derived peptide vaccine. a Uniform Manifold Approximation and Projection (UMAP) plot showing distinct T cell clusters. b Heat map of cluster defining log normalized gene expression for activated, exhausted/late effector, and naïve resting T cells. c UMAP plots depicting log normalized IFNG, GZMB (encoding granzyme B), TNF, and CCL3 gene expression defining the activated T cell cluster. d Functional enrichment of the log normalized gene expression for the hallmark cancer gene sets “TNF signaling via NF-κB” and “inflammatory response”. e UMAP plot showing T cell receptor (TCR) clonality of sequenced CD4+ T cells. The color code indicates the number of cells belonging to an expanded clonotype. f Distribution of the 10 largest TCR clonotypes across the cell type clusters identified in PII-1-specific CD4+ T cells. g Physiochemical properties and amino acid (AA) sequences of the CDR3-α/-β region of the most frequent TCR clones in comparison to their target peptide PII-1. The y-axes indicate the hydrophilicity according to the Hopp-Woods scale. AAs are grouped by their physiochemical properties with color code. h Clustering of variable sequences of the CDR3-α and CDR3-β region of the ten largest TCR clonotypes across the cell type clusters identified in PII-1-specific CD4+ T cells (upper panel), compared to all identified naïve single cell clones (lower panel). Position-wise Pearson correlation coefficient (PCC) calculation between positive and negative dataset (middle panel), with the significance of correlation calculated using a two-sided Pearson correlation test. The clustering was conducted using GibbsCluster 2.0. Source data are provided as a Source Data file.

References

    1. Hodi FS, et al. Improved survival with ipilimumab in patients with metastatic melanoma. N. Engl. J. Med. 2010;363:711–723. - PMC - PubMed
    1. Topalian SL, et al. Safety, activity, and immune correlates of anti-PD-1 antibody in cancer. N. Engl. J. Med. 2012;366:2443–2454. - PMC - PubMed
    1. Maude SL, et al. Chimeric antigen receptor T cells for sustained remissions in leukemia. N. Engl. J. Med. 2014;371:1507–1517. - PMC - PubMed
    1. Turtle CJ, et al. Immunotherapy of non-Hodgkin’s lymphoma with a defined ratio of CD8+ and CD4+ CD19-specific chimeric antigen receptor-modified T cells. Sci. Transl. Med. 2016;8:355ra116–355ra116. - PMC - PubMed
    1. Stackelberg AV, et al. A phase 1/2 study of blinatumomab in pediatric patients with relapsed/refractory B-cell precursor acute lymphoblastic leukemia. Blood. 2013;122:70–70.

Publication types

MeSH terms

Substances

Supplementary concepts