. 2022 Oct 27;13(1):6397.
doi: 10.1038/s41467-022-34151-6.

Ubiquitin proteolysis of a CDK-related kinase regulates titan cell formation and virulence in the fungal pathogen Cryptococcus neoformans

Affiliations

Ubiquitin proteolysis of a CDK-related kinase regulates titan cell formation and virulence in the fungal pathogen Cryptococcus neoformans

Chengjun Cao et al. Nat Commun. .

Abstract

Fungal pathogens often undergo morphological switches, including cell size changes, to adapt to the host environment and cause disease. The pathogenic yeast Cryptococcus neoformans forms so-called 'titan cells' during infection. Titan cells are large, polyploid, display alterations in cell wall and capsule, and are more resistant to phagocytosis and various types of stress. Titan cell formation is regulated by the cAMP/PKA signal pathway, which is stimulated by the protein Gpa1. Here, we show that Gpa1 is activated through phosphorylation by a CDK-related kinase (Crk1), which is targeted for degradation by an E3 ubiquitin ligase (Fbp1). Strains overexpressing CRK1 or an allele lacking a PEST domain exhibit increased production of titan cells similarly to the fbp1∆ mutant. Conversely, CRK1 deletion results in reduced titan cell production, indicating that Crk1 stimulates titan cell formation. Crk1 phosphorylates Gpa1, which then localizes to the plasma membrane and activates the cAMP/PKA signal pathway to induce cell enlargement. Furthermore, titan cell-overproducing strains trigger increased Th1 and Th17 cytokine production in CD4+ T cells and show attenuated virulence in a mouse model of systemic cryptococcosis. Overall, our study provides insights into the regulation of titan cell formation and fungal virulence.


Conflict of interest statement

The authors declare no competing interests.

Figures

Fig. 1
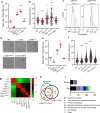
Fig. 1. The E3 ligase Fbp1 is required for cell size control in C. neoformans.
a Percentage of titan cell in the lungs during Cryptococcus infection. Error bar indicates 95% confidence interval of the median for 3 independent experiments. Statistical analysis for all measurements in this figure was performed with the two-sided Kruskal-Wallis nonparametric test for multiple comparisons. *P = 0.031; **P = 0.003; 0.009; 0.001. “ETP”, end time point. b Representative images of C. neoformans in BALF collected from the wild type H99-, fbp1Δ-, or fbp1Δ+FBP1-infected lungs after 3 days post-infection. Bar, 10 µm. c, d Quantitative measurement of titan cell percentage (c) and cell body size (d) in BALF. The data shown are cumulative from four mice per group and the pooled dataset across four mice (n = 1500 cells) are shown for cell size measurements. Error bar indicates 95% confidence interval of the median. *P = 0.031; ***P < 0.0001. e FACS analysis of DNA content in H99, fbp1Δ, and fbp1Δ+FBP1 strains. Cells were fixed and stained by propidium iodide (PI) after 3 days of incubation in titan cell inducing conditions. The population of large cells showed increased PI fluorescence intensity to >2 C, whereas the cells of typical size population harbored 1 C or 2 C PI intensity. f Representative images of H99, fbp1Δ, and fbp1Δ+FBP1 strains under in vitro titan cell inducing conditions. Bar, 10 µm. g, h Quantitative measurement of titan cell percentage (g) and cell size (h) of these strains under in vitro titan cell inducing conditions. The titan cell percentage data are cumulative from four independent experiments and the cell size data (n = 100 cells) are representative of four independent experiments. Error bar indicates 95% confidence interval of the median. *P = 0.030; ***P < 0.0001. Source data are provided as a Source Data file.
Fig. 2
Fig. 2. Crk1 is a substrate of Fbp1 required for meiosis.
a A schematic illustration of Crk1 proteins in C. neoformans. aa amino acids, Kinase_dom protein kinase domain, PEST PEST domain, CT C-terminus. b The interaction between Fbp1 and Crk1 in a yeast two-hybrid interaction assay. Colonies were tested on media lacking histidine. β-galactosidase activity assays were performed to verify the interaction. The assay was repeated at least three times with similar outcomes. Fbp1∆F, Fbp1 lacking the F-box domain. Crk1CT, C-terminus of Crk1. c Lysates were prepared from strains expressing either Fbp1:FLAG or Fbp1∆F:FLAG, Crk1:HA, or both, and immunoprecipitated using anti-FLAG affinity gel, then analyzed by immunoblotting using anti-FLAG (top) or anti-HA (bottom). The data are representative of three independent experiments. d Cells of indicated genetic background expressing PCRK1-CRK1:HA were harvested after being cultured in YPD overnight and the abundance of Crk1 was monitored by immunoblotting. The data are representative of three independent experiments. e The PCTR4-CRK1:HA construct was expressed in both the WT and fbp1∆ strains. The level of Crk1:HA was determined by immunoblotting using anti-HA at indicated time points (in hours) after blocking CRK1 transcription by copper. The abundance of Actin protein detected by anti-Actin antibody was used as a loading control. The data are representative of three independent experiments. f The stability of Crk1ΔPEST protein in the WT and fbp1Δ backgrounds. The PCTR4-CRK1ΔPEST:HA construct was expressed in the WT and fbp1∆ backgrounds and the level of Crk1ΔPEST:HA was determined by immunoblotting using anti-HA at indicated time points after blocking CRK1 transcription by copper. The protein detected by anti-Actin antibody was used as a loading control. The data are representative of three independent experiments. g Accumulation of Crk1 polyubiquitination (Crk1-(Ub)n) was detected using HA antibody. Crk1:HA were expressed in the WT and fbp1∆ backgrounds. Overnight cultures were collected and total proteins were extracted. Crk1:HA was purified by HA antibody immunoprecipitation and detected using anti-HA. Error bar indicates 95% confidence interval of the median for three independent experiments. Statistical analysis was performed based on two-sided Mann–Whitney test. *P = 0.017; **P = 0.009. h Crk1 is required for meiosis and sporulation. Bilateral mating assays for wild type, the crk1Δ mutant, the CRK1 overexpression strain (CRK1OE), and the fbp1Δ mutant. Mating structures were photographed after 7 days of incubation in the dark at 25 °C on MS medium. Images are representative of three independent experiments. Bars, 5 μm. Source data are provided as a Source Data file.
Fig. 3
Fig. 3. Deletion of Fbp1 increases the proportion of titan cells through Crk1 protein accumulation.
a, b Quantitative measurement of titan cell proportion (a) and cell size (b) under in vitro titan cell inducing conditions. The titan cell percentage data are cumulative from four independent experiments and the cell size data (n = 100 cells) are representative of four independent experiments. Error bar indicates 95% confidence interval of the median. Statistical analysis was performed with the two-sided Kruskal-Wallis nonparametric test for multiple comparisons. *P = 0.05; 0.03; ***P = 0.0004 in panel (a). *P = 0.01; **P = 0.001; ***P < 0.0001 in panel (b). c FACS analysis of DNA content in the CRK1OE and the CRK1ΔPEST strains. Cells were fixed and stained by propidium iodide (PI) after 3 days of incubation in titan cell inducing conditions. The population of large cells showed increased PI fluorescence intensity to >2 C, while the cells of typical size population harbored 1 C or 2 C PI intensity. d Representative images of cells in BALF collected from a mouse infected with WT, crk1Δ, CRK1OE, CRK1ΔPEST, or a crk1Δ+CRK1 strain after 3 days post-infection. Bar, 10 µm. e, f Titan cell percentage (e) and cell size (f) in BALF. The data shown for titan cell percentage are cumulative from four mice and the data shown for cell size are cumulative from 1500 cells. Error bar indicates 95% confidence interval of the median. Statistical analysis was performed with the two-sided Kruskal-Wallis nonparametric test for multiple comparisons. *P = 0.024; **P = 0.002 in panel (e). ***P < 0.0001 in panel (f). g Correlation coefficient of the gene expression profiles in WT, fbp1∆, CRK1OE, and CRK1∆PEST strains that were cultured under titan cell inducing conditions at 30 °C for 3 days. The cells were then collected and total RNA was extracted. Clustering analysis of different samples was performed using the R package plots v3.1.3 (https://cran.r-project.org/web/packages/gplots/). The consistency between different samples in the matrix is indicated by different colors. Colors ranging from green to red (levels 0.7–1) indicate an increase in consistency. R2: Square of Pearson correlation coefficient (R). h Venn diagram showing numbers of differentially expressed genes in three comparison groups (fbp1∆ vs WT, CRK1OE vs WT, and CRK1∆PEST vs WT) and the overlap between these differentially-expressed genes among three mutant strains. A 2-fold cutoff (log2(x) = 1) between two different strains was used to define differentially-expressed genes. i Categories of 247 differentially expressed genes overlapped in these three groups based on GO term. Source data are provided as a Source Data file.
Fig. 4
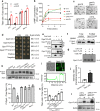
Fig. 4. Crk1 regulates titan cell formation through the Gpa1-cAMP signaling pathway.
a Titan cell percentage under in vitro titan cell inducing conditions in the absence or presence of 10 mM extracellular cAMP. Error bar indicates 95% confidence interval of the median for 3 independent experiments. Statistical analysis was performed based on two-sided Mann–whitney test. *P = 0.030, **P = 0.02. b Measurement of cAMP production in response to glucose. Statistical analysis was performed with the Kruskal–Wallis nonparametric test for multiple comparisons. **P < 0.0001. c Representative cell images of the indicated strains after incubated in minimal medium (MM) for 3 days at 30 °C. Bar, 5 µm. d The interaction between Crk1 and Gpa1 in a yeast two-hybrid interaction assay. Gpa1Q284L, Gpa1 dominant active allele; Crk1CT, C-terminus of Crk1. e Co-immunoprecipitation assay. Lysates from strains expressing either Gpa1:FLAG or both Gpa1:FLAG and Crk1:HA, and immunoprecipitated using anti-HA, then analyzed by immunoblotting using anti-FLAG and anti-HA (IP). f Total protein extracts or purified Gpa1:FLAG from the strain expressing PGDP1-GPA1:FLAG (CUX1196) were treated with protein phosphatase (ppase) and Gpa1 signal was detected using anti-FLAG. g In vitro kinase assay was perform for purified Gpa1:FLAG that was pre-treated with protein phosphatase (ppase), and then mixed with purified Crk1-HA in the absence (−) or presence (+) of ATP. The Gpa1 was detected using anti-FLAG. h Gpa1 phosphorylation in titan cell inducing conditions. Total protein from strains expressing Gpa1:FLAG was analyzed by western blotting with an FLAG antibody (top) and the abundance of phosphorylated Gpa1 (P-Gpa1) protein in the indicated strains was quantified (bottom). Error bar indicates 95% confidence interval of the median for three independent measurements. Statistical analysis was performed with the two-sided Kruskal-Wallis nonparametric test for multiple comparisons. *P = 0.043. i Representative images to show Gpa1 localization under titan cell inducing conditions (top), and fluorescence intensity plot along a cellular axis indicated with a white line on the image (bottom). Bars, 10 μm. j Quantitative measurement of fluorescence signals using ImageJ. Error bar indicates the standard deviation of the mean. Statistical analysis was performed based on two-sided Mann–whitney test. **P = 0.002. k Quantitative measurement of titan cell proportion in cells overexpressing GPA1 under in vitro titan cell inducing conditions. Error bar indicates 95% confidence interval of the median for 3 independent experiments. Statistical analysis was performed with the two-sided Kruskal-Wallis nonparametric test for multiple comparisons. *P = 0.024; 0.035; **P = 0.0004. l Under titan cell inducing conditions, Cytosolic (C) and membrane (M) fractions were separated from cells of the crk1Δ and CRK1ΔPEST strains expressing PGDP1-GPA1:FLAG represent typical cells (crk1Δ GPA1OE) and titan cells (CRK1ΔPEST GPA1OE), respectively. Gpa1:FLAG was detected using anti-FLAG. The data or images shown in this figure are all representative of three independent experiments with similar results. Source data are provided as a Source Data file.
Fig. 5
Fig. 5. Crk1 shapes the host immune response and fungal virulence.
a Survival curves for mice after intranasal infection with H99, CRK1OE, and CRK1∆PEST strains, respectively. Statistical analysis was performed based on Log-rank (Mantel-Cox) test. ****P < 0.0001. b H&E-stained slides were prepared from cross sections of infected mouse lungs at endpoint and visualized by light microscopy. Bar, 10 µm. Titan cell percentage was quantitatively measured from infected lung sections at the endpoint. The titan cell percentage data are cumulative from three mice. Error bar indicates 95% confidence interval of the median. Statistical analysis was performed with the two-sided Kruskal-Wallis nonparametric test for multiple comparisons. *P = 0.03; **P = 0.004; 0.003. c, d Cytokine expression was analyzed by intracellular cytokine staining. Plots of cytokine production in CD4+ T cells was gated as Thy1.2+ CD4+ CD8 T cells. The frequencies of IFN-γ- (c) and IL-17A- (d) producing CD4+ T cells in BALF were analyzed. Each symbol represents one mouse. Error bar indicates 95% confidence interval of the median for 4 mice. Statistical analysis of data was done with the two-sided Kruskal-Wallis nonparametric test for multiple comparisons. *P = 0.019; **P = 0.002; 0.007; ***P = 0.0008. e, f Cryptococcus-specific CD4+ T cell responses were examined in lung-draining lymph nodes (MLNs) of mice after infection. Production of IFN-γ (e) and IL-17A (f) was measured by ELISA. The data shown are cumulative from three independent experiments with five mice per group. Error bar indicates 95% confidence interval of the median. Statistical analysis of data was done with the two-sided Kruskal-Wallis nonparametric test for multiple comparisons. *P = 0.02; **P = 0.004; ***P < 0.001. Source data are provided as a Source Data file.
Fig. 6
Fig. 6. Proposed model for the involvement of Crk1 in the ubiquitin pathway and the G protein pathway.
The SCF(Fbp1) E3 ligase interacts with Crk1 for its ubiquitination and degradation at the 26 S proteasome. Overproduction of Crk1 under titan cell-inducing conditions promotes Gpa1 phosphorylation. The phosphorylated Gpa1 is translocated to the plasma membrane for its binding with the G protein-coupled receptor, which activates Gpa1-cAMP signaling to regulate cell enlargement.

Similar articles

Cited by

References

    1. Bjorklund M. Cell size homeostasis: metabolic control of growth and cell division. Biochim. Biophys. Acta Mol. Cell Res. 2019;1866:409–417. - PubMed
    1. Lloyd AC. The regulation of cell size. Cell. 2013;154:1194–1205. - PubMed
    1. Ginzberg MB, Kafri R, Kirschner M. Cell biology. On being the right (cell) size. Science. 2015;348:1245075. - PMC - PubMed
    1. Neurohr GE, et al. Excessive cell growth causes cytoplasm dilution and contributes to senescence. Cell. 2019;176:1083–1097 e1018. - PMC - PubMed
    1. Odds, F. C. Candida and candidosis: a review and bibliography. (Bailliere Tindall, 1988).

Publication types