. 2022 Oct 27;13(1):6405.
doi: 10.1038/s41467-022-34154-3.

Endothelial alpha globin is a nitrite reductase

Affiliations

Endothelial alpha globin is a nitrite reductase

T C Stevenson Keller 4th et al. Nat Commun. .

Abstract

Resistance artery vasodilation in response to hypoxia is essential for matching tissue oxygen and demand. In hypoxia, erythrocytic hemoglobin tetramers produce nitric oxide through nitrite reduction. We hypothesized that the alpha subunit of hemoglobin expressed in endothelium also facilitates nitrite reduction proximal to smooth muscle. Here, we create two mouse strains to test this: an endothelial-specific alpha globin knockout (EC Hba1Δ/Δ) and another with an alpha globin allele mutated to prevent alpha globin's inhibitory interaction with endothelial nitric oxide synthase (Hba1WT/Δ36-39). The EC Hba1Δ/Δ mice had significantly decreased exercise capacity and intracellular nitrite consumption in hypoxic conditions, an effect absent in Hba1WT/Δ36-39 mice. Hypoxia-induced vasodilation is significantly decreased in arteries from EC Hba1Δ/Δ, but not Hba1WT/Δ36-39 mice. Hypoxia also does not lower blood pressure in EC Hba1Δ/Δ mice. We conclude the presence of alpha globin in resistance artery endothelium acts as a nitrite reductase providing local nitric oxide in response to hypoxia.


Conflict of interest statement

The authors declare no competing interests.

Figures

Fig. 1
Fig. 1. Alpha globin is the only globin expressed in the mouse endothelium.
a The mouse thoracodorsal artery (a skeletal muscle-derived resistance artery) shows endothelial expression of alpha globin, but not of other globins. Cytoglobin and neuroglobin are observed in adventitial layers, but not in endothelial cells. The scale bar represents 50 μm; magnified views focused on the endothelium are shown in the bottom right of each image. b The mouse aorta is representative of globin expression in a conduit artery. Only myoglobin is expressed in the aorta wall, and it is not expressed in endothelium. In all images, green signal is autofluorescence of the internal elastic lamina layer (IEL) and the asterisk indicates the lumen of the vessel. All images are representative of observations from a minimum of four mice per staining condition.
Fig. 2
Fig. 2. Alpha globin is a nitrite reductase.
a Nitrite-induced optical changes to deoxyferrous alpha globin caused by NO gas formation and binding are reflected in the changing spectra over time. Sodium nitrite solution (1 mM) was added to deoxyferrous alpha globin (4 μΜ), and spectra were recorded at 10-s intervals. b Example kinetic traces of ferrous-NO formation, as measured by the change in absorbance at 415 nm and 430 nm as a result of the reaction of alpha globin (circles) or hemoglobin A (triangles) and nitrite. c The observed rate constant for the formation of ferrous-NO from the reaction of (deoxy) alpha globin and nitrite across nitrite concentrations. d Illustration of the experimental design for observing NO generation from nitrite added to thoracodorsal artery lysate in a chemiluminescent detection setup. e Representative plot of NO generation from thoracodorsal artery lysate with increasing doses of nitrite added (the graph is representative of n = 4 experiments). Vertical lines represent time points at which the indicated concentrations of nitrite were added to the solution to observe NO formation (measured in ppb). Source data are provided in the Source data file.
Fig. 3
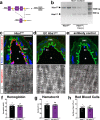
Fig. 3. Creation of an endothelial-specific Hba1-deletion mouse model.
a Deletion strategy: loxP sites flanking exons 2 and 3 of the mouse Hba1 gene (Hba1fl/fl) were introduced by recombineering. A tamoxifen-inducible, endothelial-specific Cre recombinase (Cdh5-PAC-CreERT2) enabled temporally controlled and cell-type-specific deletion of a functional Hba1 gene (EC Hba1Δ/Δ mouse). b DNA gel using genomic DNA extracted from diaphragm showing recombination of the Hba1 locus with Cre activation. The recombination event produced a band at ~450 bp. c, d Immunofluorescence staining for alpha globin in transverse sections of a thoracodorsal artery (top) and en face views of the endothelium of a third-order mesenteric artery (bottom). The scale bar represents 25 μm, and an asterisk indicates lumen of the vessel in the upper images. Alpha globin (red) was found in the endothelium throughout and specifically in the holes in the internal elastic lamina (IEL), where myoendothelial junctions are found. e Control IgG staining showing the specificity of the staining for alpha globin in this tissue. f, g Endothelial deletion of alpha globin does not affect blood cell hemoglobin parameters. Blood hemoglobin content (f), hematocrit (g), and the number of red blood cells (h) were unchanged in the EC Hba1Δ/Δ mice, as compared to the Hba1fl/fl controls. For the experiments in fh, n = 20 Hba1fl/fl mice and n = 17 EC Hba1Δ/Δ mice were used; one-sided t tests were used to determine whether there were significant differences between groups. Bar graphs are centered on mean with error bars denoting standard error. Source data are provided in the Source data file.
Fig. 4
Fig. 4. Disruption of alpha globin/eNOS interaction through the deletion of four residues in Hba1.
a A colorized crystallographic model of alpha globin (from PDBid: 1Z8U) showing the residues previously shown to interact with eNOS (blue) surrounding four residues deleted in the Hba1WT/Δ36–39 mouse model (magenta). The sequences for the proteins encoded by the Hba1WT and Hba1Δ36–39 alleles, including the deleted residues (magenta), are shown in the box below. b Using a guide RNA design (blue) targeting the eNOS binding region (green) resulted in an in-frame deletion of the nucleotides boxed in pink. This is confirmed by the chromatogram in c, which shows that the 12-nucleotide deletion scrambles downstream reading of the nucleotide sequence in NGS protocols. d The mutant protein is expressed, as seen in immunoprecipitation-coupled mass spectrometry. A peak corresponding to a protein with a molecular weight ~400 Da less than that of the dominant species is seen in hemoglobin captured from lysed red blood cells. eg The blood hemoglobin content (e), hematocrit (f), and the number of red blood cells (g) are shown for the Hba1WT/WT and Hba1WT/Δ36–39 groups. h Results of fluorescence polarization assays for determining the binding of the mutant allele to eNOS, using an alpha globin mimetic peptide known to bind (top) and the Δ36–39 peptide (bottom). No binding affinity could be calculated for the Δ36–39 peptide. The points are centered on the mean value of three measurements per concentration, and the error bars represent the standard deviation of the triplicate measurements. These results are representative of n > 5 individual experiments. i The proximity ligation assay (PLA) signal (red puncta, marked by arrows) highlights the close localization of alpha globin and eNOS. Nuclei appear blue (with DAPI staining), the autofluorescence of the internal elastic lamina appears green, and the lumen of the vessel is indicated by an asterisk (*). The scale bar represents 15 μm. j Endothelial PLA signals, normalized to the length of the internal elastic lamina, were reduced in the Hba1WT/Δ36–39 mice. The difference was significant when these mice were compared to the Hba1WT/WT mice, but not when they were compared to IgG staining controls. For the experiments in eg, n = 6 for Hba1WT/WT mice and n = 5 for Hba1WT/Δ36–39 mice were used. For the experiments in j, n = 3 mice of each genotype were used, and the significance of differences was determined by a one-sided t test with multiple comparisons correction. Bar graphs are centered on mean with error bars denoting standard error. Source data are provided in the Source data file.
Fig. 5
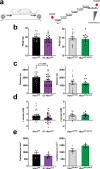
Fig. 5. Exercise capacity is reduced with total loss of function, but not with eNOS binding disruption.
a Schematic of the exercise capacity protocol. After an initial blood sample was collected for baseline lactate measurement, mice were encouraged to run on a treadmill until exhaustion. The treadmill speed was increased every 30 min until a maximum speed of 26.8 m/min (1 mile per hour) was achieved. After running failure, a second blood sample was taken to monitor lactate buildup and thereby ensure physical exhaustion. b Body weight measurements for Hba1fl/fl vs. EC Hba1Δ/Δ or for the Hba1WT/WT vs. Hba1WT/Δ36–39 littermate groups did not differ. c The distance to exhaustion was shorter in EC Hba1Δ/Δ mice compared to Hba1fl/fl littermates; no such difference was observed when the distances to exhaustion for the Hba1WT/WT and Hba1WT/Δ36–39 littermate groups were compared. d Blood lactate was increased in all groups after exercise, but no differences were observed between the control and experimental groups. e Soleus muscle capillary density was similar across littermate comparisons. For the experiments in bd, n = 23 for Hba1fl/fl mice; n = 26 for EC Hba1Δ/Δ mice; n = 13 for Hba1WT/WTmice; and n = 11 Hba1WT/Δ36–39 mice were used. For the experiments in e, n = 6 for Hba1fl/fl mice; n = 6 for EC Hba1Δ/Δ mice; n = 5 for Hba1WT/WT mice; and n = 3 for Hba1WT/Δ36–39 mice were used. Results for different littermate genotypes were compared with t tests. Bar graphs are centered on mean with error bars denoting standard error. Source data are provided in the Source data file.
Fig. 6
Fig. 6. Nitrite consumption is increased by chemical hypoxia in isolated thoracodorsal vessels.
Nitrite (NO2) (a), nitrate, (NO3) (b), and summed NO2 and NO3 species (c) were measured after isolated vessels were incubated with sodium dithionite (Na2S2O4). Wild-type thoracodorsal vessels treated with Na2S2O4 or buffer deoxygenated with N2 gas showed decreased intracellular NO2 when compared to vessels treated with water (H2O) (leftmost group). All experimental genotypes and their littermate controls were treated with Na2S2O4, and the experimental genotypes were treated with H2O as a vehicle control (cross-hatched bars). Vessels from both global Hba1–/– and EC Hba1Δ/Δ mice showed higher levels of NO2 and lower NO3 levels when compared to those of littermate controls with chemical hypoxia, whereas the total amount of NO2 and NO3 did not differ from controls. In this study, n = 7 WT vessels were treated with H2O; n = 6 WT vessels were treated with Na2S2O4; and n = 5 WT vessels were treated with N2 gas-treated buffer. For these experiments, n = 5 Hba1+/+ mice, n = 5 Hba1–/– mice, n = 6 Hba1fl/fl mice, n = 6 EC Hba1Δ/Δ mice, n = 4 Hba1WT/WT mice, and n = 4 Hba1WT/Δ36–39 mice were used. Results for littermates were compared with one-sided t tests. Bar graphs are centered on mean with error bars denoting standard error. Source data are provided in the Source data file.
Fig. 7
Fig. 7. Hypoxic vasodilation is decreased without endothelial alpha globin.
a Representative trace of a hypoxic vasodilation experiment. Cannulated vessels were treated with an initial dose of phenylephrine (PE) to induce constriction, and endothelial dilation integrity was confirmed by dilation in response to NS309. A further PE dose was then administered to induce constriction, and dilation in response to Na2S2O4 was assessed. Finally, maximum dilation to Ca2+-free buffer established the percentage of the maximum dilation observed for each treatment. b Vasodilation in response to increasing doses of Na2S2O4 was blunted by the global loss of Hba1 (Hba1–/–, orange) and endothelial deletion of alpha globin (EC Hba1Δ/Δ, purple), but not by decreasing the interaction of alpha globin and eNOS (Hba1WT/Δ36–39, green). c Hypoxia induced by a single dose of 1 mM Na2S2O4 blunted dilation only in mice with the global Hba1–/– and EC Hba1Δ/Δ genotypes. The hypoxic vasodilation was preserved in Hba1+/+, Hba1fl/fl, Hba1WT/WT, and Hba1WT/Δ36–39 groups. d Adding blood to the lumen of the EC Hba1Δ/Δ vessels partially restored dilation after Na2S2O4 treatment. e The hypoxic vasodilation response was not affected by the pretreatment of the vessel with L-NAME, a NOS inhibitor. f The hypoxic vasodilation response of the isolated resistance arteries was inhibited by carbon monoxide. g The dilation in response to Na2S2O4 is NO-mediated, as treatment with the NO scavenger PTIO (2-phenyl-4, 4, 5, 5,-tetramethylimidazoline-1-oxyl 3-oxide) prevented dilation in all groups. h Limiting other reactive oxygen species (including superoxide and hydrogen peroxide) with TEMPOL did not restore a dilatory response to chemical hypoxia in the Hba1–/– or EC Hba1Δ/Δ groups. i Treating the buffer surrounding the vessels with N2 gas to deoxygenate enabled hypoxic vasodilation in all groups in which endothelial alpha globin is present, and this effect is not diminished with NOS inhibition through L-NAME pretreatment j. k The response to N2 gas is also NO dependent, as it was inhibited by PTIO treatment. All experiments in b, c, and fi were performed with 6 animals per genotype. The experiment in d was with 4 animals. Experiments in j and k were with 4 animals per genotype. All comparisons between groups used two-sided t -tests with multiple comparisons correction, except for the study in d, for which a t test was used. Bar graphs are centered on mean with error bars denoting standard error. Source data are provided in the Source data file.
Fig. 8
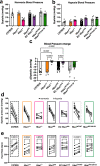
Fig. 8. Endothelial alpha globin enhances blood pressure change in response to global hypoxia.
a In normoxia (room air), the systolic blood pressure of the Hba1–/– and EC Hba1Δ/Δ genotypes was slightly decreased when compared to other genotype groups. b When exposed to hypoxia, the Hba1–/– and EC Hba1Δ/Δ groups had slightly elevated systolic blood pressure when compared to other groups. c Hba1–/– and EC Hba1Δ/Δ mice showed the least change in systolic blood pressure difference between normoxia and hypoxia when compared to littermate controls and WT mice. This difference between groups was statistically significant. d Data points from individual animals plotted to show the change in systolic pressure from normoxia (filled circles) to hypoxia (open circles). e Heart rate in beats per minute (bpm) of the individual animals used for this experiment are plotted to show change when the animal was exposed to hypoxia. For these experiments, n = 7 C57Bl/6 mice, n = 6 Hba1+/+ mice, n = 6 Hba1–/– mice, n = 7 Hba1fl/fl mice, n = 7 EC Hba1Δ/Δ mice, n = 7 Hba1WT/WT mice, and n = 7 Hba1WT/Δ36–39 mice were used. Comparisons across groups used a one-way ANOVA; in e, only comparisons between paired values were calculated. Bar graphs are centered on mean with error bars denoting standard error. Source data are provided in the Source data file.

References

    1. Allen BW, Stamler JS, Piantadosi CA. Hemoglobin, nitric oxide and molecular mechanisms of hypoxic vasodilation. Trends Mol. Med. 2009;15:452–460. doi: 10.1016/j.molmed.2009.08.002. - DOI - PMC - PubMed
    1. Kim-Shapiro DB, Gladwin MT, Patel RP, Hogg N. The reaction between nitrite and hemoglobin: the role of nitrite in hemoglobin-mediated hypoxic vasodilation. J. Inorg. Biochem. 2005;99:237–246. doi: 10.1016/j.jinorgbio.2004.10.034. - DOI - PubMed
    1. Umbrello M, Dyson A, Feelisch M, Singer M. The key role of nitric oxide in hypoxia: hypoxic vasodilation and energy supply-demand matching. Antioxid. Redox Signal. 2013;19:1690–1710. doi: 10.1089/ars.2012.4979. - DOI - PubMed
    1. Maher AR, et al. Hypoxic modulation of exogenous nitrite-induced vasodilation in humans. Circulation. 2008;117:670–677. doi: 10.1161/CIRCULATIONAHA.107.719591. - DOI - PubMed
    1. Tsoukias NM, Kavdia M, Popel AS. A theoretical model of nitric oxide transport in arterioles: frequency- vs. amplitude-dependent control of cGMP formation. Am. J. Physiol. Heart Circ. Physiol. 2004;286:H1043–H1056. doi: 10.1152/ajpheart.00525.2003. - DOI - PubMed

Publication types