

Speech acoustic indices for differential diagnosis between Parkinson's disease, multiple system atrophy and progressive supranuclear palsy
- PMID: 36302780
- PMCID: PMC9613976
- DOI: 10.1038/s41531-022-00389-6
Speech acoustic indices for differential diagnosis between Parkinson's disease, multiple system atrophy and progressive supranuclear palsy
Abstract
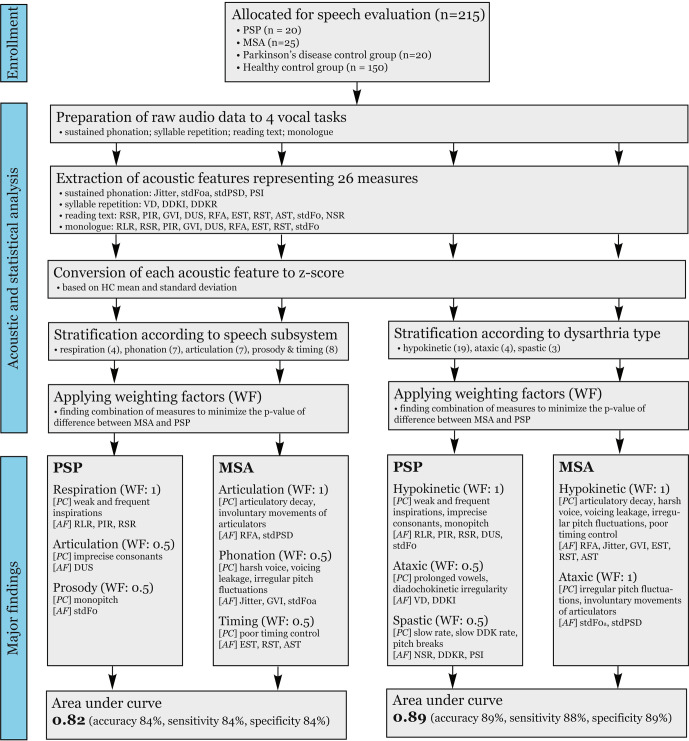
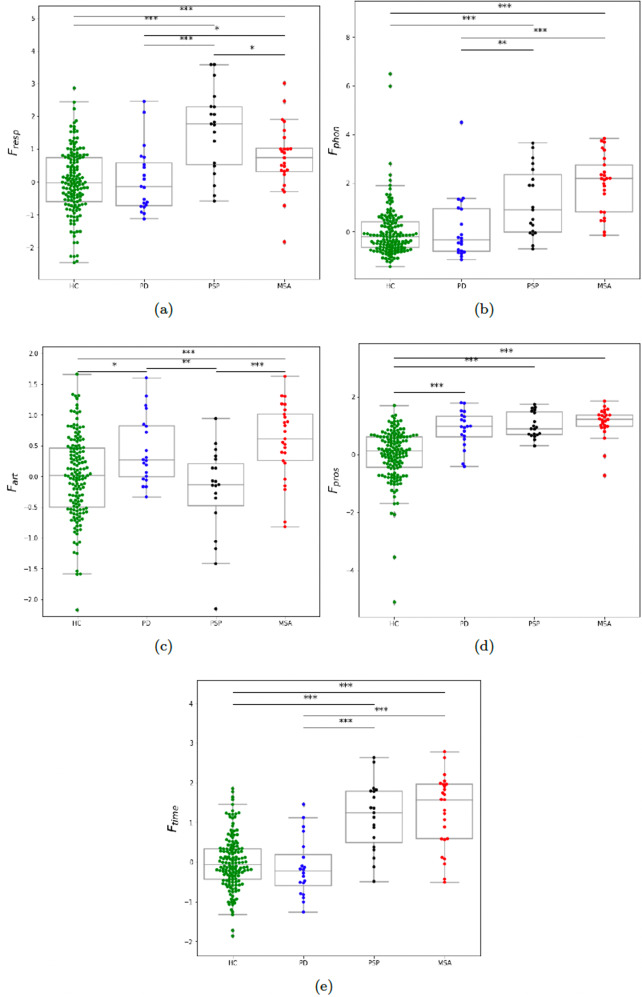
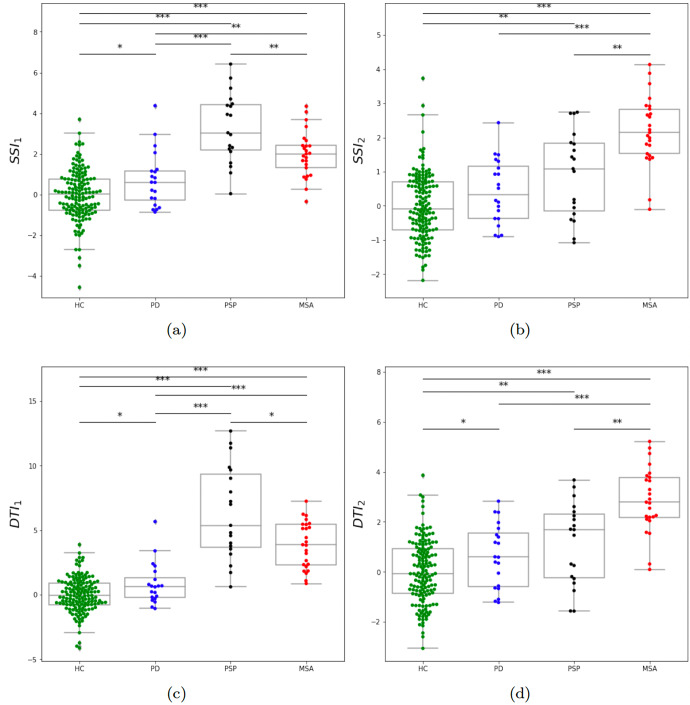
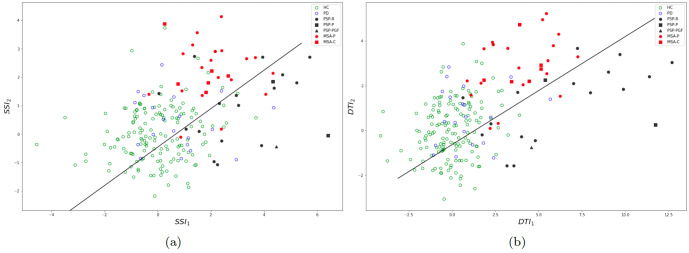
While speech disorder represents an early and prominent clinical feature of atypical parkinsonian syndromes such as multiple system atrophy (MSA) and progressive supranuclear palsy (PSP), little is known about the sensitivity of speech assessment as a potential diagnostic tool. Speech samples were acquired from 215 subjects, including 25 MSA, 20 PSP, 20 Parkinson's disease participants, and 150 healthy controls. The accurate differential diagnosis of dysarthria subtypes was based on the quantitative acoustic analysis of 26 speech dimensions related to phonation, articulation, prosody, and timing. A semi-supervised weighting-based approach was then applied to find the best feature combinations for separation between PSP and MSA. Dysarthria was perceptible in all PSP and MSA patients and consisted of a combination of hypokinetic, spastic, and ataxic components. Speech features related to respiratory dysfunction, imprecise consonants, monopitch, slow speaking rate, and subharmonics contributed to worse performance in PSP than MSA, whereas phonatory instability, timing abnormalities, and articulatory decay were more distinctive for MSA compared to PSP. The combination of distinct speech patterns via objective acoustic evaluation was able to discriminate between PSP and MSA with very high accuracy of up to 89% as well as between PSP/MSA and PD with up to 87%. Dysarthria severity in MSA/PSP was related to overall disease severity. Speech disorders reflect the differing underlying pathophysiology of tauopathy in PSP and α-synucleinopathy in MSA. Vocal assessment may provide a low-cost alternative screening method to existing subjective clinical assessment and imaging diagnostic approaches.
© 2022. The Author(s).
Conflict of interest statement
The authors declare no competing interests.
Figures
References
-
- Hornykiewicz O. Biochemical aspects of parkinson’s disease. Neurology. 1998;51:S2–S9. - PubMed
-
- Schrag A, Ben-Shlomo Y, Quinn NP. Prevalence of progressive supranuclear palsy and multiple system atrophy: a cross-sectional study. Lancet. 1999;354:1771–1775. - PubMed
-
- Nath U, Ben-Shlomo Y, Thomson RG, Lees AJ, Burn DJ. Clinical features and natural history of progressive supranuclear palsy. Neurology. 2003;60:910–916. - PubMed
-
- Steele JC, Olszewski J, Richardson JC. Progressive supranuclear palsy: a heterogeneous degeneration involving the brain stem, basal ganglia and cerebellum with vertical gaze and pseudobulbar palsy, nuchal dystonia and dementia. Arch. Neurol. 1964;10:333–359. - PubMed
Grants and funding
- ANR-16-CE19-0010-01/Agence Nationale de la Recherche (French National Research Agency)
- ANR-16-CE19-0010-01/Agence Nationale de la Recherche (French National Research Agency)
- NV19-04-00120/Ministerstvo Zdravotnictví Ceské Republiky (Ministry of Health of the Czech Republic)
- NV19-04-00120/Ministerstvo Zdravotnictví Ceské Republiky (Ministry of Health of the Czech Republic)
- PROGRES Q27/1LF and MH-CZ-DRO-VFN64165/Univerzita Karlova v Praze (Charles University)
LinkOut - more resources
Full Text Sources
Miscellaneous
