. 2022 Oct 27;7(1):63.
doi: 10.1038/s41525-022-00333-w.

Direct cell-to-cell transfer in stressed tumor microenvironment aggravates tumorigenic or metastatic potential in pancreatic cancer

Affiliations

Direct cell-to-cell transfer in stressed tumor microenvironment aggravates tumorigenic or metastatic potential in pancreatic cancer

Giyong Jang et al. NPJ Genom Med. .

Abstract

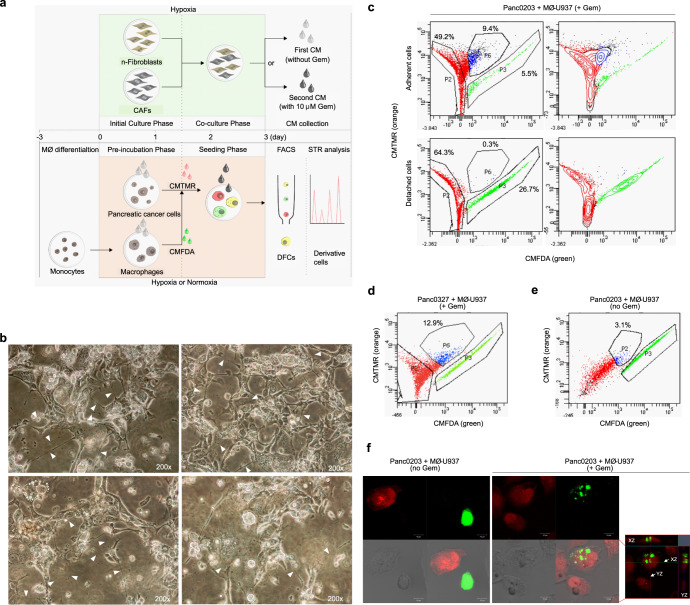
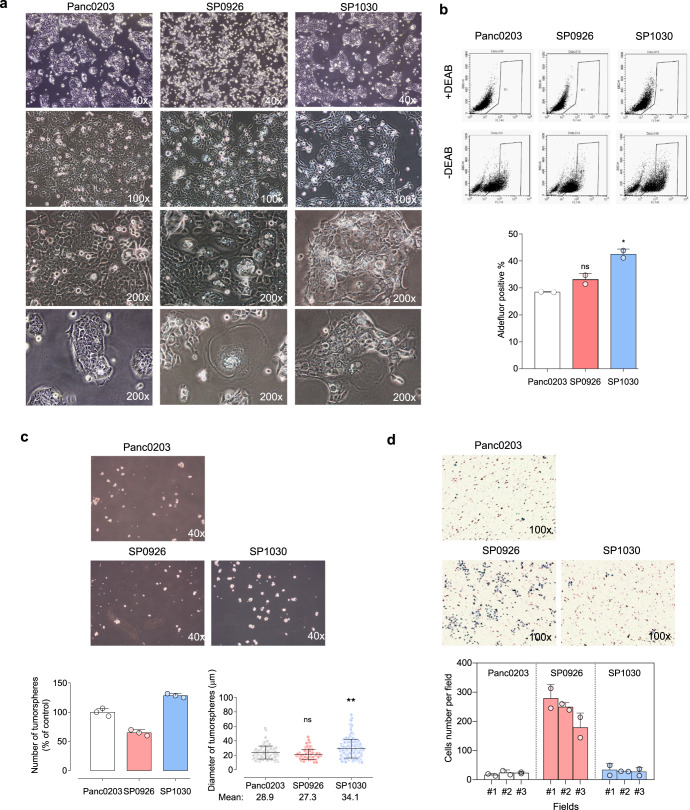
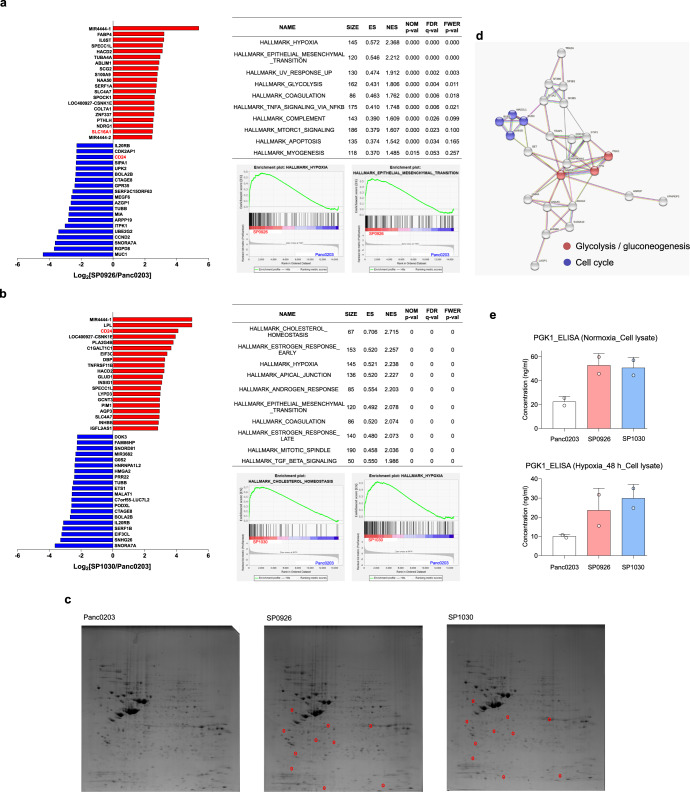
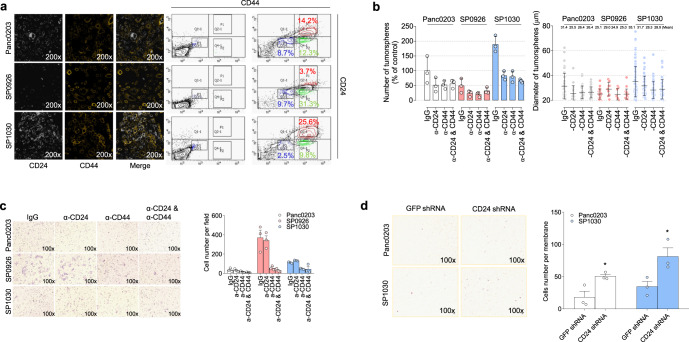
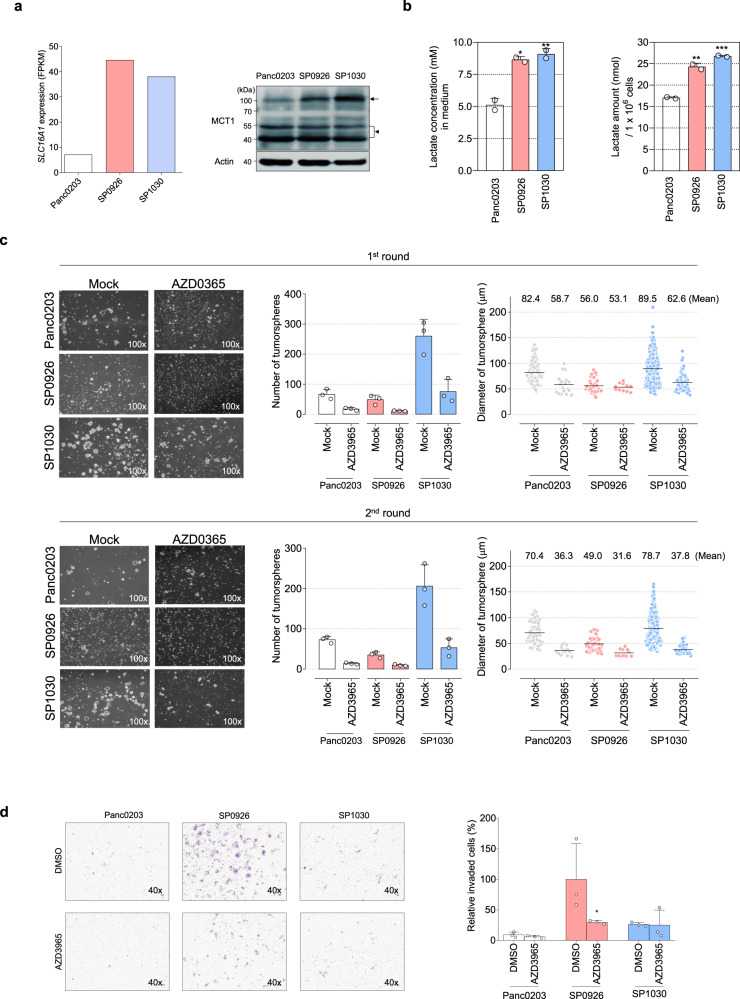
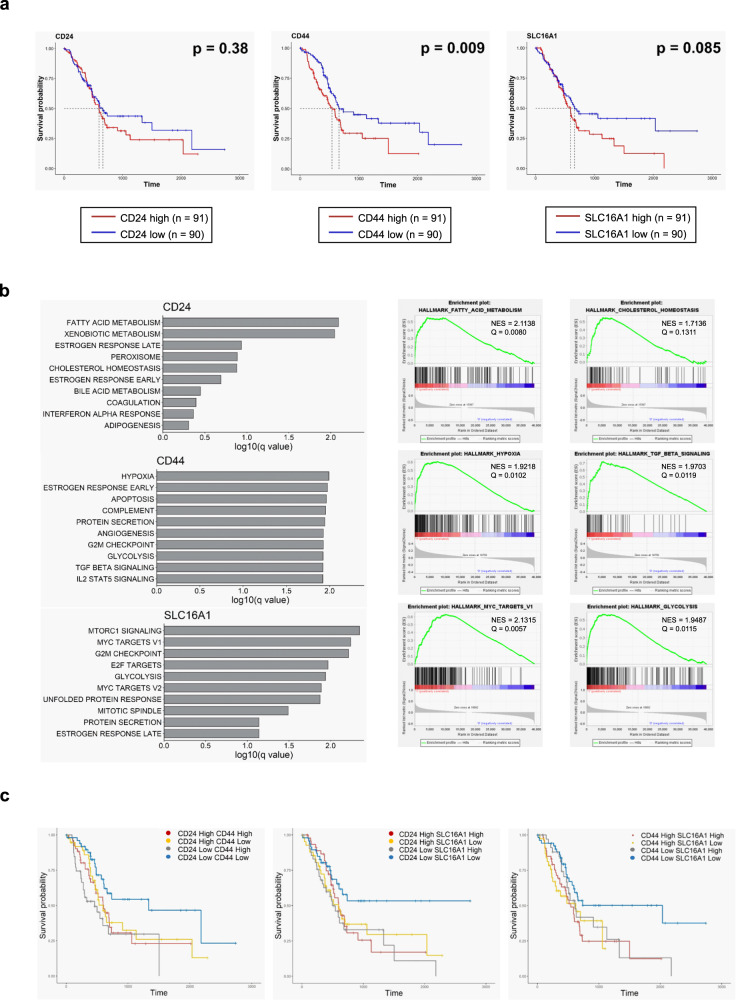
Pancreatic cancer exhibits a characteristic tumor microenvironment (TME) due to enhanced fibrosis and hypoxia and is particularly resistant to conventional chemotherapy. However, the molecular mechanisms underlying TME-associated treatment resistance in pancreatic cancer are not fully understood. Here, we developed an in vitro TME mimic system comprising pancreatic cancer cells, fibroblasts and immune cells, and a stress condition, including hypoxia and gemcitabine. Cells with high viability under stress showed evidence of increased direct cell-to-cell transfer of biomolecules. The resulting derivative cells (CD44high/SLC16A1high) were similar to cancer stem cell-like-cells (CSCs) with enhanced anchorage-independent growth or invasiveness and acquired metabolic reprogramming. Furthermore, CD24 was a determinant for transition between the tumorsphere formation or invasive properties. Pancreatic cancer patients with CD44low/SLC16A1low expression exhibited better prognoses compared to other groups. Our results suggest that crosstalk via direct cell-to-cell transfer of cellular components foster chemotherapy-induced tumor evolution and that targeting of CD44 and MCT1(encoded by SLC16A1) may be useful strategy to prevent recurrence of gemcitabine-exposed pancreatic cancers.


Conflict of interest statement

The authors declare no competing interests.

Figures

Fig. 1
Fig. 1. In vitro TME model development and isolation of pancreatic cancer cells exhibiting direct cell-to-cell transfer.
a Schematic of the TME mimic model showing steps for collecting conditioned media (CM) from human pancreatic normal fibroblasts (n-fibroblasts) co-cultured with human pancreatic cancer-associated fibroblasts (CAFs) under hypoxic only or hypoxic/gemcitabine (gem)-induced stress conditions (upper panels); and for co-culturing pancreatic cancer cells with macrophages to isolate cells exhibiting direct cell-to-cell transfer (double fluorescent cells; DFCs) and to generate derivative cells. MØ: macrophage, CMTMR: 5-(and-6)-(((4-chloromethyl)benzoyl)amino)tetramethylrhodamine, CMFDA 5-chloromethylfluorescein diacetate, FACS fluorescence-activated cell sorting, STR short tandem repeat. b Morphological changes of total cultured cells with increased numbers of vacuoles, enlarged cytoplasm, and multiple TNTs at the end of the Seeding phase, prior to collection of the cells for FACS. Arrowheads denote TNTs. c Percentage of isolated Panc0203CMTMR (red), MØ-U937CMFDA (green), and DFCs (blue) detected via FACS following preparation of adherent and detached cells from total cultured cells. Detached cells represent dying cells. d, e Percentage of adherent double fluorescent dye-positive cells (DFCs) for FACS gating in the (d) gemcitabine-treated TME mimic model or (e) normal co-culture TME condition. The percentages in the graphs indicate the percentage of adherent DFCs. +Gem; gemcitabine-treated TME mimic model, no Gem; normal co-culture TME condition. f Confocal images of single-fluorescent dye-positive cells (SFCs) and DFCs (red box, a merged image of entire z-stack with orthogonal views in the same field). Green SFCs and red SFCs in the confocal images indicate MØ-U937CMFDA and Panc0203CMTMR, respectively (scale bar, 10 μm).
Fig. 2
Fig. 2. Enhanced anchorage-independent growth or invasive activity of pancreatic derivative cells from direct cell-to-cell transfer.
a Representative morphologic and spatial patterns of Panc0203 cells and derivative cells. Representative images of confluent SP0926 and SP1030 cells show increased numbers of vacuoles or enlarged cytoplasm. Phase images of less confluent cells show a more dispersed growth pattern of SP0926 cells compared to that of SP1030 and maternal Panc0203 cells. b Basal levels of aldehyde dehydrogenase (ALDH) activity of the derivative cells compared to Panc0203 cells. DEAB: N,N-diethylaminobenzaldehyde. c Significantly different tumorsphere formation activities in the SP0926 and SP1030 clones. Spheroids were counted on day 7 after seeding. Upper panel shows representative images of tumorspheres, and lower panel shows relative number of tumorspheres compared to the Panc0203 cell group (left) and diameter of tumorspheres (right). d Increased invasion activity of SP0926 cells compared to the parent Panc0203 cell line. An invasion chamber assay system containing Matrigel was performed for 24 h. The initial seeding number of cells for each group was 1 × 105. Upper chamber: serum-free medium, bottom chamber: normal culture medium. *P ≤ 0.05; **P ≤ 0.01; ***P ≤ 0.001. One-way ANOVA followed by Tukey’s multiple comparison test. Data are presented as the mean values ± SD.
Fig. 3
Fig. 3. Multi-omic analyses showing metabolic reprogramming in pancreatic derivative cancer cells derived via direct cell-to-cell transfer.
a Transcriptomic comparison between SP0926 and Panc0203 cells. Left panel shows genes of SP0926 cells differentially expressed compared to parent Panc0203 cells, sorted via RNA sequencing. The top 20 up-regulated (red) and down-regulated (blue) genes are depicted according to fold change. Right upper panel shows the list of the top 10 enriched gene sets in SP0926 cells compared to Panc0203 cells, determined via gene set enrichment analysis (GSEA) using hallmark gene sets (http://www.gsea-msigdb.org/gsea/msigdb/index.jsp). The table shows the number of genes in the gene sets (SIZE), enrichment score (ES), normalized enrichment score (NES), nominal P-value (NOM P-value), false discovery rate (FDR Q-value), and family-wise error rates (FWER Q-value). Right lower panel represents GSEA score curve for ‘HYPOXIA’ and ‘EPITHELIAL_MESENCHYMAL_TRANSITION’ gene sets. b Transcriptomic comparison between SP1030 cells and Panc0203 cells. Left panel shows genes of SP1030 cells differentially expressed compared to parent Panc0203 cells, determined via RNA sequencing. The top 20 up-regulated (red) and down-regulated (blue) genes are depicted according to fold change. Right upper panel shows the list of the top 10 enriched gene sets in SP1030 cells compared to Panc0203 cells determined via gene set enrichment analysis (GSEA) using hallmark gene sets. The table shows the number of genes in gene sets (SIZE), enrichment score (ES), normalized enrichment score (NES), nominal P-value (NOM P-value), false discovery rate (FDR Q-value), and family-wise error rates (FWER Q-value). Right lower panel represents GSEA score curve for ‘CHOLESTEROL_HOMEOSTASIS’ and ‘HYPOXIA’ gene sets. c Ten protein spots similarly upregulated (fold change ≥2; red circles) in both SP0926 and SP1030 cells compared to Panc0203 cells were analyzed using μLC-MS/MS. Among the 10 pairs of spots, two pairs have no significant hits to report. Sixteen proteins were identified in the remaining eight pairs of spots in which ~40% of the pairs were identified as containing multiple proteins. d STRING network analysis of interactions among 16 genes that were up-regulated in both SP0926 and SP1030 cells compared to Panc0203 cells. The analysis was performed by the option of ‘minimum required interaction score: median confidence (0.400)’ and ‘maximum number of interactors to show: no more than 10 interactions (1st shell)’. Functional enrichment analysis was performed for gene sets from the KEGG pathway, and red and blue dots indicate genes belonging to the KEGG pathway enriched in derivative cells. e PGK1 was detected by ELISA using lysates from normoxic (upper panel) and hypoxic (48 h; lower panel) Panc0203, SP0926, and SP1030 cells. Data are presented as the mean values ±SD.
Fig. 4
Fig. 4. Regulation of CD24 and CD44 associated with anchorage-independent growth and invasive activities.
a Confocal microscopy (left) and flow cytometry (right) were performed using specific antibodies for CD24 and CD44 labeled with PE and APC, respectively. b, c Suppression of tumorsphere formation activity (b) and invasion activity (c) by treatment with either or both of the anti-CD24 and CD44 antibodies. The tumorsphere assay was conducted for 7 days, and the invasion chamber assay system containing Matrigel was performed for 24 h. The relative number of tumorspheres compared to the percentage of Panc0203 cells group treated by IgG control (b, left). Diameter of tumorspheres (b, right). d Effect of CD24 short hairpin RNA (shRNA) on the invasion activity of Panc0203 and SP1030 cells. An invasion chamber assay system containing Matrigel was performed for 24 h. Data are presented as the mean values ±SD.
Fig. 5
Fig. 5. Roles of MCT1 in anchorage-independent growth and invasive activities of pancreatic derivative cells generated via direct cell-to-cell transfer.
a Comparison of SLC16A1 transcript (Fragments Per Kilobase of transcript per Million; FPKM, left) and MCT1 protein (right) expression levels among Panc0203, SP0926, and SP1030 cells. SLC16A1 transcript levels were estimated by RNA sequencing and MCT1 protein levels were evaluated by western blotting. Arrow and arrow head indicate a dimer form (95–100 kDa) and monomer forms (43–48 kDa), respectively (right, upper). Uncut and unprocessed scans for MCT1 and beta-actin are shown in Supplementary Fig. 5i. b L-lactate concentration in the collected media (left) and l-lactate amount in the 1 × 106 collected cells (right) at 72 h following 3.5 × 105 cells seeding per six-well plates. *P ≤ 0.05; **P ≤ 0.005. One-way ANOVA followed by Tukey’s multiple comparison test. c Inhibition of tumorsphere formation activity by the MCT1 inhibitor AZD3965 (20 μM) compared with DMSO group (Mock). The first-round tumorspheres were observed on day 10 after seeding, and the second-round tumorsphere assay was conducted for 11 days followed by dissociation of the whole spheroids from the first round. d MCT1-dependent invasive activity. Cells were cultured for 24 h in the presence of DMSO or 20 μM AZD3965 in both the upper and bottom chambers. *P ≤ 0.05 as compared to DMSO control (unpaired t test). Data are presented as the mean values ±SD.
Fig. 6
Fig. 6. Clinical significance of CD24, CD44, and SLC16A1 expression in pancreatic cancer-patient tissue samples.
a Kaplan–Meier plot for overall survival of pancreatic cancer patients with high or low expression of CD24, CD44, or SLC16A1. Patients in the TCGA Pancreatic Cancer (PAAD) database (n = 182) were divided into two groups (median cutoff) with either high or low expression of CD24 (left), CD44 (middle), or MCT1 (right). Red and blue lines indicate samples with high or low expression, respectively, of each gene. Each median survival and P-value, determined by a log rank test, is indicated. b Gene set enrichment analysis (GSEA) using hallmark gene sets (http://www.gsea-msigdb.org/gsea/msigdb/index.jsp) between pancreatic cancer patients with high or low expression of CD24, CD44, or SLC16A1. Left panel shows the top 10 enriched gene sets in patients with high expression of genes [upper: CD24, middle: CD44, bottom: SLC16A1]. Right panel shows representative GSEA score curves enriched in patients with high expression of these genes (upper: CD24, middle: CD44, bottom: SLC16A1). c Effect of combined (in pairs) gene expression of CD24, CD44, and SLC16A1 on overall survival of pancreatic cancer patients. Kaplan-Meier plots for overall survival according to patient groups based on the combined gene expression (median cutoff) effects are indicated (left: CD24 and CD44, middle: CD24 and SLC16A1, right: CD44 and SLC16A1).

Similar articles

Cited by

References

    1. Venkatesan S, Swanton C, Taylor BS, Costello JF. Treatment-induced mutagenesis and selective pressures sculpt cancer evolution. Cold Spring Harb. Perspect. Med. 2017;7:a026617. - PMC - PubMed
    1. Landau DA, Carter SL, Getz G, Wu CJ. Clonal evolution in hematological malignancies and therapeutic implications. Leukemia. 2014;28:34–43. - PMC - PubMed
    1. Gerlinger M. Targeted drugs ramp up cancer mutability. Science. 2019;366:1452–1453. - PubMed
    1. Raynaud F, Mina M, Tavernari D, Ciriello G. Pan-cancer inference of intra-tumor heterogeneity reveals associations with different forms of genomic instability. PLoS Genet. 2018;14:e1007669. - PMC - PubMed
    1. Andor N, Maley CC, Ji HP. Genomic instability in cancer: teetering on the limit of tolerance. Cancer Res. 2017;77:2179–2185. - PMC - PubMed