. 2022 Oct 27;12(1):18116.
doi: 10.1038/s41598-022-21425-8.

Sarcomere dynamics revealed by a myofilament integrated FRET-based biosensor in live skeletal muscle fibers

Affiliations

Sarcomere dynamics revealed by a myofilament integrated FRET-based biosensor in live skeletal muscle fibers

Ashley A Martin et al. Sci Rep. .

Abstract

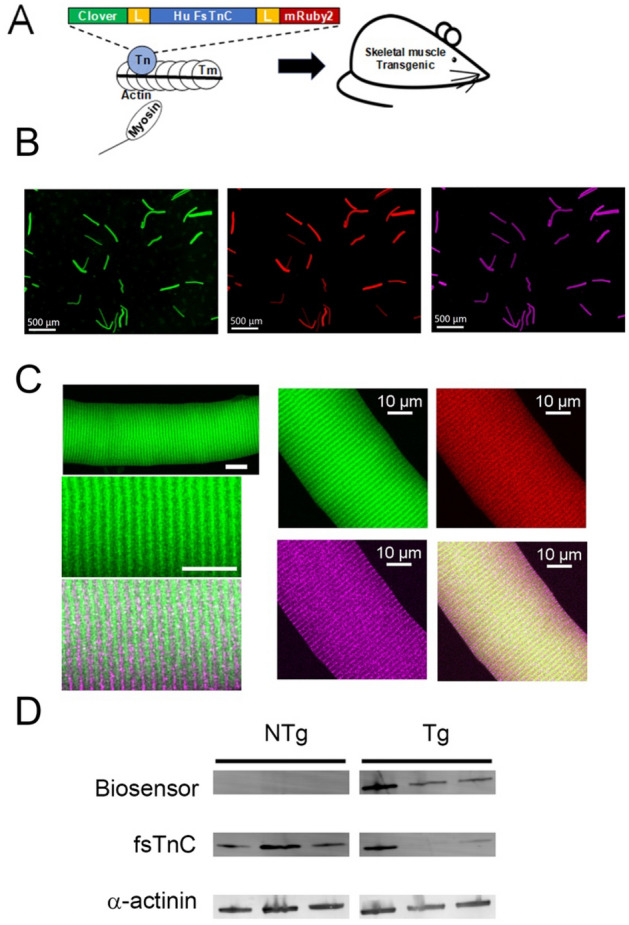
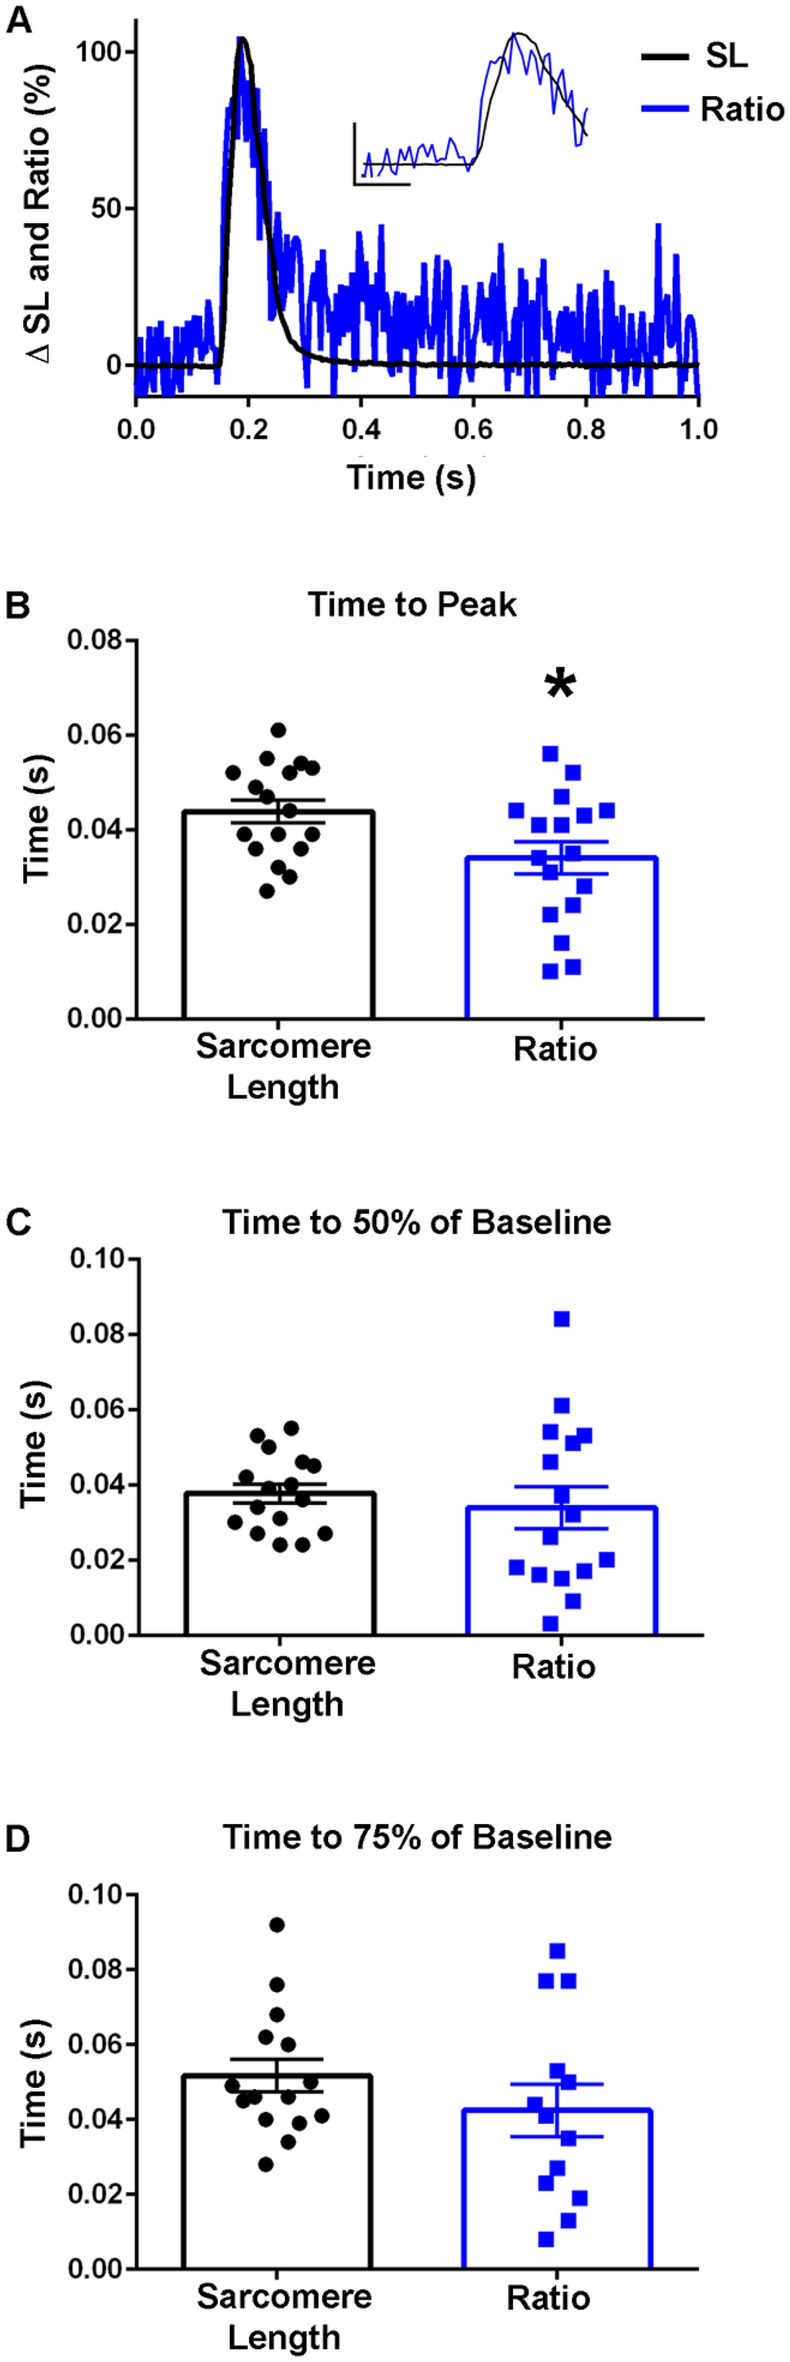
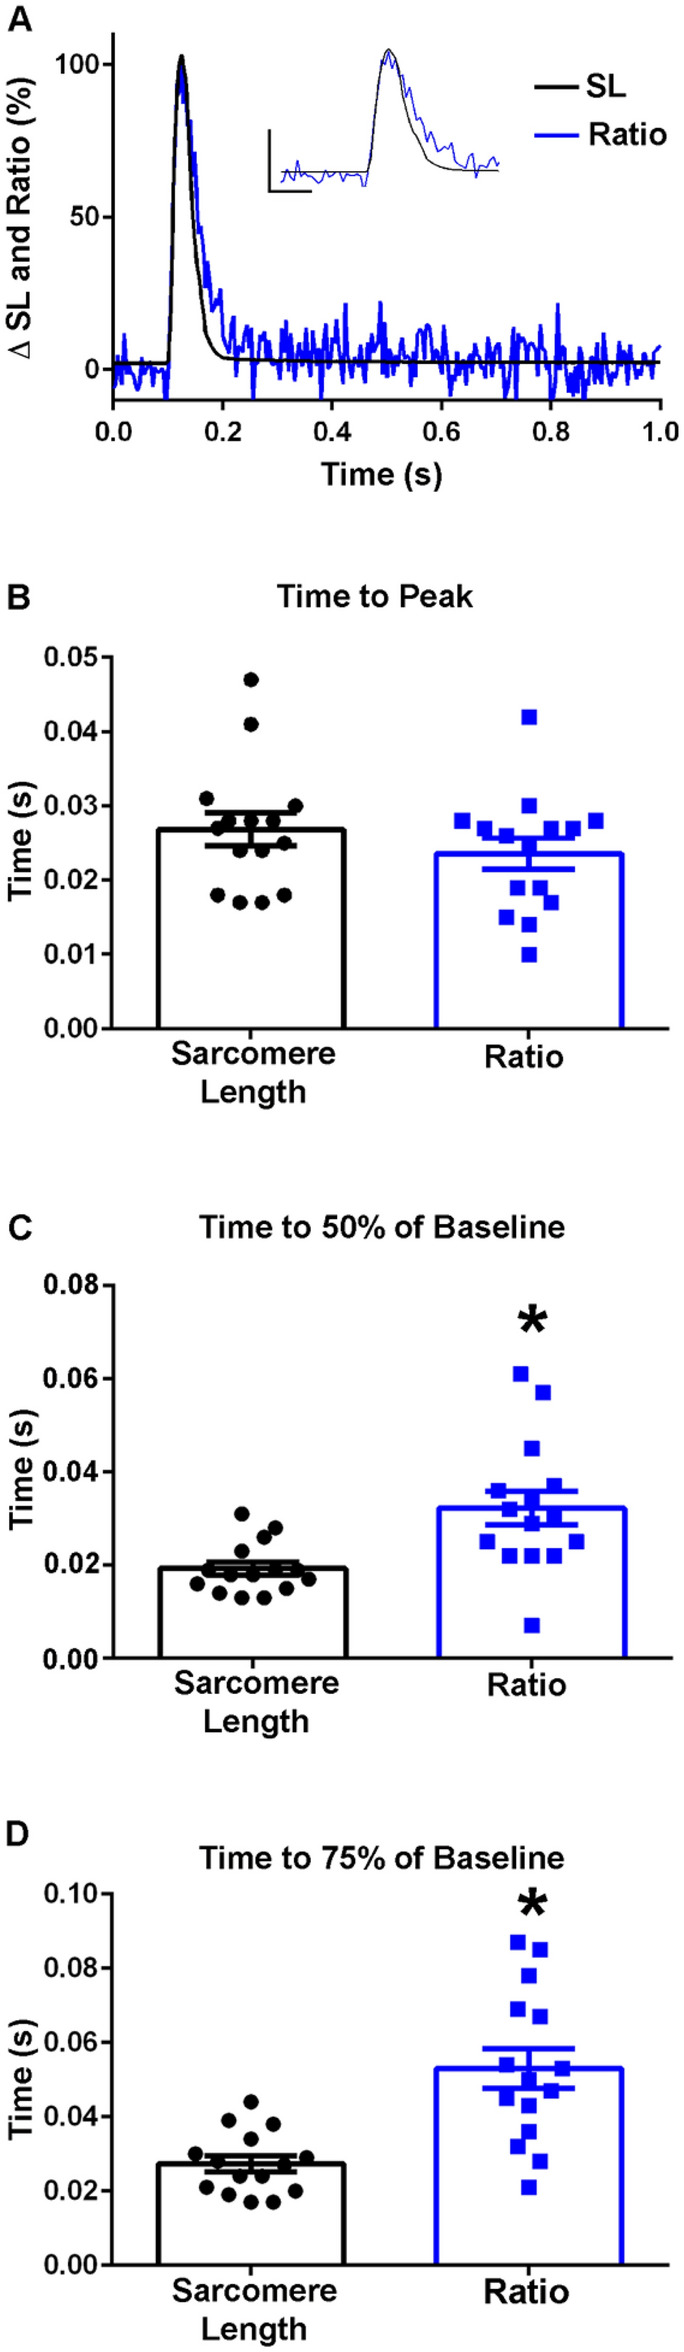
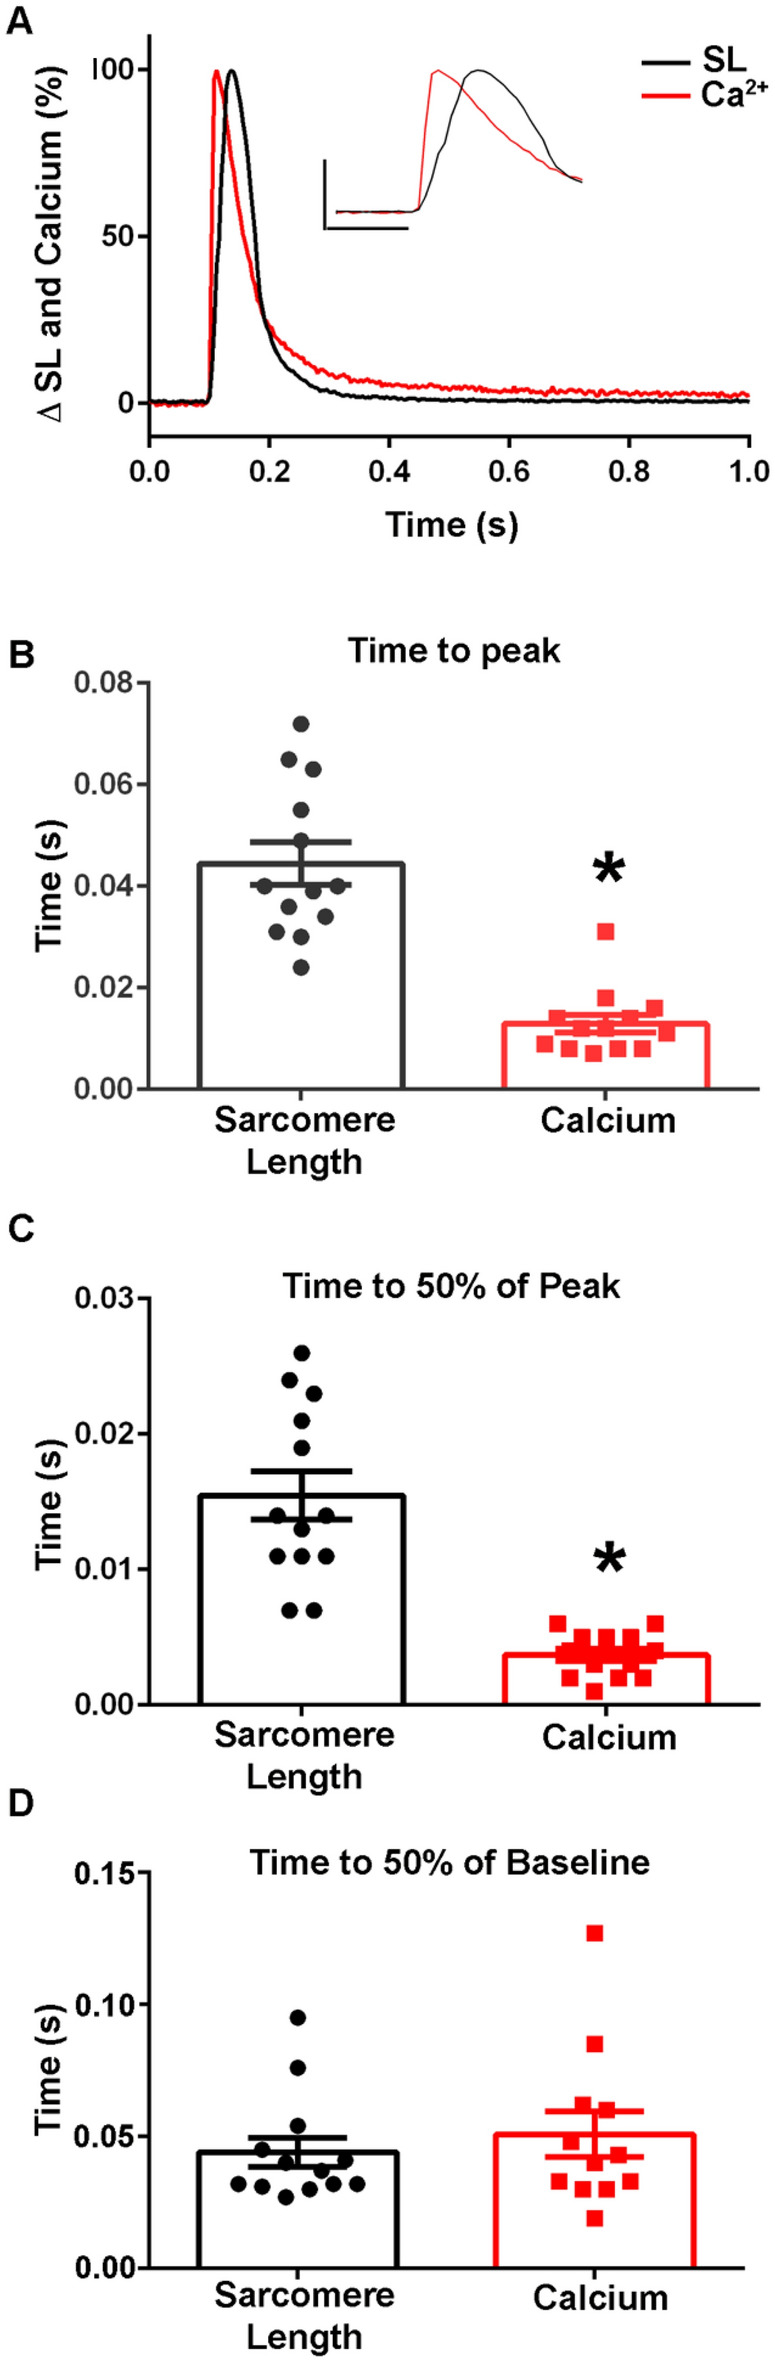
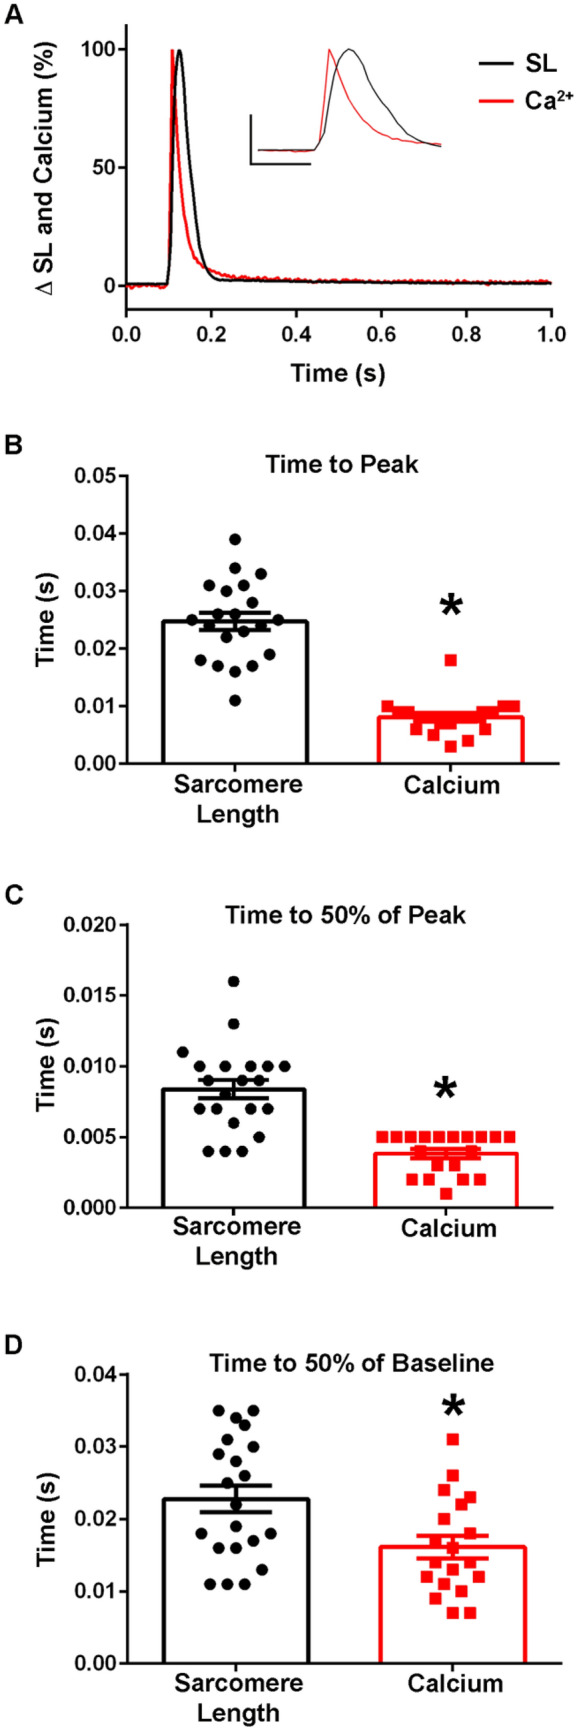
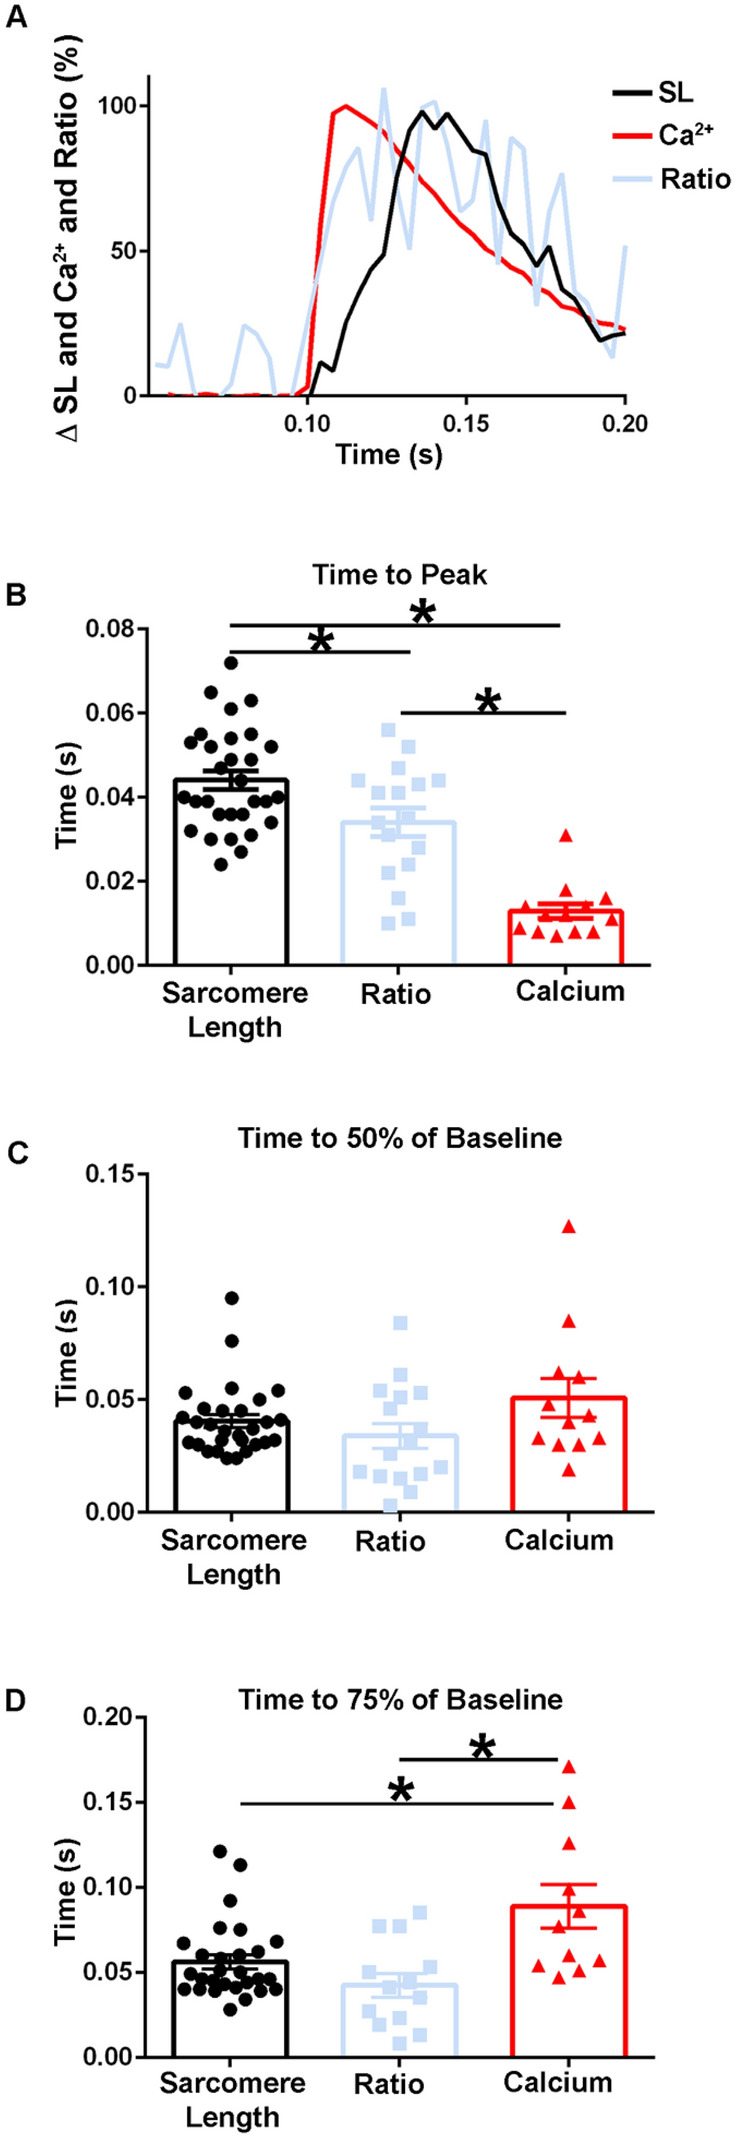
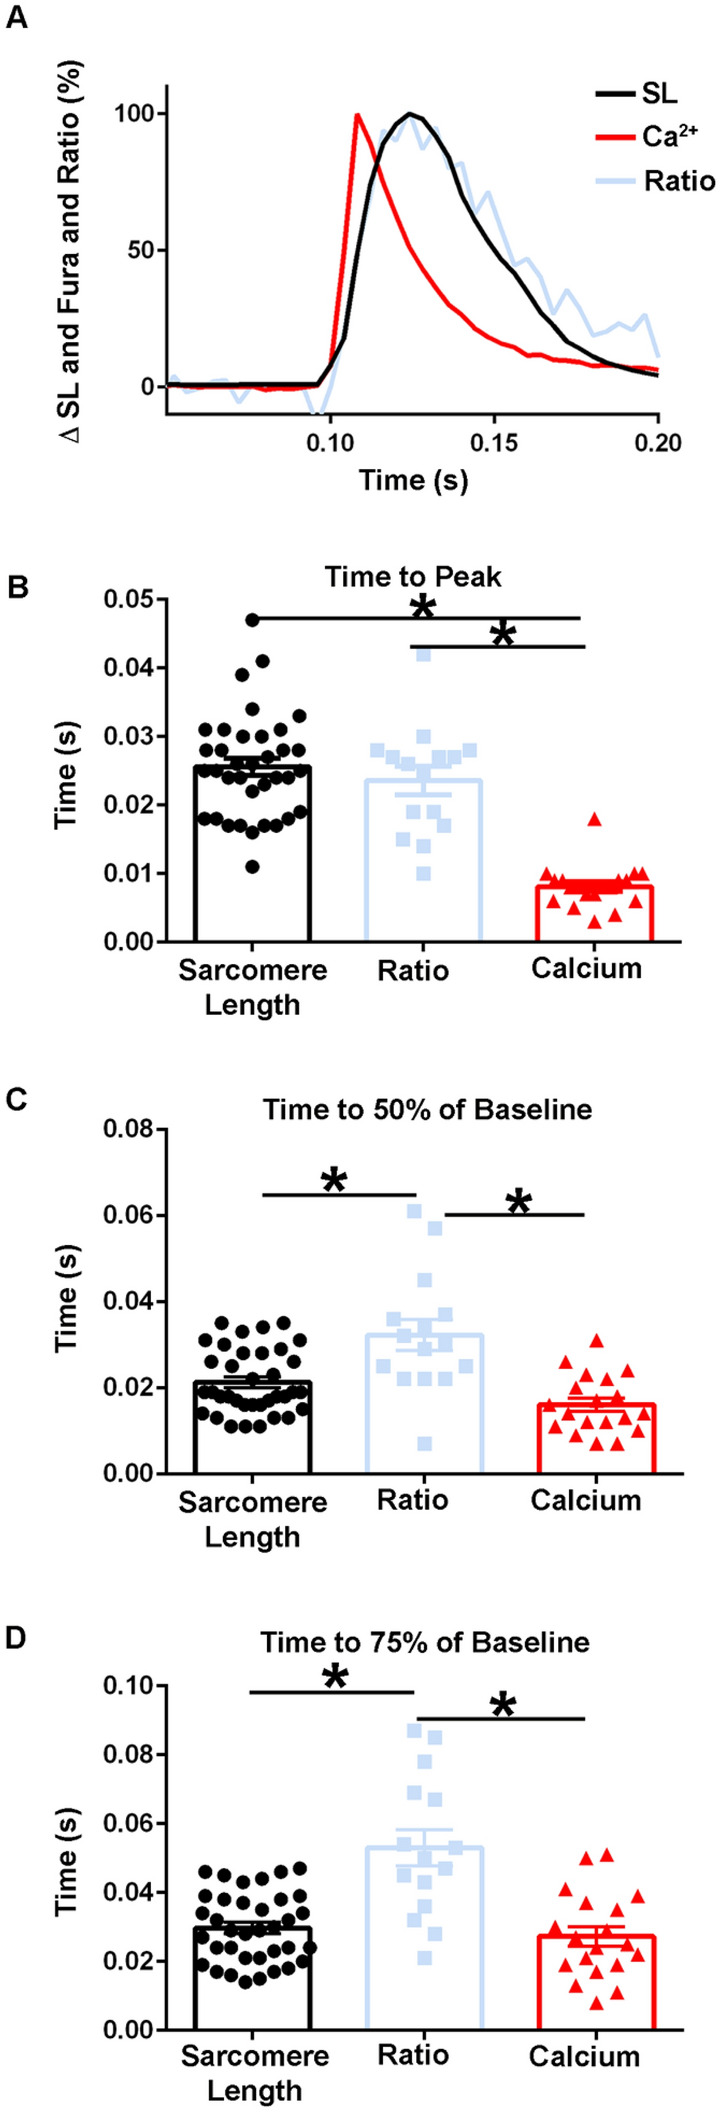
The sarcomere is the functional unit of skeletal muscle, essential for proper contraction. Numerous acquired and inherited myopathies impact sarcomere function causing clinically significant disease. Mechanistic investigations of sarcomere activation have been challenging to undertake in the context of intact, live skeletal muscle fibers during real time physiological twitch contractions. Here, a skeletal muscle specific, intramolecular FRET-based biosensor was designed and engineered into fast skeletal muscle troponin C (TnC) to investigate the dynamics of sarcomere activation. In transgenic animals, the TnC biosensor incorporated into the skeletal muscle fiber sarcomeres by stoichiometric replacement of endogenous TnC and did not alter normal skeletal muscle contractile form or function. In intact single adult skeletal muscle fibers, real time twitch contractile data showed the TnC biosensor transient preceding the peak amplitude of contraction. Importantly, under physiological temperatures, inactivation of the TnC biosensor transient decayed significantly more slowly than the Ca2+ transient and contraction. The uncoupling of the TnC biosensor transient from the Ca2+ transient indicates the biosensor is not functioning as a Ca2+ transient reporter, but rather reports dynamic sarcomere activation/ inactivation that, in turn, is due to the ensemble effects of multiple activating ligands within the myofilaments. Together, these findings provide the foundation for implementing this new biosensor in future physiological studies investigating the mechanism of activation of the skeletal muscle sarcomere in health and disease.


Conflict of interest statement

The authors declare no competing interests.

Figures

Figure 1
Figure 1
TnC biosensor transgene construction, localization, and expression. (A) The human fast skeletal muscle troponin C (h-fsTnC) cDNA was engineered and flanked on the 5’-end by a 19 amino acid flexible linker and the green fluorescent protein Clover and on the 3’-end by an 8 amino acid flexible linker and the red fluorescent protein mRuby2. (B) Low magnification immunofluorescence images of isolated FDB fibers demonstrating Clover (green) and mRuby2 (red) expression and α-actinin staining (purple) (scale bar = 500 μm). (C) High magnification immunofluorescence images of isolated FDB fibers. Left panel contains confocal images which show myofilament localization of the TnC biosensor (Clover-green, α-actinin – purple) (Top scale bar = 20 μm, bottom scale bar = 10 μm). Right panel images of same FDB fibers demonstrating co-localization of Clover (green) and mRuby2 (red) resulting in yellow (lower right panel) in correct orientation between Z-lines show by α-actinin staining (purple). (D) Western blot of fsTnC expression probed with anti-fsTnC antibody in transgenic EDL myofibers shows stoichiometric replacement of endogenous fsTnC (18 kDa) by the higher molecular weight biosensor fsTnC (72 kDa). The blot was also probed with an antibody for α-actinin (103 kDa) as a loading control. For clarity, the blot has been spliced to remove intervening non-specific bands. The full, labelled, blot is provided in the supplement (Supplementary Figs.1, 2).
Figure 2
Figure 2
Expression of the fsTnC biosensor does not alter muscle weight or fiber type. (A) Immunofluorescence imaging of transverse muscle sections from extensor digitorum longus (EDL) and soleus (SOL) muscles from transgenic and non-transgenic animals stained with antibodies against Type I and Type II myosin heavy chain (scale bar = 50 μm). (B) Analysis of percentages of Type I and Type II fibers in EDL and SOL muscles from transgenic (n = 6) and non-transgenic (n = 6) animals. There is no significant difference between muscle type or genetic background. (C) Analysis of muscle weights as normalized to tibia length for tibialis anterior (TA), gastrocnemius (Gast), extensor digitorum longus (EDL), and soleus (SOL) muscles from transgenic (n = 10) and non-transgenic (n = 8) animals. There are no significant differences between muscle type or genetic background. Values are Mean ± S.E.M.
Figure 3
Figure 3
Biochemical and steady-state biophysical analysis of TnC biosensor. (A) Calcium dissociation rates of the N-terminal of the control TnC peptide using Quin2 (a) and the N-terminal of the TnC-FRET peptide using 600 nm wavelength for mRuby2 (b) and 530 nm wavelength for Clover (c). (B) Relative tension developed as skinned EDL muscle was exposed to solutions of increasing calcium concentrations. Non-transgenic ([NTg, (n = 5 muscles from n = 3 animals)] and transgenic [Tg, (n = 8 muscles from n = 4 animals)] were used. Tension was normalized to the pCa 4.0 value obtained in each preparation. (C) Summary statistics of calcium concentration at half-maximal activation (pCa50) for NTg and Tg muscles showed no significant differences. (D) Summary statistics of the Hill coefficient value (nHill) for NTg and Tg muscles showed no significant differences. (E) Summary statistics of passive tension measurements for NTg and Tg muscles showed no significant differences. (F) Summary statistics of max relative tension measurements for NTg and Tg muscles showed no significant differences. (G) Combined graph of relative tension and fluorescence ratio changes as skinned EDL muscle exposed to solutions of increasing calcium concentration. Tension was normalized to the pCa 4.0 value obtained in each preparation (n = 6 muscle halves from n = 2 animals) and ratio fluorescence was normalized to the pCa 6.0 value obtained in each preparation (n = 5 muscle halves from n = 2 animals). (H) Summary statistics of calcium concentration at half-maximal activation (pCa50) for relative tension and FRET ratio fluorescence showed a significant difference in the pCa50 values. (P < 0.05). Mean ± S.E.M. data are presented.
Figure 4
Figure 4
TnC biosensor expression and integration does not impact sarcomere function during a twitch contraction. (A) Ensemble average of normalized (0–100%) amplitude of sarcomere length changes during a single twitch contraction for non-transgenic (black) and transgenic (green) isolated FDB fibers. (B) Summary statistics of baseline sarcomere length from non-transgenic and transgenic isolated FDB fibers show there is no significant difference between groups. (C) Summary statistics for the peak sarcomere length from non-transgenic and transgenic isolated FDB fibers demonstrate there is no significant difference between groups. (D) Summary statistics for the time to peak from non-transgenic and transgenic isolated FDB fibers demonstrate there is no significant difference between groups. (E) Summary statistics for the time to 50% of baseline in isolated FDB fibers from non-transgenic and transgenic animals show no significant difference between groups. Myofibers measured at room temperature with 0.2 Hz stimulation, NTg: n = 19 fibers from n = 3 animals and Tg: n = 26 fibers from n = 7 animals. Mean ± S.E.M. are presented, *P < 0.05.
Figure 5
Figure 5
TnC biosensor transient in unloaded intact FDB myofibers at room temperature. (A) Normalized traces (0–100%) of an ensemble average of biosensor ratio fluorescence (blue) and sarcomere length (black) dynamics which demonstrates the biosensor ratio transient peak precedes the peak of the sarcomere length transient. Inset shows same data and serves to highlight the differences of the peak timing (y-axis represents a 50% change from baseline, x-axis represents 0.10 s). (B) Summary statistics for time to peak for the biosensor ratio and sarcomere length indicate peak activation of the biosensor ratio (0.0341 ± 0.0034 s) occurred significantly before the peak sarcomere length change (0.0438 ± 0.0024) s (n = 17 myofibers from 11 animals in each group). (C) Summary statistics for the time to 50% of baseline for the biosensor ratio and sarcomere length demonstrated no significant difference between the ratio or sarcomere length (n = 16 myofibers from n = 11 animals in each group). (D) Summary statistics for the time to 75% of baseline for the biosensor fluorescence ratio and sarcomere length changes showed no significant difference in the relaxation dynamics of the biosensor and sarcomere length (Sarcomere length: n = 15, Ratio: n = 13 from n = 9 animals). Myofibers measured at room temperature with 0.2 Hz stimulation. Mean ± S.E.M. are presented, *P < 0.05.
Figure 6
Figure 6
TnC biosensor transient in intact FDB myofibers at 37 °C. (A) Normalized traces (0–100%) of an ensemble average of biosensor ratio fluorescence (blue) and sarcomere length (black) dynamics. Inset shows same data and serves to highlight the region of the peak amplitude (y-axis represents a 50% change from baseline, x-axis represents 0.05 s). (B) Summary statistics for time to peak for the biosensor ratio and sarcomere length shows timing of the peak activation of the biosensor ratio is not significantly different from the time to peak of the sarcomere length (n = 15 myofibers in each group from n = 7 animals). (C) Summary statistics for the time to 50% of baseline for the biosensor ratio and sarcomere length demonstrate that biosensor inactivation (0.0323 ± 0.0036 s) was delayed relative to the relaxation of the myofiber (0.0193 ± 0.0014 s) (n = 15 myofibers in each group from n = 7 animals). (D) Summary statistics for the time to 75% of baseline for the biosensor fluorescence ratio and sarcomere length showed a significant difference in the relaxation dynamics of the biosensor and sarcomere length, with the biosensor inactivation (0.0530 ± 0.0053 s) slower than the sarcomere length relaxation of the myofiber (0.0274 ± 0.0022 s) (n = 15 myofibers in each group from n = 7 animals). Myofibers measured at 37 °C with 0.2 Hz stimulation. Mean ± S.E.M. are presented, *P < 0.05.
Figure 7
Figure 7
Calcium dynamics in isolated intact FDB myofibers at room temperature. (A) Normalized traces (0–100%) of an ensemble average of FURA-2 calcium fluorescence (red) and sarcomere length (black) dynamics showing that the calcium transient time to peak precedes the peak of the sarcomere length transient. Inset shows same data and serves to highlight the differences of the peak timing (y-axis represents a 50% change from baseline, x-axis represents 0.10 s). (B) Summary statistics for time to peak for the calcium transient and sarcomere length changes shows peak amplitude of the calcium transient occurs significantly before the peak sarcomere length change (n = 13 myofibers in each group from n = 3 animals). (C) Summary statistics for the time to 50% of peak for the calcium transient and sarcomere length demonstrates there is a significant difference between the calcium kinetics (0.0037 ± 0.0005 s) and sarcomere length changes (0.0155 ± 0.0018 s) (n = 13 myofibers in each group from n = 3 animals). (D) Summary statistics for the time to 50% of baseline for the calcium transient (0.0508 ± 0.0087 s) and sarcomere length changes (0.0440 ± 0.0056 s) shows there is no significant difference in the recovery dynamics of calcium and sarcomere length relaxation (Sarcomere length: n = 13, FURA-2: n = 12 from n = 3 animals). Myofibers measured at room temperature with 0.2 Hz stimulation. Mean ± S.E.M. are presented, *P < 0.05.
Figure 8
Figure 8
Calcium dynamics in isolated intact FDB myofibers at 37 °C. (A) Normalized traces (0–100%) of an ensemble average of FURA-2 calcium fluorescence (red) and sarcomere length (black) dynamics. Inset shows same data and serves to highlight the region of the peak amplitude (y-axis represents a 50% change from baseline, x-axis represents 0.10 s). (B) Summary statistics for time to peak of the calcium transient and sarcomere length changes shows timing of the peak calcium amplitude occurs significantly before the time to peak of the sarcomere length (Sarcomere length: n = 21, FURA n = 19 from n = 2 animals). (C) Summary statistics for the time to 50% of peak for the calcium transient and sarcomere length demonstrates that the calcium transient (0.0038 ± 0.0003 s) is significantly faster than the sarcomere length change (0.0084 ± 0.0006 s) (Sarcomere length: n = 21, FURA n = 19 from n = 2 animals). (D) Summary statistics for the time to 50% of baseline for the FURA-2 calcium transient and sarcomere length changes shows there is a significant difference in the recovery dynamics of the calcium transient and sarcomere length, with the calcium transient (0.0161 ± 0.0015 s) recovering more quickly than the relaxation of the myofiber (0.0228 ± 0.0018 s) (Sarcomere length: n = 21, FURA n = 19 from n = 2 animals). Myofibers measured at 37 °C with 0.2 Hz stimulation. Mean ± S.E.M. are presented, *P < 0.05.
Figure 9
Figure 9
Temporal alignment of sarcomere length, TnC biosensor transient, and calcium transient kinetics during a twitch at room temperature. (A) Normalized traces (0–100%) of an ensemble average of FURA-2 calcium fluorescence (red), biosensor ratio fluorescence (blue), and sarcomere length (black) dynamics. This figure is a graphic compilation of data shown in Figs. 6 and 8. (B) Summary statistics of the time to peak amplitude for sarcomere length, biosensor transient, and calcium transient shows the time to peak of the biosensor significantly precedes that of the sarcomere length, and the time to peak of calcium is reached before both the biosensor transient and sarcomere length (Sarcomere length: n = 30 myofibers from n = 14 animals, Ratio: n = 17 myofibers from n = 11 animals, FURA-2: n = 13 myofibers from n = 3 animals). (C) Summary statistics of the time to 50% of baseline for sarcomere length, biosensor ratio transient, and the calcium transient (Sarcomere length: n = 29 myofibers from n = 14 animals, Ratio: n = 16 myofibers from n = 11 animals, FURA-2: n = 12 myofibers from n = 3 animals). (D) Summary statistics for the time to 75% of baseline for sarcomere length, biosensor ratio transient, and calcium transient shows the calcium decay transient is significantly slower than both the relaxation of sarcomere length and the biosensor transient inactivation. (Sarcomere length: n = 29 myofibers from n = 14 animals, Ratio: n = 16 myofibers from n = 11 animals, FURA-2: n = 12 myofibers from n = 3 animals). Myofibers measured at room temperature with 0.2 Hz stimulation. Mean ± S.E.M. are presented, *P < 0.05.
Figure 10
Figure 10
Temporal alignment of sarcomere length, biosensor transient, and calcium transient kinetics in intact FDB fibers during a twitch at 37 °C. (A) Normalized traces (0–100%) of an ensemble average of FURA-2 calcium fluorescence (red), biosensor ratio fluorescence (blue), and sarcomere length (black) dynamics. This figure is a compilation of data shown in Figs. 7, 9. (B) Summary statistics of the time to peak amplitude for sarcomere length, biosensor transient, and calcium transient (Sarcomere length: n = 36 myofibers from n = 9 animals, Ratio: n = 15 myofibers from n = 7 animals, FURA-2: n = 19 myofibers from n = 2 animals). (C) Summary statistics of the time to 50% of baseline for sarcomere length, biosensor ratio transient, and the calcium transient show the biosensor transient inactivation is significantly slower than the relaxation of sarcomere length and the recovery of the calcium transient (Sarcomere length: n = 36 myofibers from n = 9 animals, Ratio: n = 15 myofibers from n = 7 animals, FURA-2: n = 19 myofibers from n = 2 animals). (D) Summary statistics for the time to 75% of baseline for sarcomere length, biosensor ratio fluorescence transient, and calcium transient shows the calcium decay transient is significantly faster than the biosensor transient inactivation, while biosensor inactivation is significantly slower than the relaxation of the sarcomere length. (Sarcomere length: n = 36 myofibers from n = 9 animals, Ratio: n = 15 myofibers from n = 7 animals, FURA: n = 19 myofibers from n = 2 animals). Myofibers measured at 37 °C with 0.2 Hz stimulation. Mean ± S.E.M. are presented, *P < 0.05.

References

    1. Gordon AM, Homsher E, Regnier M. Regulation of contraction in striated muscle. Physiol. Rev. 2000;80:853–924. - PubMed
    1. Gautel M, Djinović-Carugo K. The sarcomeric cytoskeleton: From molecules to motion. J. Exp. Biol. 2016;219:135–145. - PubMed
    1. Squire J. Special issue: The actin-myosin interaction in muscle: Background and overview. Int. J. Mol. Sci. 2019;20:1–39. - PMC - PubMed
    1. Bers DM. Cardiac excitation-contraction coupling. Nature. 2002;415:198–205. - PubMed
    1. Irving M. Regulation of contraction by the thick filaments in skeletal muscle. Biophys. J. 2017;113:2579–2594. - PMC - PubMed

Publication types