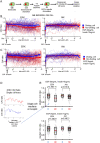
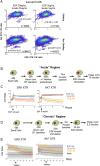
Relating individual cell division events to single-cell ERK and Akt activity time courses
- PMID: 36302844
- PMCID: PMC9613772
- DOI: 10.1038/s41598-022-23071-6
Relating individual cell division events to single-cell ERK and Akt activity time courses
Abstract
Biochemical correlates of stochastic single-cell fates have been elusive, even for the well-studied mammalian cell cycle. We monitored single-cell dynamics of the ERK and Akt pathways, critical cell cycle progression hubs and anti-cancer drug targets, and paired them to division events in the same single cells using the non-transformed MCF10A epithelial line. Following growth factor treatment, in cells that divide both ERK and Akt activities are significantly higher within the S-G2 time window (~ 8.5-40 h). Such differences were much smaller in the pre-S-phase, restriction point window which is traditionally associated with ERK and Akt activity dependence, suggesting unappreciated roles for ERK and Akt in S through G2. Simple metrics of central tendency in this time window are associated with subsequent cell division fates. ERK activity was more strongly associated with division fates than Akt activity, suggesting Akt activity dynamics may contribute less to the decision driving cell division in this context. We also find that ERK and Akt activities are less correlated with each other in cells that divide. Network reconstruction experiments demonstrated that this correlation behavior was likely not due to crosstalk, as ERK and Akt do not interact in this context, in contrast to other transformed cell types. Overall, our findings support roles for ERK and Akt activity throughout the cell cycle as opposed to just before the restriction point, and suggest ERK activity dynamics may be more important than Akt activity dynamics for driving cell division in this non-transformed context.
© 2022. The Author(s).
Conflict of interest statement
The authors declare no competing interests.
Figures


Similar articles
-
Low-frequency ERK and Akt activity dynamics are predictive of stochastic cell division events.NPJ Syst Biol Appl. 2024 Jun 4;10(1):65. doi: 10.1038/s41540-024-00389-7. NPJ Syst Biol Appl. 2024. PMID: 38834572 Free PMC article.
-
Roles of the RAF/MEK/ERK and PI3K/PTEN/AKT pathways in malignant transformation and drug resistance.Adv Enzyme Regul. 2006;46:249-79. doi: 10.1016/j.advenzreg.2006.01.004. Epub 2006 Jul 18. Adv Enzyme Regul. 2006. PMID: 16854453
-
Extracellular taurine induces angiogenesis by activating ERK-, Akt-, and FAK-dependent signal pathways.Eur J Pharmacol. 2012 Jan 15;674(2-3):188-99. doi: 10.1016/j.ejphar.2011.11.022. Epub 2011 Nov 23. Eur J Pharmacol. 2012. PMID: 22130357
-
Multiplexed Fluorescence Imaging of ERK and Akt Activities and Cell-cycle Progression.Cell Struct Funct. 2016 Jul 22;41(2):81-92. doi: 10.1247/csf.16007. Epub 2016 May 28. Cell Struct Funct. 2016. PMID: 27247077
-
The Role of PI3K/Akt and ERK in Neurodegenerative Disorders.Neurotox Res. 2019 Apr;35(3):775-795. doi: 10.1007/s12640-019-0003-y. Epub 2019 Feb 1. Neurotox Res. 2019. PMID: 30707354 Review.
Cited by
-
NaV1.1 contributes to the cell cycle of human mesenchymal stem cells by regulating AKT and CDK2.J Cell Sci. 2024 Oct 1;137(19):jcs261732. doi: 10.1242/jcs.261732. Epub 2024 Oct 10. J Cell Sci. 2024. PMID: 39258309 Free PMC article.
-
Low-frequency ERK and Akt activity dynamics are predictive of stochastic cell division events.NPJ Syst Biol Appl. 2024 Jun 4;10(1):65. doi: 10.1038/s41540-024-00389-7. NPJ Syst Biol Appl. 2024. PMID: 38834572 Free PMC article.
-
Promoted Skin Wound Healing by Tail-Amputated Eisenia foetida Proteins via the Ras/Raf/MEK/ERK Signaling Pathway.ACS Omega. 2023 Apr 5;8(15):13935-13943. doi: 10.1021/acsomega.3c00317. eCollection 2023 Apr 18. ACS Omega. 2023. PMID: 37091432 Free PMC article.
-
Mathematical Modeling and Inference of Epidermal Growth Factor-Induced Mitogen-Activated Protein Kinase Cell Signaling Pathways.Int J Mol Sci. 2024 Sep 23;25(18):10204. doi: 10.3390/ijms251810204. Int J Mol Sci. 2024. PMID: 39337687 Free PMC article. Review.
-
Phased ERK responsiveness and developmental robustness regulate teleost skin morphogenesis.Proc Natl Acad Sci U S A. 2025 Mar 11;122(10):e2410430122. doi: 10.1073/pnas.2410430122. Epub 2025 Mar 5. Proc Natl Acad Sci U S A. 2025. PMID: 40042905
References
-
- Santos SDM, Verveer PJ, Bastiaens PIH. Growth factor-induced MAPK network topology shapes Erk response determining PC-12 cell fate. Nat. Cell Biol. 2007;9:324–330. - PubMed
-
- Wei Z, Liu HT. MAPK signal pathways in the regulation of cell proliferation in mammalian cells. Cell Res. 2002;12:9–18. - PubMed
-
- Roberts PJ, Der CJ. Targeting the Raf-MEK-ERK mitogen-activated protein kinase cascade for the treatment of cancer. Oncogene. 2007;26:3291–3310. - PubMed
Publication types
MeSH terms
Substances
Grants and funding
LinkOut - more resources
Full Text Sources
Research Materials
Miscellaneous

