. 2022 Dec;32(12):1105-1123.
doi: 10.1038/s41422-022-00735-6. Epub 2022 Oct 27.

Targeting UHRF1-SAP30-MXD4 axis for leukemia initiating cell eradication in myeloid leukemia

Affiliations

Targeting UHRF1-SAP30-MXD4 axis for leukemia initiating cell eradication in myeloid leukemia

Cheng-Long Hu et al. Cell Res. 2022 Dec.

Abstract

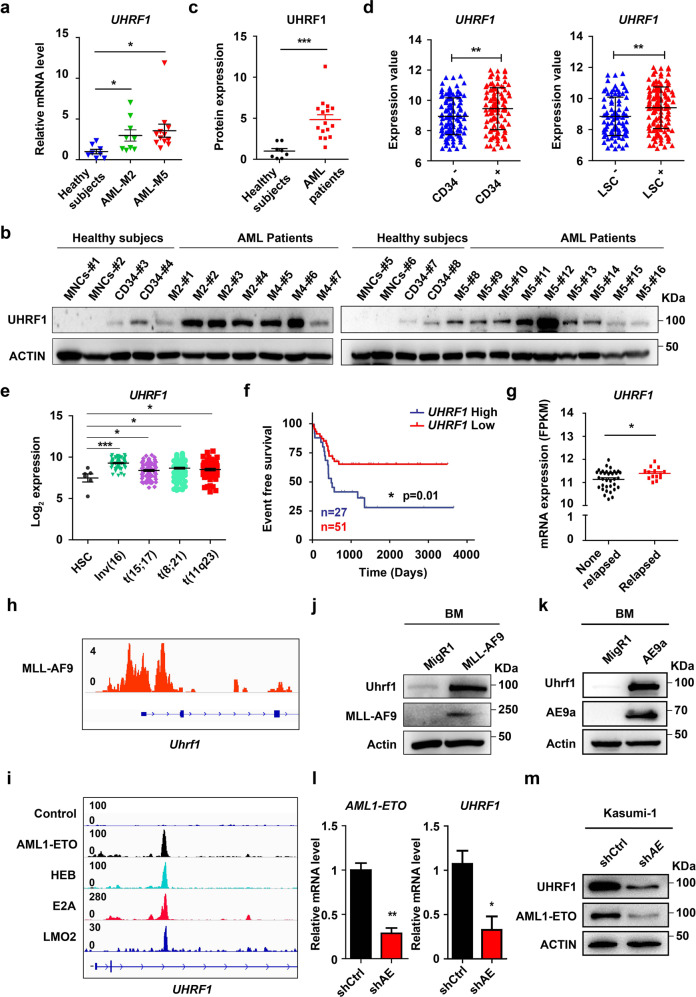
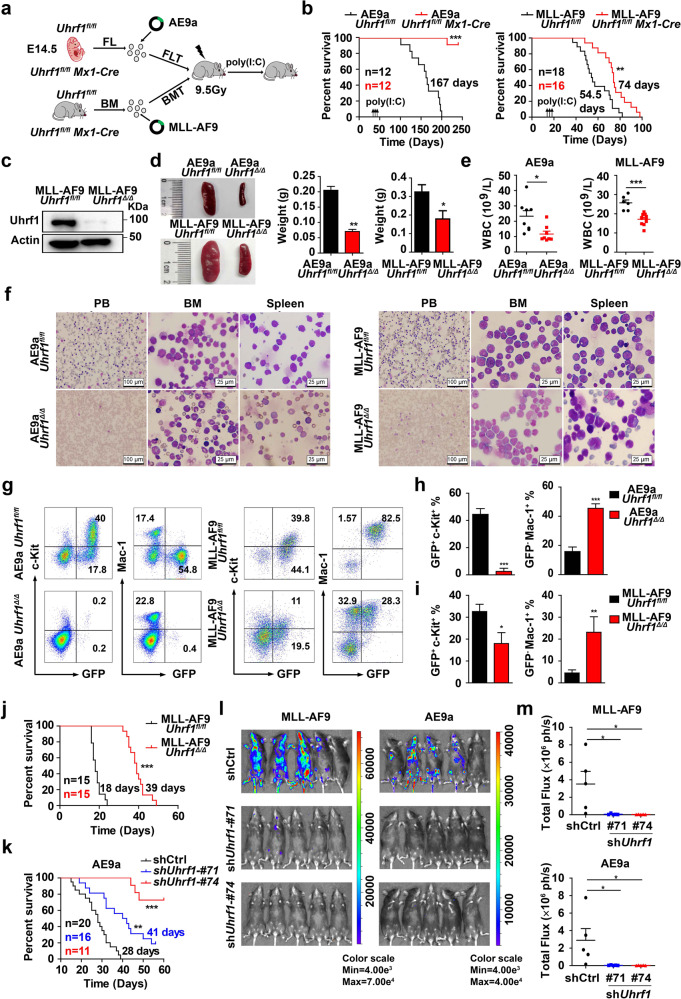
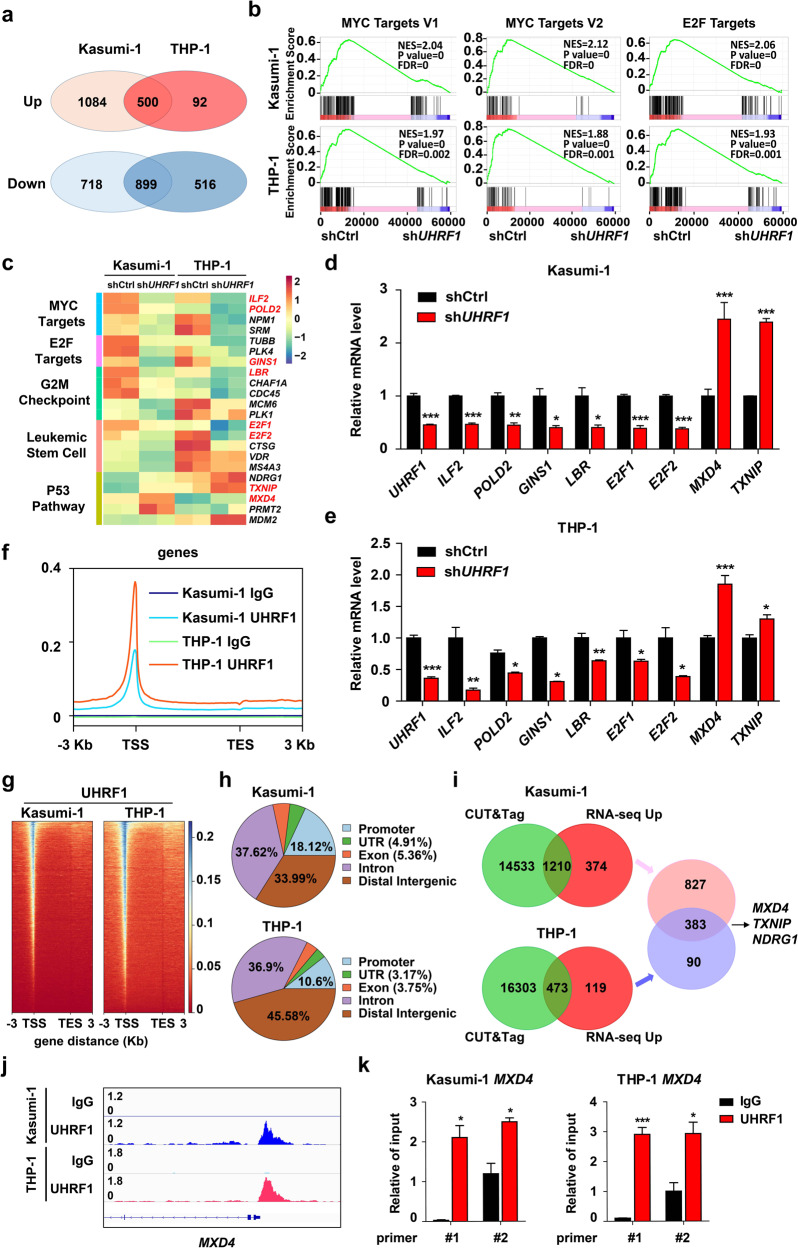
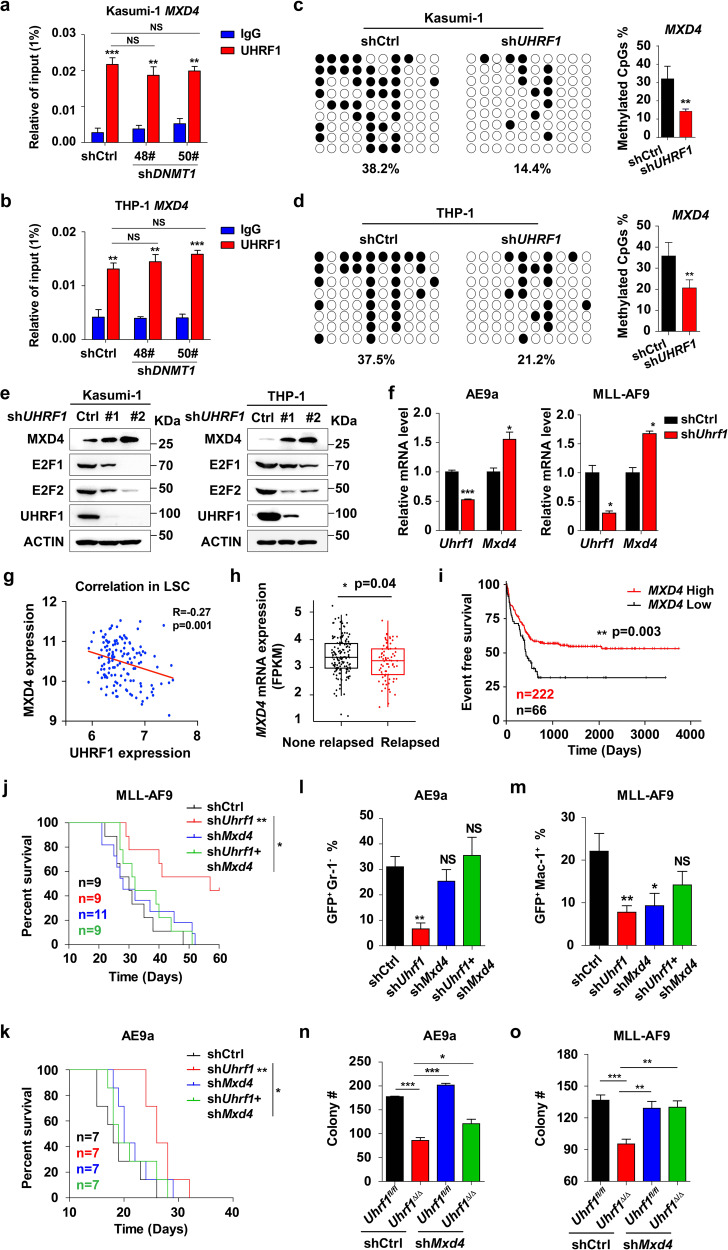
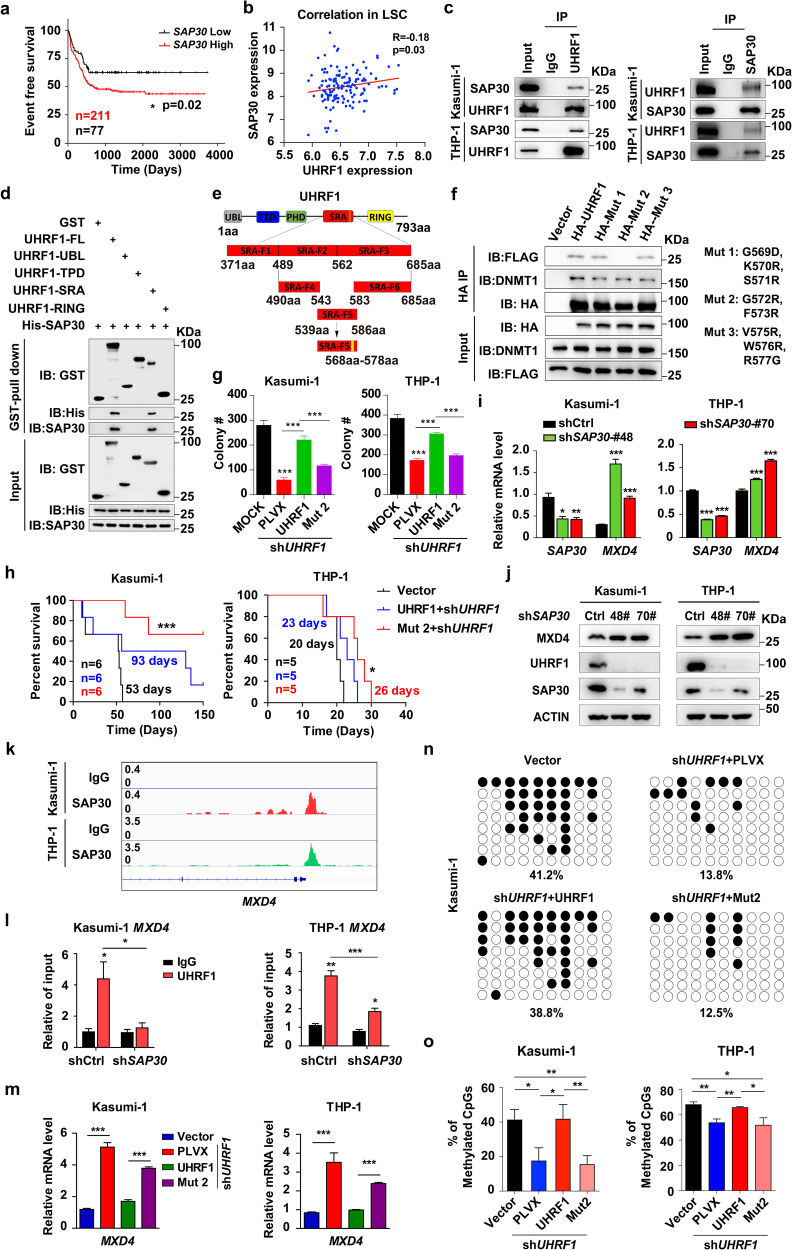
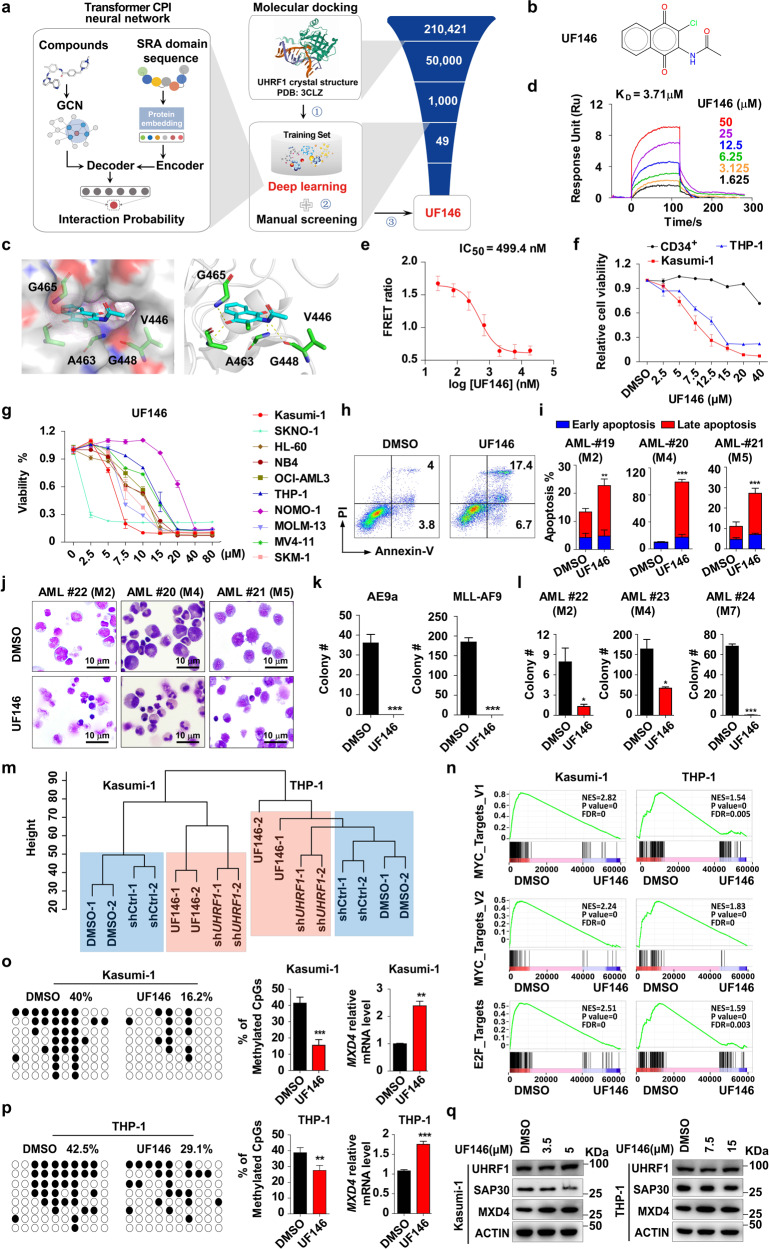
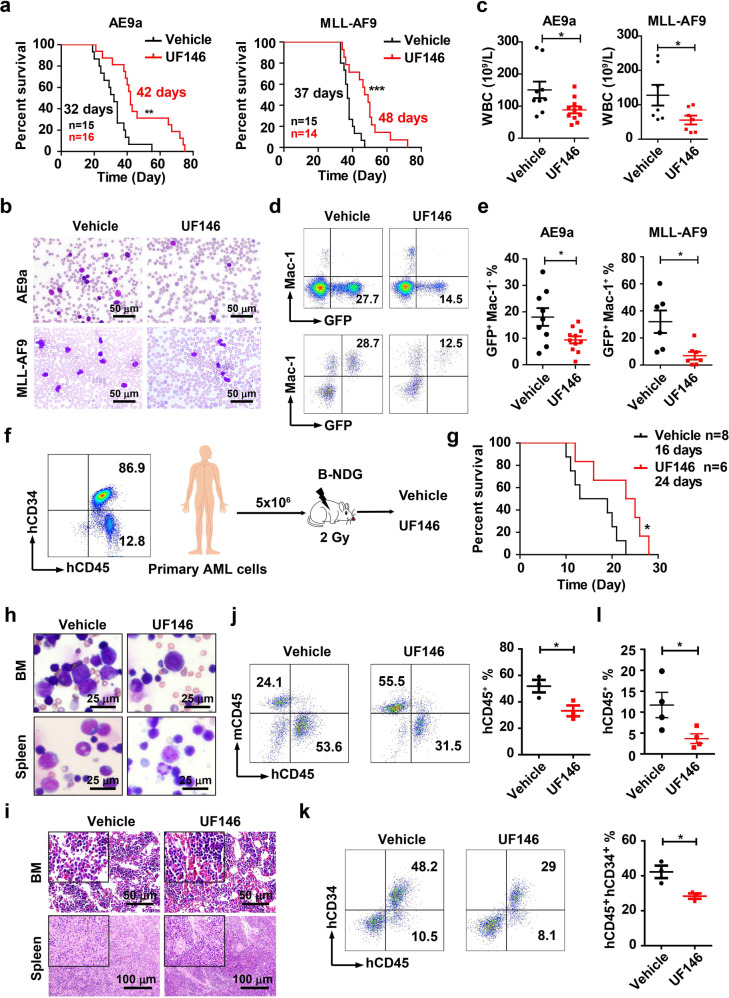
Aberrant self-renewal of leukemia initiation cells (LICs) drives aggressive acute myeloid leukemia (AML). Here, we report that UHRF1, an epigenetic regulator that recruits DNMT1 to methylate DNA, is highly expressed in AML and predicts poor prognosis. UHRF1 is required for myeloid leukemogenesis by maintaining self-renewal of LICs. Mechanistically, UHRF1 directly interacts with Sin3A-associated protein 30 (SAP30) through two critical amino acids, G572 and F573 in its SRA domain, to repress gene expression. Depletion of UHRF1 or SAP30 derepresses an important target gene, MXD4, which encodes a MYC antagonist, and leads to suppression of leukemogenesis. Further knockdown of MXD4 can rescue the leukemogenesis by activating the MYC pathway. Lastly, we identified a UHRF1 inhibitor, UF146, and demonstrated its significant therapeutic efficacy in the myeloid leukemia PDX model. Taken together, our study reveals the mechanisms for altered epigenetic programs in AML and provides a promising targeted therapeutic strategy against AML.


Conflict of interest statement

The authors declare no competing interests.

Figures

Fig. 1
Fig. 1. High expression of UHRF1 predicts poor prognosis in AML.
a The qPCR analysis of UHRF1 expression in BM mononuclear cells from AML patients (M2, n = 9; M5, n = 11) and healthy subjects (n = 8). b The Western blotting analysis of UHRF1 in BM cells of AML patients (n = 16), healthy mononuclear cord blood cells (MNCs) (n = 4) and CD34+ HSPCs (n = 4). c Quantification of the Western blotting analysis for b. d The microarray analysis of UHRF1 in CD34+ leukemia cells and LSCs of AML patients from GSE76009. (CD34+, n = 110; CD34, n = 117; n-LSC+, n = 138; n-LSC, n = 89). e The differential expression of UHRF1 in mononuclear BM or PB cells of AML patients [t(15;17), n = 87; Inv(16), n = 77; t(11q23), n = 88; t(8;21), n = 98)] and HSCs in healthy subjects (HSC, n = 6). Data were obtained from the microarray analysis of bloodpool. The samples were normalized and batch corrected using ComBat for full completeness of the dataset. PCA analysis and gene signature values were then calculated. f The event free survival of patients with t(8;21) leukemia was stratified by UHRF1 expression into UHRF1 high (n = 27) and low (n = 51) groups. The survival days (UHRF1 high: 510 days; UHRF1 low: 1067 days) mean the date of the event occurrence in AML patients such as relapse and drug resistance, etc. g The differential expression of UHRF1 in the relapsed (n = 14) and non-relapsed (n = 35) t(8;21) leukemia patients. h MLL-AF9 localizes at the promoter region of Uhrf1 in the CUT&Tag analysis of 32D cells transduced with MLL-AF9. i AML1-ETO, HEB, E2A and LMO2 colocalize at the gene body region of UHRF1 in the ChIP-seq analysis of Kasumi-1 cells. j, k The mouse BM cells transduced with MLL-AF9 (j) or AE9a (k) were analyzed. The anti-Uhrf1, anti-MLL1, anti-HA and anti-Actin antibodies were used for the Western blotting analysis. l, m Knockdown of AML1-ETO in Kasumi-1 cells decreased the mRNA (l) and protein (m) levels of AML1-ETO and Uhrf1. The anti-Uhrf1, anti-ETO and anti-Actin antibodies were used for the Western blotting analysis. Data are all presented as means ± SD. Statistical analyses were performed using Student’s unpaired t-test for a, ce, g, l. The expression values for e were log2 transformed. Statistical significance was evaluated by log-rank test for f. The mRNA expression for g were statisticed by FPKM from RNA-seq. *P < 0.05; **P < 0.01; ***P < 0.001.
Fig. 2
Fig. 2. Uhrf1 is required for the maintenance and progression of AML in mouse models of AE9a- or MLL-AF9-driven leukemia.
a The strategy of AE9a-expressing fetal liver cell transplantation (FLT) or MLL-AF9-expressing BM cell transplantation (BMT). Poly(I:C) was injected to AE9a recipients or MLL-AF9 recipients on week 4 or week 2 respectively. b Conditional deletion of Uhrf1 by poly(I:C) treatment significantly prolongs the survival time of recipient mice transplanted with AE9aUhrf1fl/fl Mx1-Cre (n = 12) or MLL-AF9Uhrf1fl/fl Mx1-Cre (n ≥ 16) cells. c The expression of Uhrf1 is minimal in the sorted GFP+ cells isolated from the spleen of the MLL-AF9Uhrf1fl/fl /MLL-AF9Uhrf1Δ/Δ mice. d The size and weight of the spleen were decreased in the AE9aUhrf1Δ/Δ and MLL-AF9Uhrf1Δ/Δ mice (n ≥ 3). e The WBC counts of AE9aUhrf1Δ/Δ or MLL-AF9Uhrf1Δ/Δ mice were significantly lower than AE9aUhrf1fl/fl or MLL-AF9Uhrf1fl/fl mice (n ≥ 6). f The PB, BM and spleen show less leukemia blast cells in the AE9a/MLL-AF9Uhrf1Δ/Δ mice group compared with the AE9a/MLL-AF9Uhrf1fl/fl group. gi Representative flow cytometry profiles (g) and quantification of the frequencies (h, i) of GFP+c-Kit+ leukemia blast cells and normal GFPMac1+ cells in the BM cells of AE9a/MLL-AF9Uhrf1Δ/Δ mice compared with AE9a/MLL-AF9Uhrf1fl/fl mice (n ≥ 3). j Loss of Uhrf1 significantly prolongs the survival time of recipient mice transplanted with MLL-AF9Uhrf1Δ/Δ cells compared with MLL-AF9Uhrf1fl/fl group (n = 15). k Knockdown of Uhrf1 significantly prolongs the survival time of recipient mice transplanted with AE9a cells, compared with the control shRNA (n ≥ 11). l, m The in vivo bioluminescence imaging (l) and quantification analysis (m) shows that knocking down Uhrf1 impairs the leukemia progression in recipient mice transplanted with AE9a or MLL-AF9 leukemia cells that are luciferase-positive (n = 5). Data are all presented as means ± SD. Statistical significance was evaluated by log-rank test for b, j and k. Statistical analyses were performed using Student’s unpaired t-test for e, h, i, m. *P < 0.05, **P < 0.01, ***P < 0.001.
Fig. 3
Fig. 3. Loss of Uhrf1 impairs the self-renewal of LICs and decreases the frequency of LICs.
a The strategy of analysis of AE9a- and MLL-AF9-driven LICs. LSK cells represent LIC cells in AE9a-driven AML (Lin–Sca-1+c-Kit+), and L-GMP cells represent LICs in MLL-AF9-driven AML (LinSca-1c-Kit+CD34+CD16/32+ GMP-like leukemic cells). b, c The average number of colonies (b) generated from 3000 AE9a-expressing FL LSK cells or 800 MLL-AF9-expressing BM L-GMP cells with or without Uhrf1 deletion upon 4-OHT treatment in each replating (n = 3), and the morphology of the colonies (c). d Conditional deletion of Uhrf1 by 4-OHT treatment decreases the self-renewal capacity of AE9a- or MLL-AF9-driven LICs in Long-Term Culture-Initiating Cell (LTC-IC) assays. Shown is the CAFC numbers of colonies generated from 4000 AE9a-expressing FL LSK cells or 500 MLL-AF9-expressing BM L-GMP cells (n = 3). e The CAFC numbers of colonies generated from 3000 MLL-AF9Uhrf1fl/fl or MLL-AF9Uhrf1Δ/Δ leukemia blast cells from recipients in the primary transplantation (n = 3). f The morphology and numbers of colonies generated from 2000 MLL-AF9Uhrf1fl/fl or MLL-AF9Uhrf1Δ/Δ leukemia blast cells from recipients in the primary transplantation (n = 3). g, h Representative flow cytometry profiles (h) and quantification of the frequencies (g) of L-GMP cells in the BM from MLL-AF9Uhrf1fl/fl or MLL-AF9Uhrf1Δ/Δ recipients (n ≥ 5). i The average numbers of colonies generated from 10,000 primary AML CD34+ patient cells with UHRF1 knockdown by shRNA (n = 3). j The log-fraction plot shows the result of the limiting dilution assay by using different dilutions of leukemia cells from MLL-AF9Uhrf1fl/fl or MLL-AF9Uhrf1Δ/Δ mice. The “solid line” means confidence of intervals for 1/LICs of estimate, and “dotted line” means confidence of intervals for 1/LICs of lower and upper. k The MTT assays show that knocking down UHRF1 significantly inhibited the proliferation of AML cells (n = 3). Statistical analyses were performed using Student’s unpaired t-test for b, dg, i and k. ELDA software was used for analysis in j. Data are all presented as means ± SD; *P < 0.05, **P < 0.01, ***P < 0.001.
Fig. 4
Fig. 4. The genome-wide DNA binding patterns of UHRF1 and low expression of UHRF1 changes the transcriptome in Kasumi-1 and THP-1 cells.
a RNA-seq was performed on Kasumi-1 and THP-1 cells with UHRF1 knockdown, and the overlap of DEGs in RNA-seq was shown. b The GSEA curves for the pathways involving MYC and E2F targets selected from the top 10 affected pathways in AML cells with UHRF1 knockdown. c The heat map analysis of the enriched pathways in RNA-seq data of AML cells with UHRF1 knockdown. d, e The expression of genes in the enriched pathways was examined by q-PCR analysis in Kasumi-1 (d) and THP-1 (e) cells with UHRF1 knockdown (n = 3). f The CUT&Tag analysis was performed with the anti-UHRF1 antibody and control IgG in AML cells, and a profile of UHRF1 binding, centering on the TSS, was shown. g The heat-maps of CUT&Tag peak signals of UHRF1 target genes in AML cells. h The distribution of UHRF1 binding sites in AML cells by the CUT&Tag analysis. i The overlap of UHRF1 target genes from the CUT&Tag analysis and DEGs from RNA-seq analysis shows 383 common genes regulated by UHRF1 in both Kasumi-1 and THP-1 cells. j The binding peak of UHRF1 was identified on MXD4 promoter based upon the CUT&Tag analysis in AML cells. k The ChIP-qPCR analysis of UHRF1 binding to the MXD4 loci in AML cells. Data are all presented as means ± SD. Statistical analyses were performed using Student’s unpaired t-test for d, e, and k. *P < 0.05, **P < 0.01, ***P < 0.001.
Fig. 5
Fig. 5. Repression of MXD4 expression by UHRF1 is essential for leukemogenesis.
a, b ChIP-qPCR analysis of the TSS enrichment of UHRF1 on MXD4 gene in Kasumi-1 (a) and THP-1 (b) cells with DNMT1 knockdown by using the anti-UHRF1 antibody. c, d The DNA methylation analysis of MXD4 by the bisulfite sequencing in Kasumi-1 (c) and THP-1 (d) cells with UHRF1 knockdown (n = 3). e The protein levels of MXD4 and E2F1 were examined by Western blotting analysis in AML cells with UHRF1 knockdown. f The expression of Mxd4 was examined by q-PCR analysis in murine AML cells with Uhrf1 knockdown (n = 3). g Correlation analysis of UHRF1/MXD4 expression in LSCs from AML patients was performed using the GSE76009 dataset. h RNA-seq analysis shows that the expression of MXD4 is lower in the relapsed AML patients (n = 77) compared with the non-relapsed AML patients (n = 146). i The event free survival of AML patients was stratified by MXD4 expression into MXD4-high (679 days, n = 222) and MXD4-low (405 days, n = 66) groups. j, k The survival of recipient mice receiving AE9a (n = 7) (j) or MLL-AF9 (n = 6) (k) cells with the simultaneous knockdown of Uhrf1 and Mxd4. l, m The flow analysis of GFP, Mac-1 and Gr-1 in BM cells of the recipient mice in AE9a (l) or MLL-AF9 (m) mouse model (n ≥ 3). n, o The number of colonies generated from AE9a (n) or MLL-AF9 (o) driven LICs with Uhrf1 deletion/Mxd4 knockdown (n = 3). Data are all presented as means ± SD. Statistical analyses were performed using Student’s unpaired t-test for ad, f, h, lo, and log-rank test for ik. Pearson’s correlation analysis was used for g. *P < 0.05, **P < 0.01, ***P < 0.001.
Fig. 6
Fig. 6. The interaction of UHRF1 with SAP30 is critical for MXD4 repression and leukemogenesis.
a The event free survival of AML patients was stratified by SAP30 expression into SAP30 high (survival days: 503 days, n = 211) and low (survival days: 646 days, n = 77) groups. b Correlation analysis of UHRF1/SAP30 expression in LSCs from AML patients was performed using the GSE76009 dataset. c The immunoprecipitation was performed using the anti-UHRF1 or anti-SAP30 antibody, and the anti-SAP30 and anti-UHRF1 antibodies were used for the Western blotting analysis in AML cells (n ≥ 3). d The GST pull-down assay shows that UHRF1 interacts with SAP30 in vitro and the SRA domain of UHRF1 is required for the interaction with SAP30. e The schematic representation of the truncations of SRA domain. f The immunoprecipitation assay was performed to examine the interaction of HA-tagged mutant UHRF1 with Flag-SAP30 in 293T cells (n = 3). g The number of colonies generated from UHRF1-deficient AML cells transduced with WT or mutant UHRF1 (n = 3). h The survival of B-NDG recipient mice receiving Kasumi-1 (n = 6) or THP-1 (n = 5) cells with the restoration of UHRF1 and UHRF1-Mut2 after UHRF1 knockdown. i, j MXD4 expression was examined by q-PCR (i) and Western blotting (j) analysis in AML cells with SAP30 knockdown (n = 3). k The CUT&Tag analysis shows that SAP30 binds to the promoter of MXD4 in AML cells. l The ChIP-qPCR analysis of UHRF1 on the promoter of MXD4 in AML cells with the knockdown of SAP30 (n = 3). m MXD4 expression was examined by q-PCR analysis in UHRF1-deficient AML cells transduced with WT or mutant UHRF1 (n = 3). n, o The representative DNA methylation profiles (n) and quantification (o) analysis of MXD4 by the bisulfite sequencing in G572R and F573R mutant AML cells with UHRF1 knockdown. Data are all presented as means ± SD. Statistical analyses were performed using log-rank test for a, h, and Pearson’s correlation analysis for b. Student’s unpaired t-test was used for g, i, l, m, o. *P < 0.05, **P < 0.01, ***P < 0.001.
Fig. 7
Fig. 7. UHRF1 inhibitor UF146 suppresses AML cell survival by inhibiting proliferation and promoting apoptosis in vitro.
a The scheme of the screening protocol for UHRF1 inhibitor. b The structural formula of UHRF1 inhibitor UF146. c The binding mode of UF146 to the G465, A463, G448 and V446-created 5mC cavity in SRA domain. d, e The SPR (d) and FRET (e) analysis were performed to examine the direct binding affinities of UF146 to the SRA domain of UHRF1 (n = 3). f The cellular viability of human CD34+ HSPCs, Kasumi-1 and THP-1 cells treated with UF146 or the vehicle was examined by MTT assay (n = 3). g The cellular viability of AML cells (Kasumi-1, SKNO-1, HL60, NB4, OCI-AML3, THP-1, NOMO-1, MOLM-13, MV4-11 and SKM-1 cells) treated with UF146 or the vehicle control for 48 h. h, i The representative flow cytometry analysis profiles (h) and quantification (i) analysis of the early apoptosis and late apoptosis in the primary AML patient cells 24 h after the treatment of UF146 or the vehicle control (n = 3). j The Wright’s staining of the primary AML cells treated with the vehicle or UF146. k The number of colonies generated from AE9a- or MLL-AF9-driven LICs treated with UF146 or the vehicle (n = 3). l The number of colonies generated from the primary AML patient cells treated with UF146 or the vehicle (n = 3). m The cluster dendrogram analysis of AML cells treated with UF146 and AML cells with knockdown of UHRF1. n The RNA-seq and GSEA analysis of the AML cells treated with UF146 or the vehicle. o, p The DNA methylation levels of MXD4 in UF146- or the vehicle-treated Kasumi-1 (o) and THP-1 (p) cells were analyzed by the bisulfite sequencing (n = 3). q Western blotting analysis of UHRF1/MXD4/SAP30 in AML cells 24 h after UF146 treatment. Statistical analyses were performed using Student’s unpaired t-test for i, k, l, o and p. *P < 0.05, **P < 0.01, ***P < 0.001.
Fig. 8
Fig. 8. UF146 prolongs the survival of AML mice.
a The survival of AE9a- (n ≥ 15) or MLL-AF9-driven (n ≥ 14) AML mice treated with UF146 or the vehicle. b The Wright’s staining of PB isolated from the AE9a (at week 3)- or MLL-AF9 (at week 4)-driven AML mice treated with UF146 or the vehicle. c The WBC counts in the AE9a- or MLL-AF9-driven AML mice treated with UF146 or the vehicle (n ≥ 7). d, e The representative flow cytometry analysis profiles (d) and quantification analysis (e) of GFP+ Mac-1+ PB cells of UF146- or the vehicle-treated mice (n ≥ 8). f The strategy of the AML patient cell-derived xenograft transplantation model. g The survival curves of the UF146- or the vehicle-treated B-NDG mice (n ≥ 6) transplanted with the primary AML-M4 cells. h, i The Wright’s (h) and HE (i) staining analysis of BM and spleen cells isolated from UF146- or the vehicle-treated recipients that were transplanted with the primary AML-M4 cells were performed 2 weeks after transplantation. j, k The flow cytometry analysis of human CD45+ (hCD45+) (j), hCD45+human CD34+ (hCD34+) (k) BM cells isolated from UF146- or the vehicle-treated recipients transplanted with the primary AML-M4 cells (n = 3). l Flow cytometry analysis of hCD45+ PB cells from UF146- or vehicle-treated recipient mice transplanted with the primary AML-M2 cells (n = 4). Data are all presented as means ± SD; *P < 0.05, **P < 0.01, ***P < 0.001.

References

    1. Howlader, N. et al. SEER Cancer Statistics Review(CSR) 1975–2016, 92 (National Cancer Institute, 2019).
    1. Jan, P. B., Maximilian, S. & Amer, M. Z. Are we witnessing the start of a therapeutic revolution in acute myeloid leukemia. Leuk. Lymphoma60, 1354–1369 (2019). - PubMed
    1. Bennett JM, et al. Proposals for the classification of the acute leukaemias. French-American-British (FAB) co-operative group. Br. J. Haematol. 1976;33:451–458. doi: 10.1111/j.1365-2141.1976.tb03563.x. - DOI - PubMed
    1. Tenen DG. Disruption of differentiation in human cancer: AML shows the way. Nat. Rev. Cancer. 2003;3:89–101. doi: 10.1038/nrc989. - DOI - PubMed
    1. Rowley JD. Identificaton of a translocation with quinacrine fluorescence in a patient with acute leukemia. Ann. Genet. 1973;16:109–112. - PubMed

Publication types

MeSH terms