. 2022 Nov;28(11):2416-2423.
doi: 10.1038/s41591-022-02064-y. Epub 2022 Oct 27.

Retrospectively modeling the effects of increased global vaccine sharing on the COVID-19 pandemic

Affiliations

Retrospectively modeling the effects of increased global vaccine sharing on the COVID-19 pandemic

Sam Moore et al. Nat Med. 2022 Nov.

Erratum in

Abstract

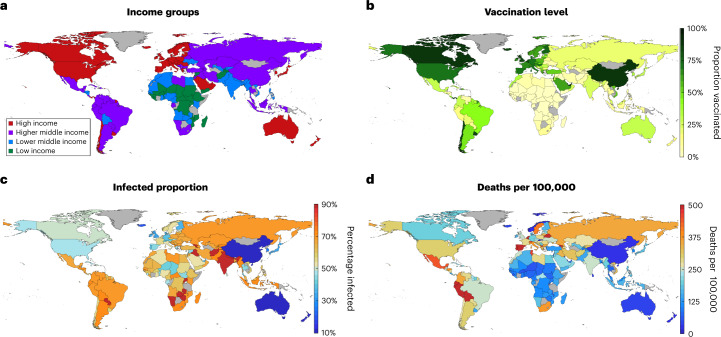
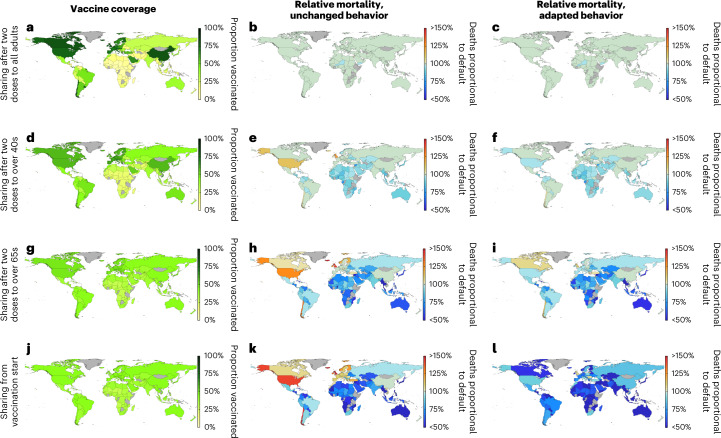
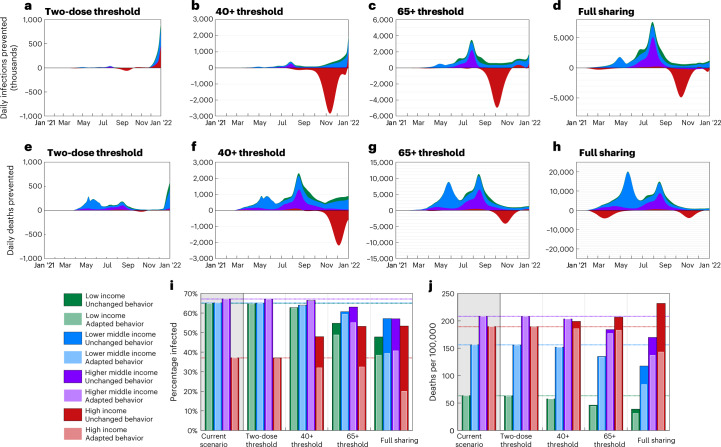
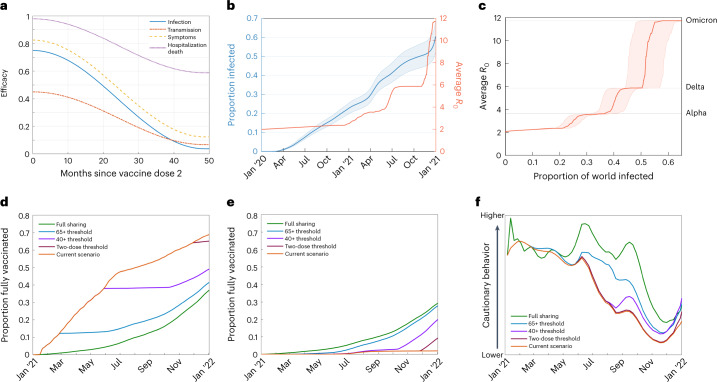
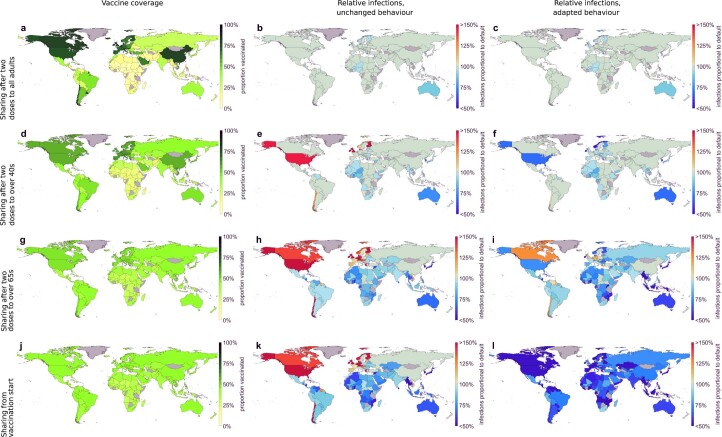
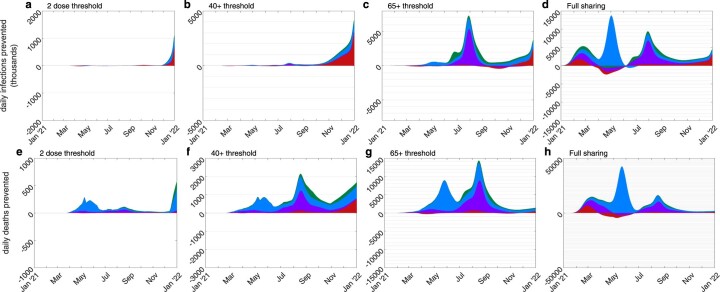
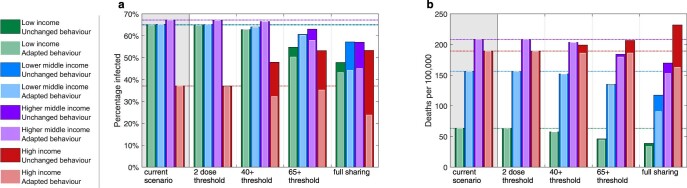
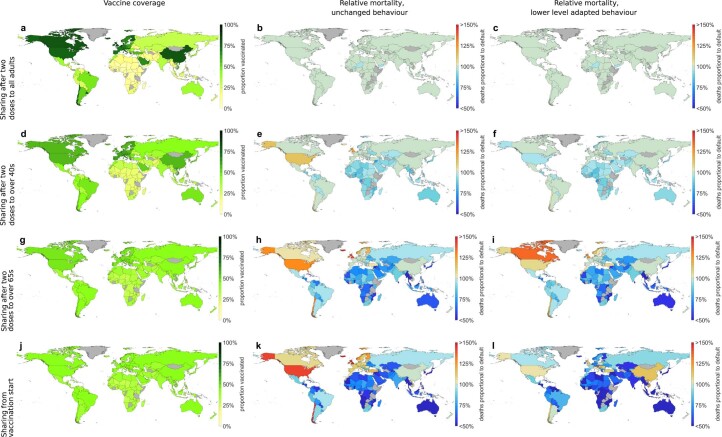
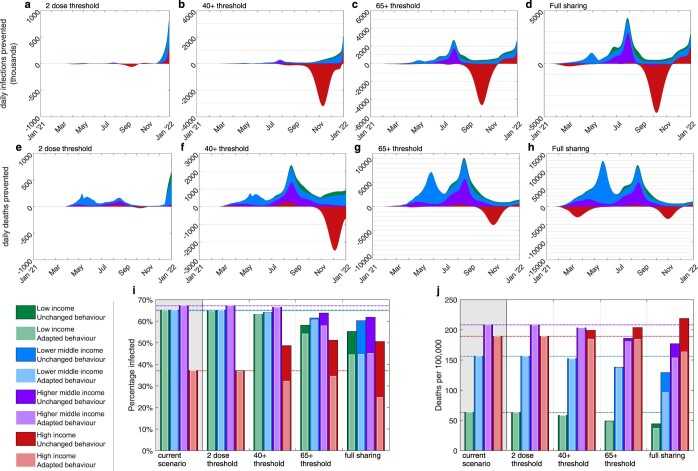
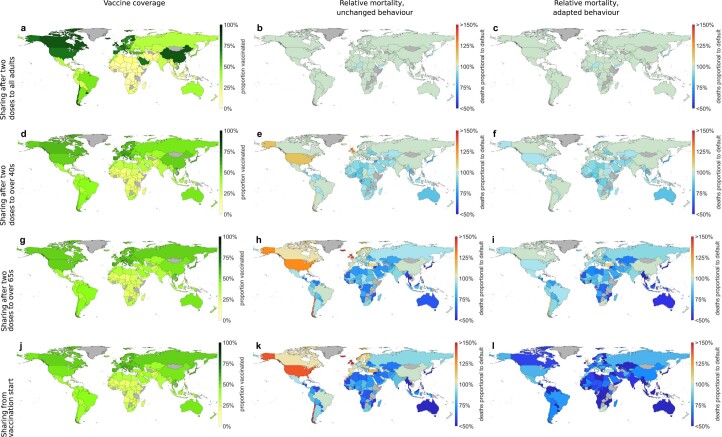
The severe acute respiratory syndrome coronavirus 2 (SARS-CoV-2) pandemic has caused considerable morbidity and mortality worldwide. The protection provided by vaccines and booster doses offered a method of mitigating severe clinical outcomes and mortality. However, by the end of 2021, the global distribution of vaccines was highly heterogeneous, with some countries gaining over 90% coverage in adults, whereas others reached less than 2%. In this study, we used an age-structured model of SARS-CoV-2 dynamics, matched to national data from 152 countries in 2021, to investigate the global impact of different potential vaccine sharing protocols that attempted to address this inequity. We quantified the effects of implemented vaccine rollout strategies on the spread of SARS-CoV-2, the subsequent global burden of disease and the emergence of novel variants. We found that greater vaccine sharing would have lowered the total global burden of disease, and any associated increases in infections in previously vaccine-rich countries could have been mitigated by reduced relaxation of non-pharmaceutical interventions. Our results reinforce the health message, pertinent to future pandemics, that vaccine distribution proportional to wealth, rather than to need, may be detrimental to all.


Conflict of interest statement

The authors declare no competing interests.

Figures

Fig. 1
Fig. 1. Reference maps for the current, low sharing scenario at the start of 2022.
a, Income group for each country simulated as defined by the World Bank. b, Proportion of each simulated country having received full vaccination (two doses). c, Estimated proportion of each simulated country to have been infected by SARS-COV-2. d, Estimated total number of deaths per 100,000 due to COVID-19 in each simulated country. In each, gray shading indicates a country that has not been simulated.
Fig. 2
Fig. 2. Relative changes in mortality per country under the central vaccine sharing scenarios.
Country-level estimates of vaccination coverage at the start of 2022 (a,d,g,j); total number of deaths over 2021 relative to the current scenario with unchanged behavior but increased vaccine sharing (b,e,h,k); and total number of deaths over 2021 relative to the current scenario with adaptive behavior and increased vaccine sharing (c,f,i,l). All results represent medians of 100 simulations, with model fitting spanning the range of uncertainty in infection and mortality estimates for each country. These are presented as caricatures to compare scenario impact with detailed data and associated prediction intervals provided in Supplementary Table 3. Analogous figures for infection estimates are provided in Extended Data Fig. 1.
Fig. 3
Fig. 3. Relative changes over time and total infections and mortality in each economic region under the central vaccine sharing scenarios.
a–h, Time series plots showing the reduction (positive values) or increase (negative values) in the global number of daily infections and daily deaths compared to the default scenario, each assuming unchanged behavior (equivalent figures for adapted behavior are provided in Extended Data Fig. 2). i,j, Estimated total proportion of infected and deaths from COVID-19 per 100,000, respectively, until the start of 2022 (so, over all of 2020 and 2021) in each of the economic regions. All results represent medians of 100 simulations, with model fitting spanning the range of uncertainty in infection and mortality estimates for each country. These are presented as caricatures to compare scenario impact with detailed data and associated prediction intervals provided in Supplementary Table 2.
Fig. 4
Fig. 4. Figures showing model parameters.
a, Efficacy profiles used for vaccination after the second dose of vaccination. b,c, Estimates for the infected proportion of the global population and average R0 of SARS-CoV-2 strains in circulation. Median infection estimates are indicated by the thicker central line, with a 95% confidence interval for infected proportions indicated by thinner outer lines. Panel b shows separately the correlation between infection numbers with time and R0 with time, and panel c shows the correlation between infected proportion and average R0. d,e, Example plots comparing levels of vaccination over time in each scenario considered for a highly vaccinated country (United Kingdom) and a country with limited vaccination (Kenya). f, Example plot for a highly vaccinated country (United Kingdom) of levels of cautionary behavior used for each level of vaccine sharing, for scenarios with adapted behavior.
Extended Data Fig. 1
Extended Data Fig. 1. Relative changes in infection per country under central sharing scenarios.
Country level estimates of vaccination coverage at the start of 2022 (a,d,g,j), total number of infections over 2021 relative to the current scenario with unchanged behaviour but increased vaccine sharing (b,e,h,k), and total number of infections over 2021 relative to the current scenario with adaptive behaviour and increased vaccine sharing (c,f,i,l). All results represent medians of 100 simulations with model fitting spanning the range of uncertainty in infection and mortality estimates for each country. These are presented as caricatures to compare scenario impact with detailed data and associated prediction intervals provided in Supplementary Table 3. Analogous figures for mortality estimates are given in Fig. 2.
Extended Data Fig. 2
Extended Data Fig. 2. Relative changes in infection and mortality over time in each economic region for scenarios with adapted behaviour.
Time series plots showing the reduction (positive values) or increase (negative values) in the global number of daily infections (ad) and daily deaths (eh) compared to the default scenario, each with adapted behaviour (equivalent figures for unchanged behaviour are given in Fig. 3). All results represent medians of 100 simulations with model fitting spanning the range of uncertainty in infection and mortality estimates for each country. These are presented as caricatures to compare scenario impact with detailed data and associated prediction intervals provided in Supplementary Table 2.
Extended Data Fig. 3
Extended Data Fig. 3. Total infections and mortality per economic region under scenarios with lower level behaviour adaptation.
Plots comparing estimates based on unchanged behaviour and lower level adapted behaviour. Estimated total proportion infected (a) and deaths from COVID-19 per 100,000 (b) until the start of 2022 (so over all of 2020 and 2021) in each of the economic regions. All results represent medians of 100 simulations with model fitting spanning the range of uncertainty in infection and mortality estimates for each country. These are presented as caricatures to compare scenario impact with detailed data and associated prediction intervals provided in Supplementary Tables 5 and 6.
Extended Data Fig. 4
Extended Data Fig. 4. Relative changes in mortality per country under scenarios with lower level behaviour adaptation.
Plots comparing estimates based on unchanged behaviour and lower level adapted behaviour. Country level estimates of vaccination coverage at the start of 2022 (a,d,g,j), total number of deaths over 2021 relative to the current scenario with unchanged behaviour but increased vaccine sharing (b,e,h,k), and total number of deaths over 2021 relative to the current scenario with lower level adaptive behaviour and increased vaccine sharing (c,f,i,l). All results represent medians of 100 simulations with model fitting spanning the range of uncertainty in infection and mortality estimates for each country. These are presented as caricatures to compare scenario impact with detailed data and associated prediction intervals provided at an income group level in Tables S5 and S6.
Extended Data Fig. 5
Extended Data Fig. 5. Relative changes over time and total infections and mortality in each economic region for scenarios with age biased vaccine distribution.
Plots presenting estimates based on scenarios with age biased vaccine redistribution. Panels a-h show time series plots showing the reduction (positive values) or increase (negative values) in the global number of daily infections and daily deaths compared to the default scenario, each assuming un-adapted behaviour. Panels i and j show estimated total proportion infected and deaths from COVID-19 per 100,000 respectively until the start of 2022 (so over all of 2020 and 2021) in each of the economic regions. All results represent medians of 100 simulations with model fitting spanning the range of uncertainty in infection and mortality estimates for each country. These are presented as caricatures to compare scenario impact with detailed data and associated prediction intervals provided in Supplementary Tables 7 and 8.
Extended Data Fig. 6
Extended Data Fig. 6. Relative changes in mortality per country under scenarios with age biased vaccine distribution.
Plots presenting estimates based on scenarios with age biased vaccine redistribution. Country level estimates of vaccination coverage at the start of 2022 (a,d,g,j), total number of deaths over 2021 relative to the current scenario with unchanged behaviour but increased vaccine sharing (b,e,h,k), and total number of deaths over 2021 relative to the current scenario with adaptive behaviour and increased vaccine sharing (c,f,i,l). All results represent medians of 100 simulations with model fitting spanning the range of uncertainty in infection and mortality estimates for each country. These are presented as caricatures to compare scenario impact with detailed data and associated prediction intervals provided at an income group level in Supplementary Table 7.

References

    1. World Health Organization. Weekly epidemiological update on COVID-19—14 September 2021. https://www.who.int/publications/m/item/weekly-epidemiological-update-on... (2021).
    1. Vardavas, C. I. et al. Effectiveness of non-pharmaceutical measures (NPIs) on COVID-19 in Europe: a systematic literature review. Preprint at https://www.medrxiv.org/content/10.1101/2021.11.11.21266216v1 (2021). - DOI
    1. Cowling BJ, et al. Impact assessment of non-pharmaceutical interventions against coronavirus disease 2019 and influenza in Hong Kong: an observational study. Lancet Public Health. 2020;5:e279–e288. doi: 10.1016/S2468-2667(20)30090-6. - DOI - PMC - PubMed
    1. Demirgüç-Kunt, A., Lokshin, M. & Torre, I. The sooner, the better: the early economic impact of non-pharmaceutical interventions during the COVID-19 pandemic. World Bank Policy Research Working Paper (9257). https://openknowledge.worldbank.org/handle/10986/33820 (2020).
    1. Ritchie, H. et al. Coronavirus Pandemic (COVID-19). Our World in Data.https://ourworldindata.org/coronavirus

Publication types