. 2022 Oct 27;13(1):6389.
doi: 10.1038/s41467-022-33883-9.

Distinct organization of two cortico-cortical feedback pathways

Affiliations

Distinct organization of two cortico-cortical feedback pathways

Shan Shen et al. Nat Commun. .

Abstract

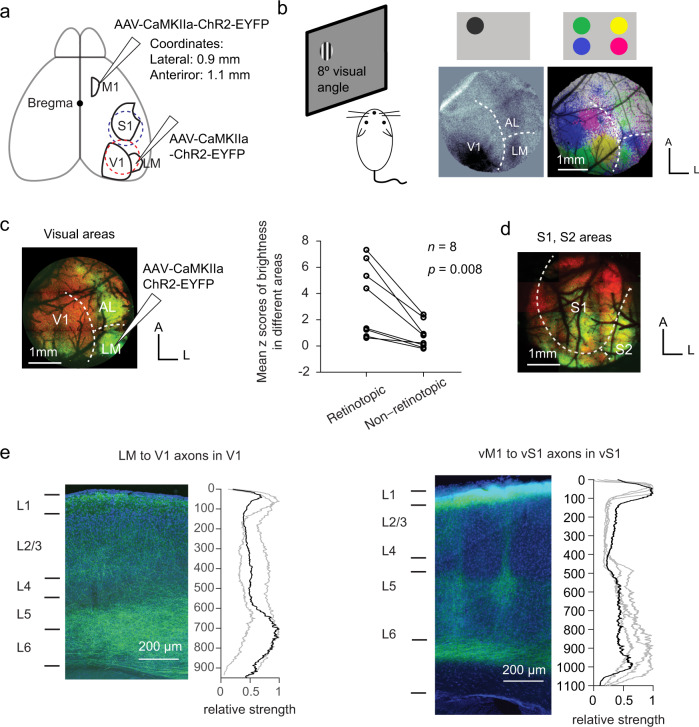
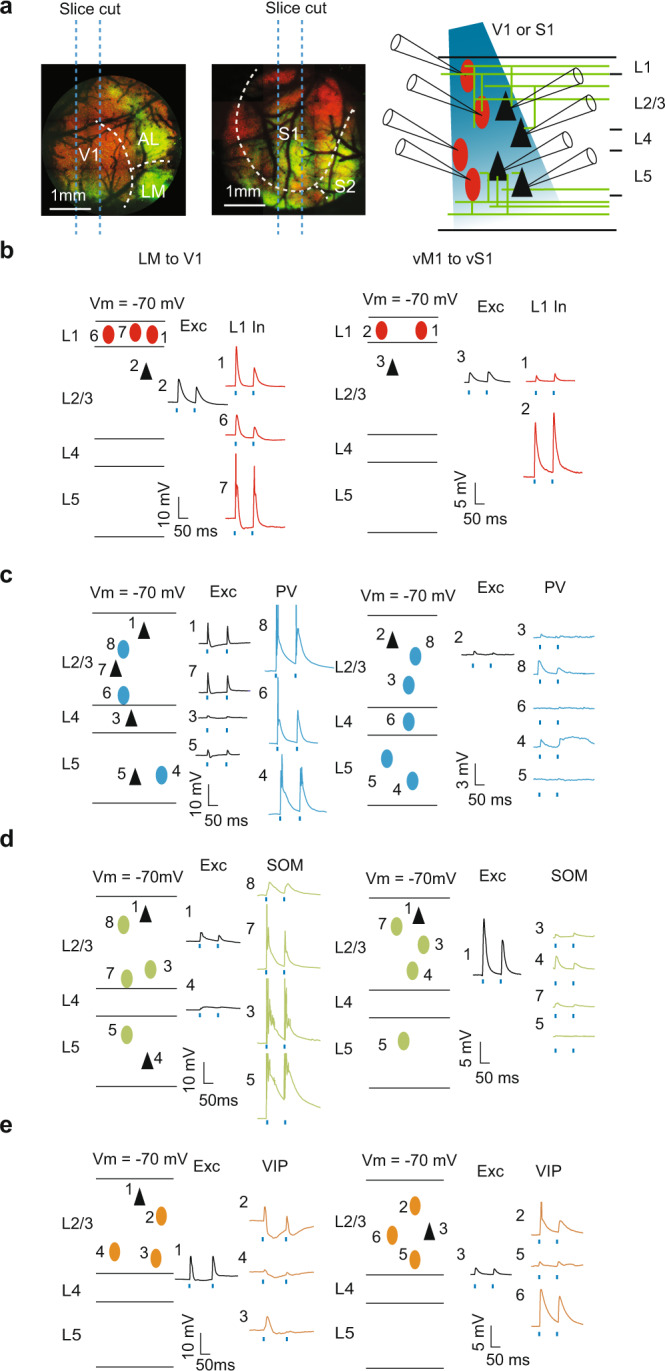
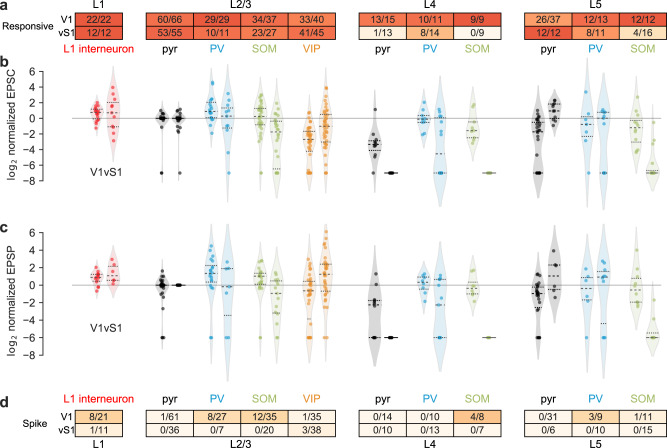
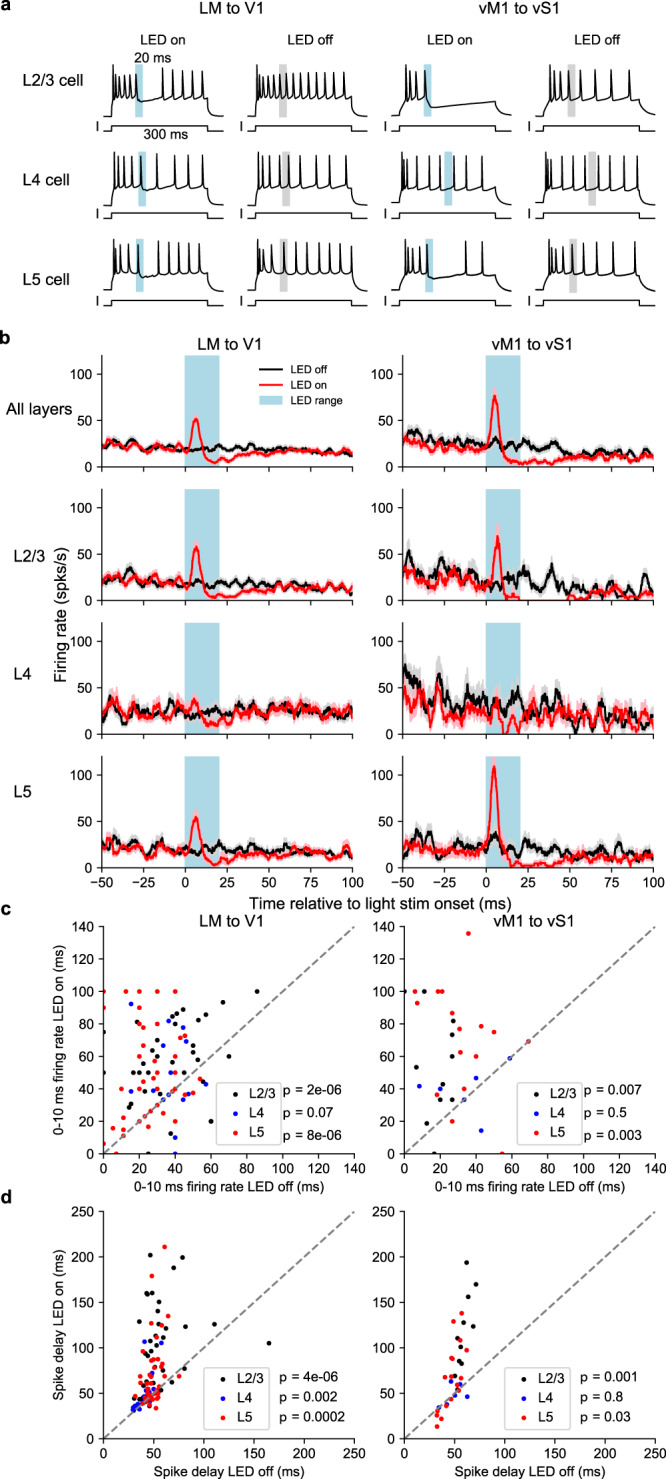
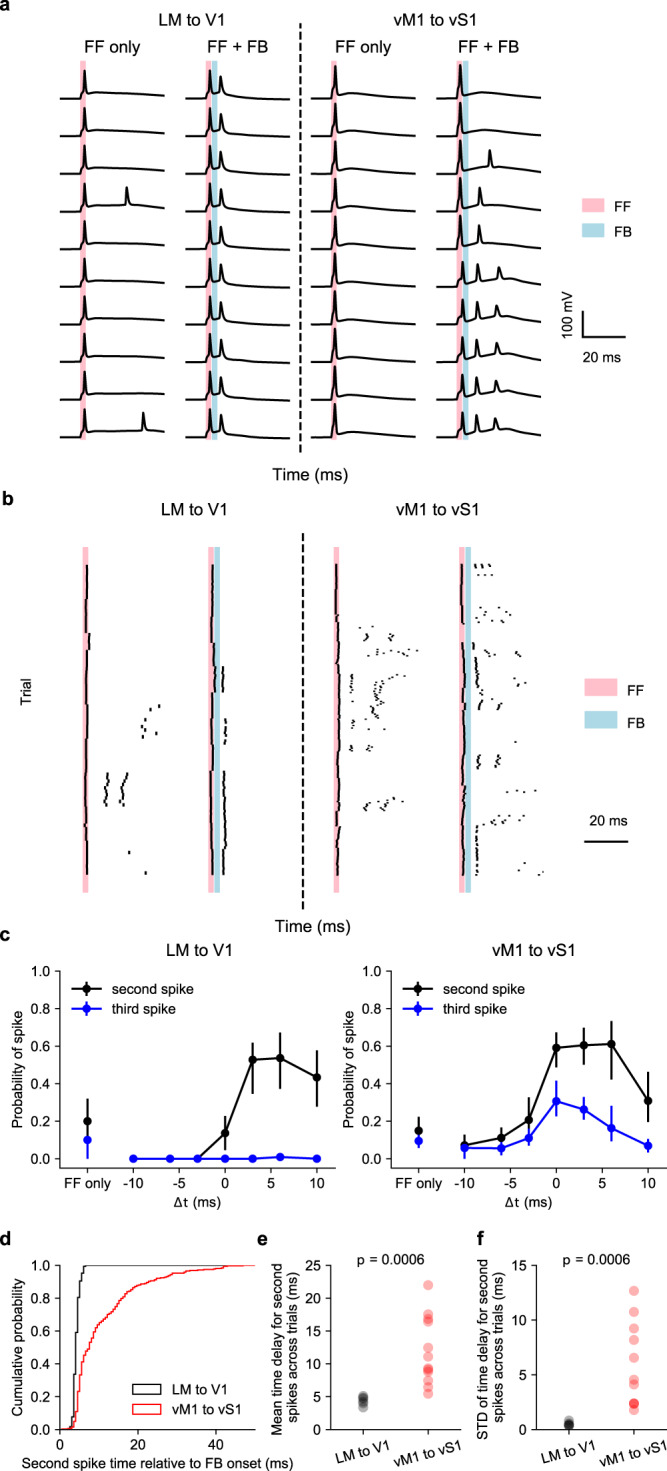
Neocortical feedback is critical for attention, prediction, and learning. To mechanically understand its function requires deciphering its cell-type wiring. Recent studies revealed that feedback between primary motor to primary somatosensory areas in mice is disinhibitory, targeting vasoactive intestinal peptide-expressing interneurons, in addition to pyramidal cells. It is unknown whether this circuit motif represents a general cortico-cortical feedback organizing principle. Here we show that in contrast to this wiring rule, feedback between higher-order lateromedial visual area to primary visual cortex preferentially activates somatostatin-expressing interneurons. Functionally, both feedback circuits temporally sharpen feed-forward excitation eliciting a transient increase-followed by a prolonged decrease-in pyramidal cell activity under sustained feed-forward input. However, under feed-forward transient input, the primary motor to primary somatosensory cortex feedback facilitates bursting while lateromedial area to primary visual cortex feedback increases time precision. Our findings argue for multiple cortico-cortical feedback motifs implementing different dynamic non-linear operations.


Conflict of interest statement

The authors declare no competing interests.

Figures

Fig. 1
Fig. 1. Feedback axon terminal distribution of the two feedback pathways.
a Anatomy of the areas V1, LM, vS1, and vM1. The virus was injected in either vM1 or LM in different animals. Feedback axon terminals were labeled with ChR2-YFP in either V1 (red dashed circle) or S1 (blue dashed circle). b Intrinsic imaging to identify V1 and LM. Left: experimental paradigm. Grating stimuli drifting horizontally or vertically were shown to the left eye, on one of the four locations on the monitor. A CCD camera was used to record brain intrinsic activity from a craniotomy exposing visual areas of the right hemisphere. Middle: intrinsic imaging map of the stimulus in the top lateral corner. The white dashed lines mark the borders among V1, LM, and AL. Right: intrinsic imaging map of stimuli in all four locations. Different colors represent brain areas responsive to stimuli in different locations (green: top-lateral; yellow: top-medial; blue: bottom-lateral; magenta: bottom-medial). Scale bar: 1 mm. c LM to V1 feedback projections target the retinotopic corresponding area in V1. Left: EYFP expression of the animal in (b), with virus injected in the LM area responsive to top lateral stimulus (green) and the axon terminals mainly targeted the “green location” in V1. Right: mean z scores of the fluorescence for both retinotopically corresponding areas and non-corresponding areas in V1, for 8 animals. Fluorescence strength of the retinotopic area was significantly higher (p = 0.008, n = 8 animals, two-sided Wilcoxon signed-rank test). d Dorsal view of vM1 to vS1 feedback. Axon terminals were widely distributed in the somatosensory areas. e Laminar distribution of LM to V1 (left) or vM1 to vS1 (right) axon terminals. Left: the fluorescent image of a coronal slice in V1 or vS1, with DAPI signal in blue and EYFP signal in green. Right: Relative strength of fluorescence (averaged over 100μm horizontally) as a function of depth, normalized to the maximum (3 animals for LM to V1, and 4 animals for vM1 to vS1). The black line indicates the axon distribution corresponding to the image on the left, and the gray lines indicate other slices. Source data are provided as a Source Data file.
Fig. 2
Fig. 2. Example slices for connectivity.
a Experimental paradigm. Left: Parasagittal slices containing V1 or vS1 Right: LM or vM1 were excluded from the slices, while the axon terminals from LM or vM1 were included in the slices. b Example slice recording of L1 interneurons (red ovals) and pyramidal cells (black triangles) in either V1 (left) or vS1 (right). Numbers refer to the channel number of the recording system. The blue dots mark the 2 ms blue LED pulses. c Example slice recording of PV+ interneurons (blue ovals) and pyramidal cells (black triangles) in either V1 (left) or vS1 (right). d Example slice recording of SOM+ interneurons (green ovals) and pyramidal cells (black triangles) in either V1 (left) or vS1 (right). e Example slice recording of L2/3 VIP+ interneurons (orange ovals) and pyramidal cells (black triangles) in either V1 (left) or vS1 (right). Source data are provided as a Source Data file.
Fig. 3
Fig. 3. Summary of activities in V1 and vS1 in response to feedback excitation.
a The proportion of responsive cells in V1 or vS1 in different layers (number of responsive cells/total number of recorded cells). The color in the table indicates the probability level, same for panel (d). b The log2 normalized EPSC of cells in either V1 (left) or vS1 (right) normalized to the average EPSC of L2/3 pyramidal cells. Colors and positions of the violin plot indicate the cell type corresponding to the charts in panels (a) and (d). Each dot indicates one recorded cell and the color indicates the cell type. The black dashed lines indicate the quartiles (top and bottom) and the median (middle). The outlines indicate the distributions of the log2 normalized EPSCs. c Same as (b), for log2 normalized EPSP. d The proportion of spiking cells in V1 or vS1 in different layers (number of spiking cells/total cells recorded in the current-clamp mode). Source data are provided as a Source Data file.
Fig. 4
Fig. 4. Feedback activity temporally sharpened the firing patterns of pyramidal cells in V1 or vS1 in both feedback pathways.
a Examples of feedback modulation on the firing patterns of pyramidal cells in L2/3 (top), L4 (middle), and L5 (bottom) of V1 (left) or vS1 (right). Cells were driven to fire with sustained positive current injection. In LED-on trials (left plots), 20 ms LED stimulus (blue bar) was delivered. LED-off trials (right plots) were paired with the LED-on trials. Gray bars mark the LED stimulus range of the corresponding LED-on trials. b Peristimulus time histogram of pyramidal cells for feedback on trials (red, solid line: mean, shade: s.e.m across cells, same for later) and feedback off trials (black). c Firing rate in feedback off trials vs feedback on trials within the time range of 0 to 10 ms after the LED onset for pyramidal cells in L2/3 (black dots, 44 cells over 15 animals for V1 and 11 cells over 2 animals for vS1), L4 (blue dots, 20 cells over 7 animals for V1 and 6 cells over 2 animals for vS1) and L5 (red dots, 45 cells over 15 animals for V1 and 17 cells over 6 animals for vS1). p values are from the two-sided Wilcoxon sign-rank tests. d Time delay relative to the LED onset of the first spike after LED offset (i.e. after 20 ms) in feedback-on trials vs feedback-off trials for pyramidal cells in L2/3 (black dots, 44 cells over 15 animals for V1 and 11 cells over 2 animals for vS1), L4 (blue dots, 20 cells over 7 animals for V1 and 6 cells over 2 animals for vS1) and L5 (red dots, 45 cells over 15 animals for V1 and 17 cells over 6 animals for vS1). p values are from the two-sided Wilcoxon sign-rank tests. Source data are provided as a Source Data file.
Fig. 5
Fig. 5. Feedback regulation on bursting behavior of L5 intrinsically bursty (IB) neurons.
a Firing of example L5 IB neurons in response to feed-forward stimulus only (FF, 2 ms) and the combination of feed-forward and feedback stimulus (FF + FB, FB 2 ms) in V1 (left) or vS1 (right). In these examples, the FB stimulus was delivered 3 ms after the FF stimulus. b Raster plots of all cells in V1 (left) or vS1 (right). Each row refers to a trial and each tick indicates a spike. c Probability of occurrence of the second spike (black) and third spike (blue) of L5 IB neurons responsive to FF + FB stimulus, as a function of the time of FB onset relative to the FF onset (Δt). Dots and error bars are mean and bootstrapped 68% confidence intervals of the mean. n = 11 cells over 2 independent experiments for LM to V1 feedback; n = 15 cells over 5 independent experiments for vM1 to vS1 feedback. d Cumulative probability of second spike occurrence time relative to the FB onset. Black: LM to V1. Red: vM1 to vS1. e, f Mean (e) and standard deviation (STD, f) of the time delay across trials for the second spikes were both significantly higher in the vM1 to vS1 pathway (n = 6 cells over 2 independent experiments for LM to V1 feedback; n = 11 cells over 5 independent experiments for vM1 to vS1 feedback; p = 0.0006, two-sided Wilcoxon rank-sum test). Each dot represents a cell. Source data are provided as a Source Data file.

References

    1. Luck SJ, Chelazzi L, Hillyard SA, Desimone R. Neural mechanisms of spatial selective attention in areas V1, V2, and V4 of Macaque visual cortex. J. Neurophysiol. 1997;77:24. - PubMed
    1. Lamme VA, Supèr H, Spekreijse H. Feedforward, horizontal, and feedback processing in the visual cortex. Curr. Opin. Neurobiol. 1998;8:529–535. - PubMed
    1. Ito M, Gilbert CD. Attention modulates contextual influences in the primary visual cortex of alert monkeys. Neuron. 1999;22:593–604. - PubMed
    1. Rao RP, Ballard DH. Predictive coding in the visual cortex: a functional interpretation of some extra-classical receptive-field effects. Nat. Neurosci. 1999;2:79–87. - PubMed
    1. Bastos AM, et al. Canonical microcircuits for predictive coding. Neuron. 2012;76:695–711. - PMC - PubMed

Publication types

Substances

LinkOut - more resources