. 2022 Oct 27;13(1):6409.
doi: 10.1038/s41467-022-34087-x.

Divergent regulation of basement membrane trafficking by human macrophages and cancer cells

Affiliations

Divergent regulation of basement membrane trafficking by human macrophages and cancer cells

Julian C Bahr et al. Nat Commun. .

Abstract

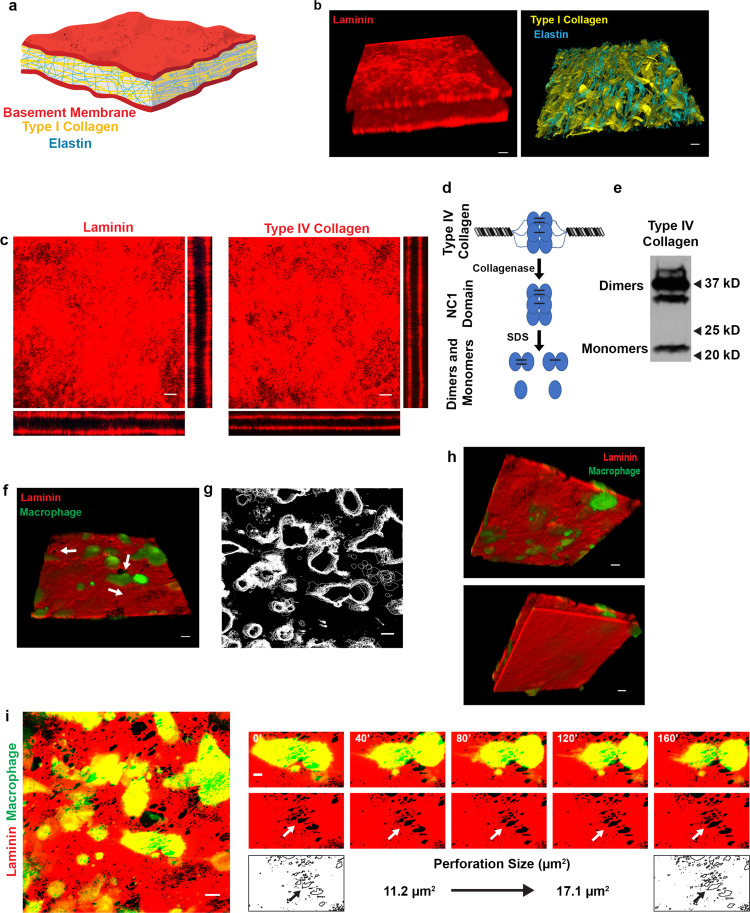
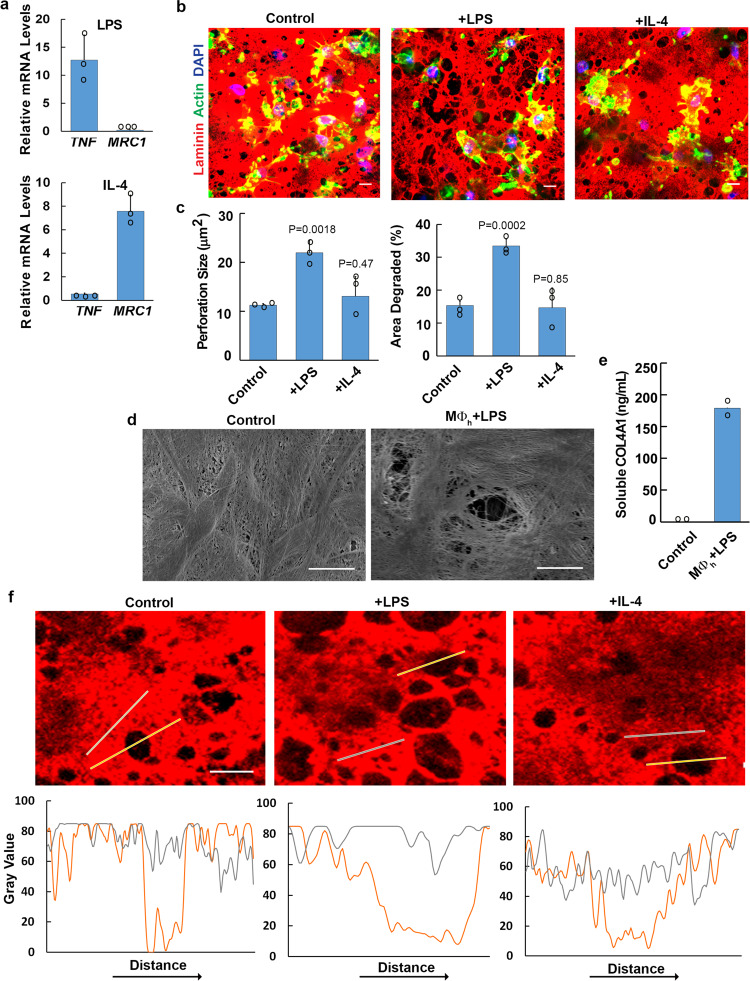
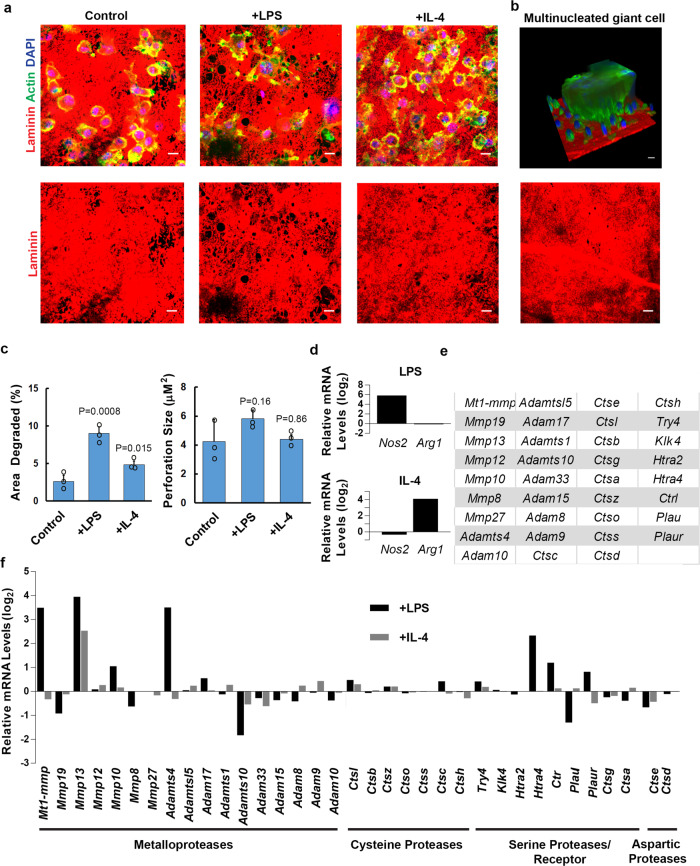
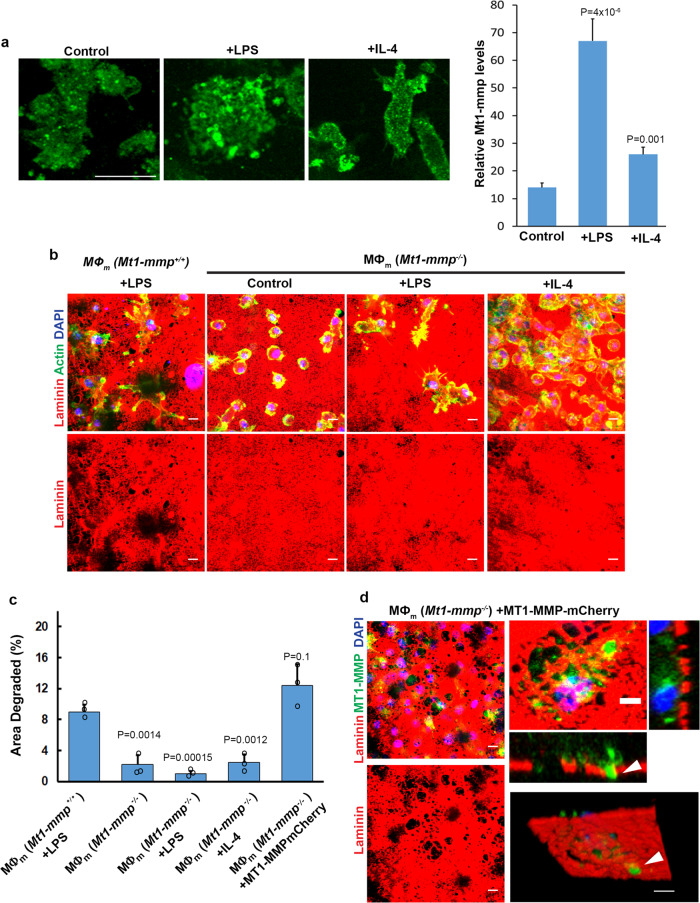
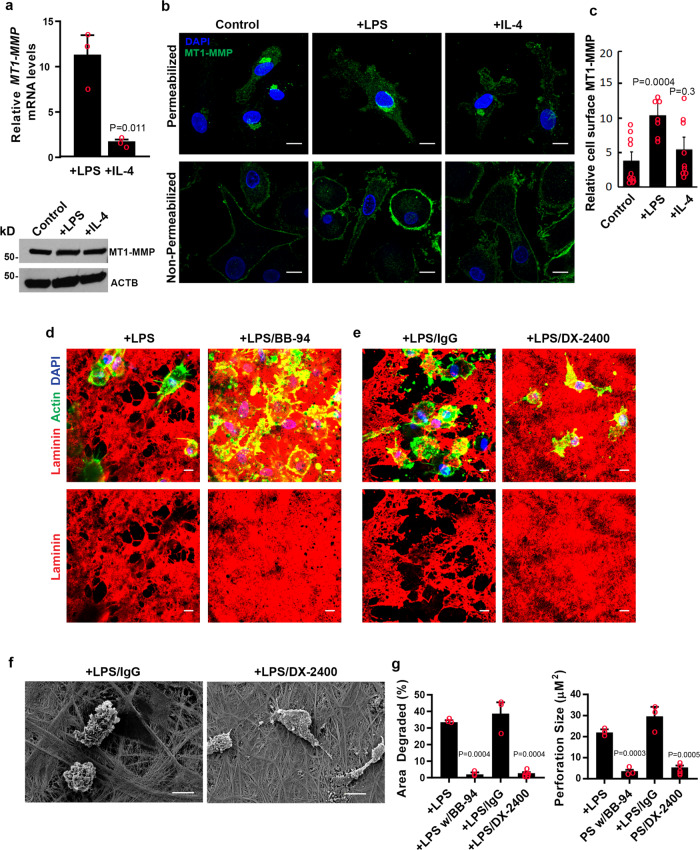
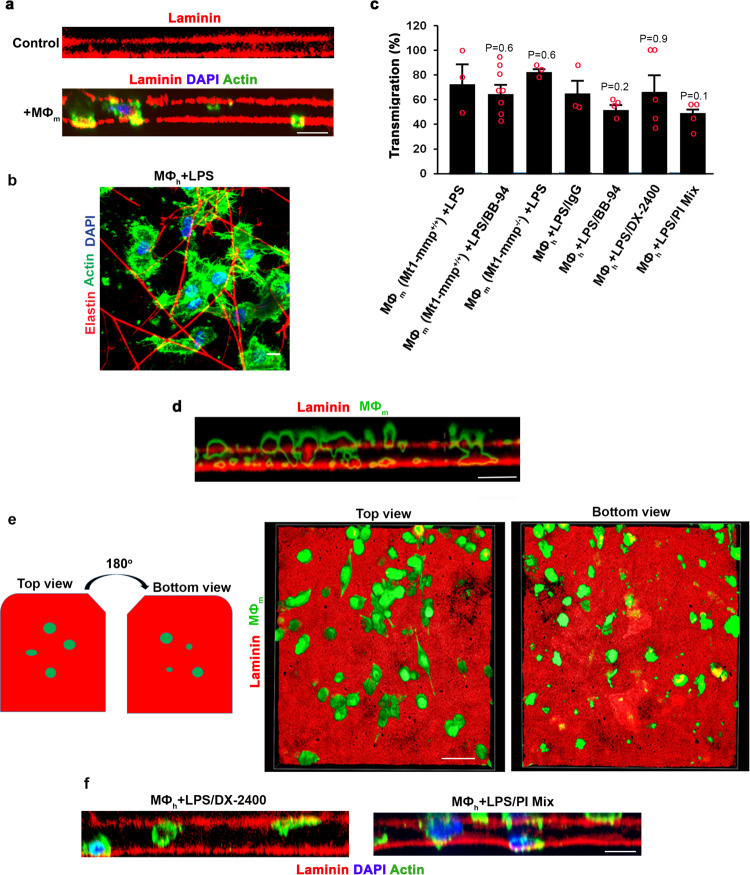
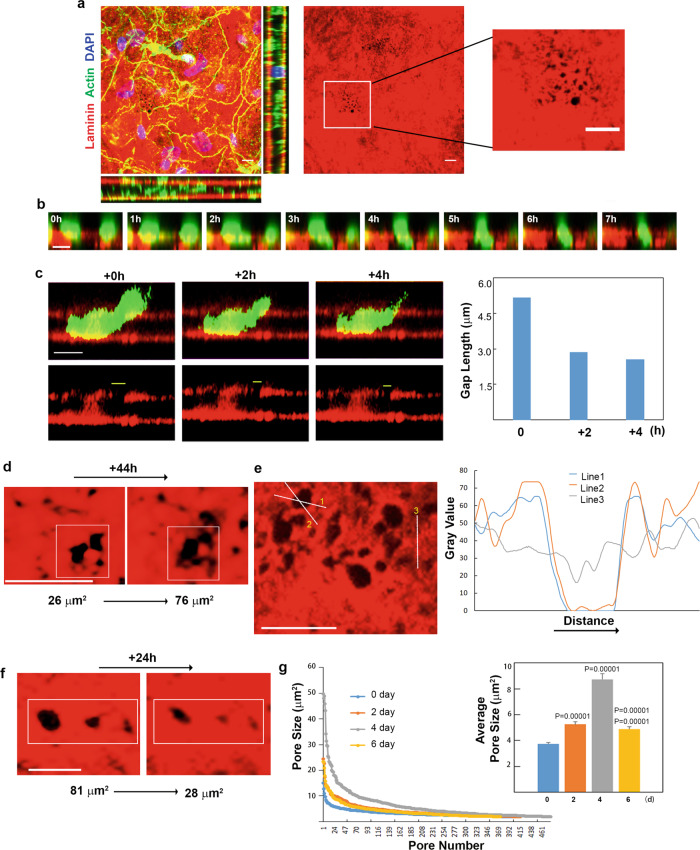
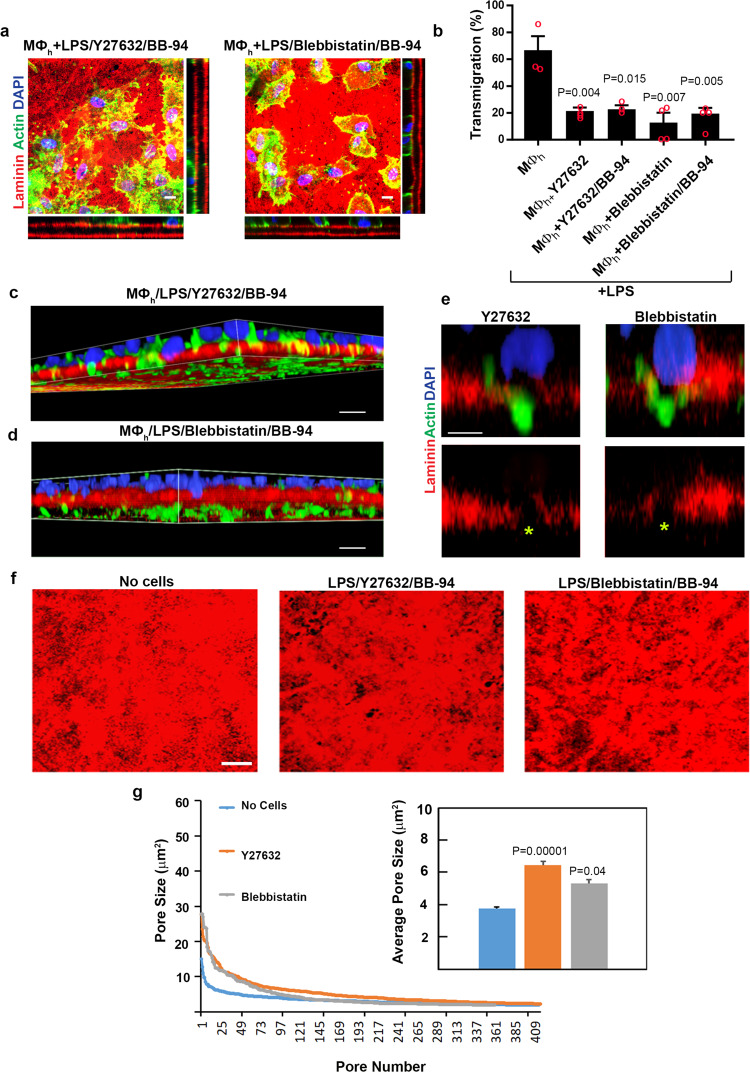
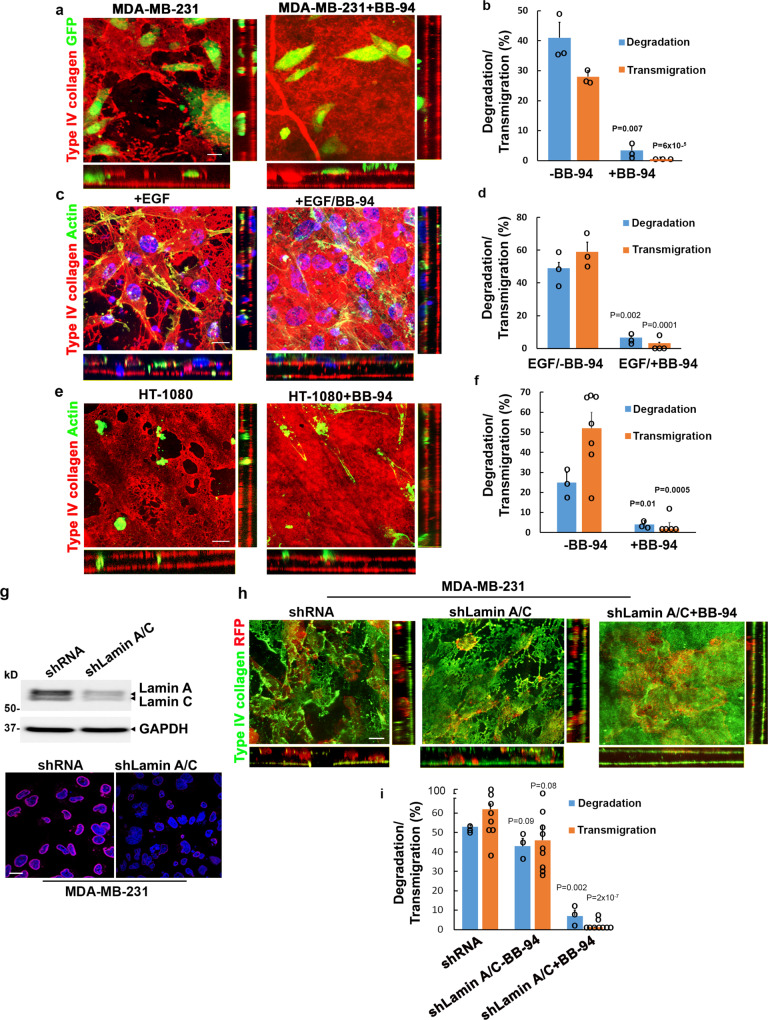
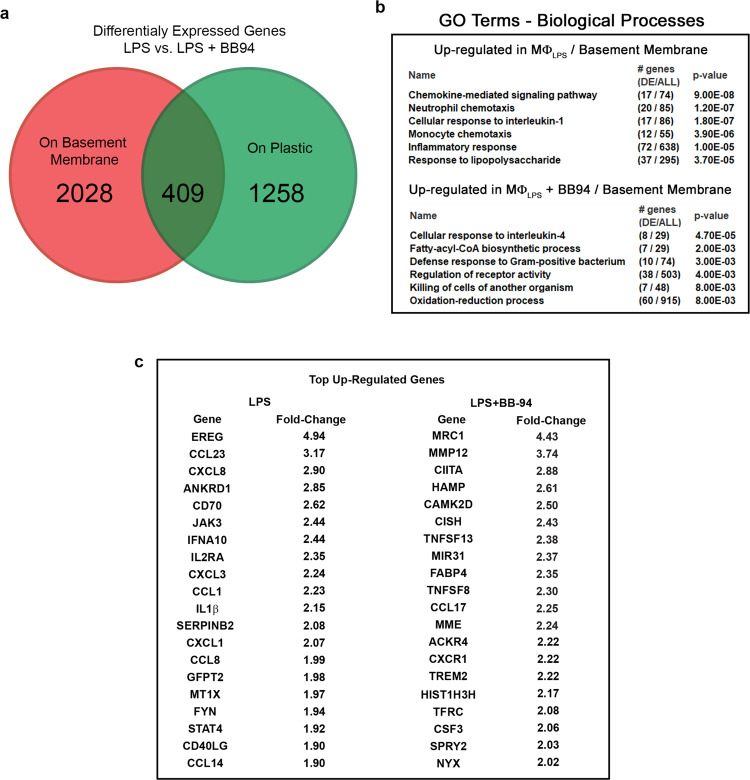
Macrophages and cancer cells populations are posited to navigate basement membrane barriers by either mobilizing proteolytic enzymes or deploying mechanical forces. Nevertheless, the relative roles, or identity, of the proteinase -dependent or -independent mechanisms used by macrophages versus cancer cells to transmigrate basement membrane barriers harboring physiologically-relevant covalent crosslinks remains ill-defined. Herein, both macrophages and cancer cells are shown to mobilize membrane-anchored matrix metalloproteinases to proteolytically remodel native basement membranes isolated from murine tissues while infiltrating the underlying interstitial matrix ex vivo. In the absence of proteolytic activity, however, only macrophages deploy actomyosin-generated forces to transmigrate basement membrane pores, thereby providing the cells with proteinase-independent access to the interstitial matrix while simultaneously exerting global effects on the macrophage transcriptome. By contrast, cancer cell invasive activity is reliant on metalloproteinase activity and neither mechanical force nor changes in nuclear rigidity rescue basement membrane transmigration. These studies identify membrane-anchored matrix metalloproteinases as key proteolytic effectors of basement membrane remodeling by macrophages and cancer cells while also defining the divergent invasive strategies used by normal and neoplastic cells to traverse native tissue barriers.


Conflict of interest statement

The authors declare no competing interests.

Figures

Fig. 1
Fig. 1. Human macrophage interactions with native basement membrane explants.
a Schematic illustration of the mesentery extracellular matrix. b 3D confocal reconstructions of laminin (red; left panel) and elastin (blue; right panel), with second harmonic generation of type I collagen (yellow; right panel) in mesentery explants. c En face and orthogonal immunofluorescence of laminin (red) and type IV collagen (red). Results representative of 5 independent experiments. d Schematic of type IV collagen dimer–monomer content analysis. After collagenase digestion of type IV collagen, the hexameric NC1 domain remains intact. The hexamer can be dissociated via non-reducing SDS-PAGE into sulfilimine-cross-linked dimers and non-cross-linked monomers. e Type IV collagen dimer–monomer content analysis as determined by western blotting. Image is representative of two experiments performed. f 3D confocal reconstruction of human macrophages (green) atop the apical face of a basement membrane (red) with adjacent perforations (arrow) after 48 h. Results representative of five independent experiments performed. g Overlay of macrophage outlines captured every 10 min for 160 min. Results representative of 3 independent experiments performed. h 3D reconstruction from f rotated 180° showing the bottom face of the apical basement membrane (top panel with laminin colored red) with penetrating macrophage protrusions (green) highlighted as well as the bottom face of the basal basement membrane (bottom panel). Results representative of two independent experiments performed. i Immunofluorescence of the apical basement membrane layer (red) and macrophages (green; left panel) with a macrophage actively expanding a perforation in the basement membrane (small panels, arrows) over a 160 min time period. Bars: 20 µm (b, f, h); 10 µm (c, g, i left panel); 5 µm (i right panel). Results representative of seven experiments performed for i. Source data are provided as a Source data file. All figure panels containing red/green combined images have been separated and can be found in Supplementary Data 2.
Fig. 2
Fig. 2. Polarized human macrophage-dependent remodeling of basement membrane explants.
a Transcript expression of immune response genes as analyzed by qPCR in human macrophages polarized with LPS (1 µg/mL) or recombinant human IL-4 (20 ng/mL). Results are expressed as mean fold-change relative to control ± SEM (n = 3 independent exps). b Basement membrane laminin immunofluorescence following a 6 d culture with control, LPS- (1 µg/mL) or recombinant IL-4- (20 ng/mL) treated macrophages. Images shown are representative of three independent experiments. c Quantification of basement membrane perforation size or area degraded as analyzed by ImageJ pixel analysis of each condition in b. Results are expressed as mean ± SEM (n = 3 independent exps) with significance determined by two-tailed t test. d Scanning electron micrograph of basement membrane stripped of cells either after culture with medium alone or with LPS-polarized human macrophages (MØh) for 6 days. Results representative of two independent experiments performed. e Quantification of soluble type IV collagen detected in cell-free media on day 3. Results are expressed as mean of two independent experiments performed. f Normalized fluorescence intensity profiles of laminin (red) across non-degraded (gray lines) versus degraded basement membrane perforations (orange lines) in explants cultured with control, LPS-, or IL-4-treated macrophages for 6 days. Results representative of four independent experiments. Bars: (bd, f) 10 µm. Source data are provided as a Source data file.
Fig. 3
Fig. 3. Polarized mouse macrophages express a suite of proteases.
a Basement membrane laminin immunofluorescence following culture with mouse macrophages for 6 days in the presence of media alone, LPS (1 µg/mL), or recombinant mouse IL-4 (20 ng/mL). Images shown are representative of three independent experiments. b 3D, en face and orthogonal images of a multinucleated giant cell formed atop basement membrane explants in response to IL-4. Results representative of two independent experiments performed. c Quantification of basement membrane area degraded and basement membrane perforation size as analyzed by ImageJ pixel analysis of each condition from a. Results are expressed as mean ± SEM (n = 3 independent experiments) with significance determined by two-tailed t test. d Transcript expression for two biological replicates of mouse macrophages left unstimulated, polarized with LPS (1 µg/mL), or polarized with recombinant mouse IL-4 (20 ng/mL) for 24 h. Relative mRNA expression levels of mouse-specific immune response genes (d), proteases or protease receptor with an absolute gene expression value of at least 24 (e), and the relative expression of those proteases/receptor in response to LPS or IL-4 (f) are presented. d, f are on a log2 scale. Results are presented as the mean of two independent experiments. Source data are provided as a Source data file.
Fig. 4
Fig. 4. Mt1-mmp-dependent mouse macrophage-mediated basement membrane remodeling.
a Mt1-mmp immunostaining (green) of mouse macrophages cultured on basement membrane explants (unstained) in control media, polarized with LPS (1 µg/mL) or recombinant mouse IL-4 (20 ng/mL) with relative immunofluorescence quantified. Results are representative of 3 experiments performed with results from a single experiment with Mt1-mmp quantified in 10 randomly selected cells as mean ± SEM with significance determined by two-tailed t test. b Laminin immunofluorescence of basement membranes cultured with LPS-polarized Mt1-mmp+/+ mouse macrophages (MØm) or unstimulated, LPS-, and IL-4-polarized Mt1-mmp−/− mouse cells for 6 days. Results representative of three independent experiments performed. c Quantification of the area of basement membrane degraded as analyzed by ImageJ pixel analysis under each set of conditions from (A). Results are expressed as mean ± SEM (n = 3 independent exps) with significance determined by two-tailed t test. Bars: 10 µm. d Laminin immunofluorescence of Mt1-mmp/ mouse macrophages transduced with a lentiviral MT1-MMP-mCherry vector (pseudo-colored green) for 48 h before culture on a basement membrane explant (pseudo-colored red) for 6 days. MT1-MMP-mCherry-positive protrusions are localized to basement membrane perforations (arrowheads) in orthogonal cross-sections or viewed en face. Images shown are representative of three independent experiments. Bars: left panels, 10 µm; right panels; 5 µm. Source data are provided as a Source data file.
Fig. 5
Fig. 5. Human macrophages mobilize MT1-MMP to degrade basement membranes.
a Relative MT1-MMP/MT1-MMP expression in human macrophages left unstimulated, polarized with LPS (1 µg/mL) or recombinant human IL-4 (20 ng/mL) as determined by qPCR (top panel) or western blot (bottom panel). Results expressed as mean ± SEM (n = 3 independent exps) with significance determined by two-tailed t test. b, c Confocal images of endogenous MT1-MMP immunofluorescence (green) in permeabilized (top three panels) or non-permeabilized (bottom 3 panels) human macrophages counterstained with DAPI (blue). In c, cell surface MT1-MMP immunofluorescence is shown from a single experiment of 3 performed where staining intensity in control (n = 11), LPS-stimulated (n = 9) and IL-4-treated (n = 9) cells and quantified as mean ± SEM with significance determined by two-tailed t test. d, e Basement membrane laminin immunofluorescence following culture with macrophages in the presence of LPS (1 µg/mL) without or with 5 µM BB-94, or 75 µg/mL IgG control antibody or 75 µg/mL of MT1-MMP blocking antibody, DX-2400, for 6 days (e). Results representative of three independent experiments performed. f Scanning electron micrograph of mesentery basement membrane after culture with macrophages in the presence of LPS (1 µg/mL) and either 75 µg/mL IgG or 75 µg/mL DX-2400 for 6 days. Images shown in b, d, f are representative of three replicates. Bars: be 10 µm. g Quantification of the area of basement membrane degraded and perforation size as analyzed by ImageJ pixel analysis of each condition from d, e. Results are expressed as mean ± SEM (n = 3 and n = 5, respectively, independent exps) with significance determined by two-tailed t test. Source data are provided as a Source data file.
Fig. 6
Fig. 6. Characterization of proteinase-dependent and proteinase-independent macrophage invasion programs.
a Orthogonal view reconstructions of laminin-stained basement membranes (red) following culture with LPS (1 µg/mL)-polarized Mt1-mmp+/+ mouse macrophages (nuclei and F-actin stained blue and green, respectively) for 6 days. Bar: 10 µm. Results representative of three independent experiments performed. b En face view of LPS-polarized Mt1-mmp+/+ mouse macrophages that traversed the apical face of the basement membrane and accumulated in the elastin-rich interstitium after a 6 d culture period. Bar: 10 µm. Results representative of three independent experiments performed. c Mt1-mmp+/+ or knockout mouse macrophages as well as human macrophages were cultured with LPS (1 µg/mL) in the absence or presence of 5 µM BB-94, the presence or absence of 75 µg/mL IgG, 75 µg/mL DX-2400, or a protease inhibitor mix (100 µM E-64d, 100 µg/mL aprotinin, 10 µM pepstatin A, 100 µg/mL SBTI, 5 µM BB-94, 2 µM leupeptin) for 6 days and transmigrated mouse (MØm) or human macrophages (MØh) located between the two basement membranes quantified as the percentage of the total number of cells. Results are presented as the mean ± SEM (n = 3, 8, 3, 3, 4, 5, and 4 independent exps of each variable, respectively) with significance determined by two-tailed t test. d, e Orthogonal (d) and 3D en face (e) reconstructions of laminin-stained basement membrane explants (red) following culture with LPS (1 µg/mL) -polarized Mt1-mmp+/+ mouse macrophages (green-stained with CFSE) in the presence of 5 µM BB-94 for 6 days. En face reconstructions show the upper and lower surfaces, respectively, of the apical basement membrane. Results representative of three independent experiments performed. Bars: 10 µm. f Orthogonal view reconstructions of laminin-stained basement membranes (red) following culture with LPS (1 µg/mL)-polarized human macrophages (nuclei and F-actin stained blue and green, respectively) cultured in the presence of 75 µg/mL DX-2400, or a protease inhibitor mix (described in c) for 6 days. Results representative of three independent experiments performed. Bar: 10 µm. Source data are provided as a Source data file.
Fig. 7
Fig. 7. Macrophages traverse preformed and elastic basement membrane portals.
a En face and orthogonal immunofluorescence of paraformaldehyde-fixed mesentery. In the middle panel, preformed portals are shown with the boxed region further expanded in the far right panel. Bars: 10 µm. Results representative of three independent experiments preformed. b, c Time-lapse series of CFSE-labeled human macrophages (green) and laminin-pre-labeled basement membrane (red) captured hourly for 7 h immediately after plating with BB-94 (5 µM). In b, LPS-polarized macrophages cultured atop a laminin-pre-labeled basement membrane (red) with BB-94 (5 µM) change cell shape while traversing preformed portals (bottom two rows). Bars: 10 µm. As the macrophage traverses a pore over 4 h (c, upper row), pore size decreases after the bulk of the cell navigates the entry point (lower row displays basement membrane alone with gap length quantified in the graph to the right). Results representative of three independent experiments. d En face view of laminin-pre-labeled basement membrane (red) cultured with LPS-polarized mouse macrophages (cells not shown for the purpose of clarity) over 44 h as pore size expands during transmigration (d). Results representative of three experiments performed. e Normalized fluorescence intensity profiles of laminin across basement membrane perforations (lines 1 and 2) or non-transmigrated areas (line 3) in explants cultured with LPS- or treated macrophages for 2 days (e). Results representative of three independent experiments. Bars: 10 µm. f En face view of laminin-pre-labeled basement membrane (red) cultured with LPS-polarized mouse macrophages for 4 days (cells not shown for the purpose of clarity), and imaged over 24 h as pore size decreases following transmigration. Bar: 10 µm. Results representative of three independent experiments performed. g Size distribution of >300 basement membrane pores determined in explants cultured with LPS-polarized mouse macrophages after 0, 2, 4, and 6 days of culture. The number of pores at each size were determined using three explants for each time point. Mean pore sizes are shown in the inset. Results are expressed as mean ± SEM (n = 414, 415, 480, and 373 pores quantified at 0, 2, 4, and 6 days, respectively) with significance determined by two-tailed Mann–Whitney U-test. Source data are provided as a Source data file.
Fig. 8
Fig. 8. A requirement for actomyosin-generated forces during human macrophage transmigration.
a En face and orthogonal immunofluorescence of laminin-labeled basement membrane explants cultured with human macrophages polarized with LPS (1 µg/mL) in the absence or presence of Y-27632 (20 µM) and BB-94 (5 µM) (left panels), or blebbistatin (20 µM) and BB-94 (5 µM) (right panels). Results representative of three independent experiments performed. Bars: 10 µm. b Quantification of transmigrated human macrophages (MØh) located between the two basement membrane sheets as a percentage of the total number of cells. Results are expressed as mean ± SEM (n = 3, 4, 3, 4, and 4 independent exps, respectively for each of the ordered variables) with significance determined by two-tailed t test. c, d 3D reconstructions of LPS-polarized human macrophages (F-actin labeled green with nuclei stained blue) cultured in the presence of Y27362/BB-94 (c) or blebbistatin/BB-94 (d) atop laminin-labeled basement membranes (red) for 4 days extending cell protrusions through matrix pores while nuclei remain confined to the upper surface. Results representative of 3 independent experiments performed. Bar: 10 µm. e Higher-magnification image of macrophages in c, d inserting cell protrusions through basement membrane pores while macrophage nuclei remain confined to the upper surface. Bar: 5 µm. f, g En face immunofluorescent views of laminin-labeled basement membrane explants (red) cultured alone or with mouse macrophages polarized with LPS (1 µg/mL) in the absence or presence of Y-27632 (20 µM) and BB-94 (5 µM) (left panels), or blebbistatin (20 µM) and BB-94 (5 µM) showing enlarged basement membrane pores at 4 days of culture (images of macrophages have been omitted to clarify pore structure; f). Results representative of three independent experiments performed. Bars: 10 µm. In g, size distribution of >300 basement membrane pores determined in explants using 3 explants for each variable after a 4-day culture period. Mean pore sizes are shown in the inset. Results are expressed as mean ± SEM (n = 300, 416, and 415 pores quantified in control versus Y-27632 or blebbistatin-treated cells in the presence of BB-94) with significance determine by two-tailed Mann–Whitney U-test. Source data are provided as a Source data file.
Fig. 9
Fig. 9. Divergent regulation of cancer cell invasion programs.
a, b En face and orthogonal images of type IV collagen-stained basement membranes cultured with 1 × 105 GFP-labeled MDA-MB-231 carcinoma cells for 4 days without or with 5 µM BB-94 (a). Bar: 10 µm. The percent basement membrane degraded and the percent transmigrated cells are quantified in b. Results are presented as the mean ± SEM (n = 3 independent exps) with significance determined by two-tailed t test. c, d En face and orthogonal images of type IV collagen-stained basement membranes cultured with actin-labeled MDA-MB-231 carcinoma cells (green) in the presence of a chemotactic gradient of EGF (10 ng/mL) for 4 days without or with 5 µM BB-94 (c). Bar: 10 µm. The percent basement membrane degraded and the percent transmigrated cells are quantified in d. Results are presented as the mean ± SEM (n = 3 independent exps) with significance determined by two-tailed t test. e, f En face and orthogonal images of type IV collagen-stained basement membranes cultured with 1 × 105 actin-labeled HT-1080 fibrosarcoma cells (green) for 4 days without or with 5 µM BB-94 (e). Bar: 10 µm. The percent basement membrane degraded and the percent transmigrated cells are quantified in f. Results are presented as the mean ± SEM (n = 3 independent exps for degradation with n = 7 and 5, respectively, for transmigration in the absence or presence of BB-94) with significance determined by two-tailed t test. g Lamin A/C expression was silenced with a specific shRNA construct and the cells either lysed for immunoblotting or immunostained for lamin A/C expression (stained red with DAPI counterstained blue). Results using a second siRNA construct are shown in Supplementary Fig. 5. Bar: 10 µm. All experiments are representative of three experiments performed. h RFP-labeled MDA-MB-231 cells transduced with an shRNA control or shLamin A/C were cultured atop basement membrane in the absence or presence of BB-94 explants for 5 days, immunostained for type IV collagen and imaged for en face and orthogonal views. Results representative of three independent experiments performed. Bar = 10 µm. i The percent basement membrane degraded and percent transmigrated MDA-MB-231 cells in panel h was quantified. Results are expressed as the mean ± SEM of 3 independent experiments for degradation and 8, 9, and 9 independent experiments performed for transmigration of shRNA control-treated, shLamin A/C-treated, and shLamin A/C-treated cells cultured in the presence of BB-94, respectively, with significance of shRNA control-treated cells versus shLamin A/C-treated cells cultured without BB-94, and shLamin A/C-treated cells cultured without BB-94 versus with BB-94 determined by two-tailed t test. Source data are provided as a Source data file.
Fig. 10
Fig. 10. MMP-dependent regulation of macrophage-basement membrane transcriptional responses.
a LPS-stimulated human macrophages were cultured atop a standard tissue culture plastic substratum or basement membrane explant for 48 h in the absence or presence of BB-94 (5 µM) and transcriptional responses quantified in 2 independent experiments. Differences in gene expression (1.5-fold enrichment cutoff) detected on plastic surfaces versus atop basement membrane explants are presented in green and red, respectively. Results representative of two independent experiments performed. b Gene ontology pathway analysis of biological responses differentially affected in the absence or presence of BB-94. c The top 20 upregulated and downregulated transcripts and fold changes are listed for macrophages cultured atop basement membrane explants in the absence or presence of BB-94. Source data are provided as a Source data file.

References

    1. Lewis CE, et al. The multifaceted role of perivascular macrophages in tumors. Cancer Cell. 2016;30:18–25. - PMC - PubMed
    1. Wynn TA, Chawla A, Pollard JW. Macrophage biology in development, homeostasis and disease. Nature. 2013;496:445–455. - PMC - PubMed
    1. Wynn TA, Vannella KM. Macrophages in tissue repair, regeneration, and fibrosis. Immunity. 2016;44:450–462. - PMC - PubMed
    1. Rowe RG, Weiss SJ. Breaching the basement membrane: who, when and how. Trends Cell Biol. 2008;18:560–574. - PubMed
    1. Rowe RG, Weiss SJ. Navigating ECM barriers at the invasive front: the cancer cell-stroma interface. Annu. Rev. Cell Dev. Biol. 2009;25:567–595. - PubMed

Publication types

Substances