. 2022 Nov;24(11):1642-1654.
doi: 10.1038/s41556-022-01011-w. Epub 2022 Oct 27.

PTEN directs developmental and metabolic signaling for innate-like T cell fate and tissue homeostasis

Affiliations

PTEN directs developmental and metabolic signaling for innate-like T cell fate and tissue homeostasis

Daniel Bastardo Blanco et al. Nat Cell Biol. 2022 Nov.

Abstract

Phosphatase and tensin homologue (PTEN) is frequently mutated in human cancer, but its roles in lymphopoiesis and tissue homeostasis remain poorly defined. Here we show that PTEN orchestrates a two-step developmental process linking antigen receptor and IL-23-Stat3 signalling to type-17 innate-like T cell generation. Loss of PTEN leads to pronounced accumulation of mature IL-17-producing innate-like T cells in the thymus. IL-23 is essential for their accumulation, and ablation of IL-23 or IL-17 signalling rectifies the reduced survival of female PTEN-haploinsufficient mice that model human patients with PTEN mutations. Single-cell transcriptome and network analyses revealed the dynamic regulation of PTEN, mTOR and metabolic activities that accompanied type-17 cell programming. Furthermore, deletion of mTORC1 or mTORC2 blocks PTEN loss-driven type-17 cell accumulation, and this is further shaped by the Foxo1 and Stat3 pathways. Collectively, our study establishes developmental and metabolic signalling networks underpinning type-17 cell fate decisions and their functional effects at coordinating PTEN-dependent tissue homeostasis.


Conflict of interest statement

Competing interests statement

H. Chi is a consultant for Kumquat Biosciences, Inc. P.G. Thomas is on the scientific advisory board of Immunoscape and Cytoagents, and has consulted for or received personal fees from Mirror Biologics, PACT Pharma, Johnson & Johnson, Pfizer, 10X Genomics, Illumina, and Elevate Bio, and has a sponsored research agreement with Elevate Bio. The remaining authors declare no competing interests.

Figures

Extended Data Fig. 1
Extended Data Fig. 1. Characterization of thymic and peripheral IL-17-producing populations in Cd4CrePtenfl/fl mice.
(a) Flow cytometry analysis and quantification of percentages and numbers of CD4CD8 double-negative (DN), CD4+CD8+ double-positive (DP), CD4+ single-positive (CD4SP), and CD8+ SP (CD8SP) thymocytes in 3–6 week-old WT and Cd4CrePtenfl/fl mice (n = 8 mice per group). (b) Quantification of numbers of IFNγ- and IL-4-producing TCRβ+ cells in the thymus from WT and Cd4CrePtenfl/fl mice (n = 12 mice per group for IFNγ+TCRβ+; 6 mice per group for IL-4+TCRb+). (c) Quantification of IL-17A+TCRβ+ cell number in spleen, peripheral lymph nodes (pLN), lung, and liver (n = 6 mice per group for spleen and pLN; 3 mice per group for lung and liver). (d) Flow cytometry analysis of CCR6 and CD127 expression on IL-17A+TCRβ+ thymocytes in WT and Cd4CrePtenfl/fl mice. (e) Flow cytometry analyses of CCR6 versus RORγtGFP expression and CCR6+CD127+ cells among CCR6+RORgtGFP+ thymocytes in Cd4CrePten+/+RORγtGFP and Cd4CrePtenfl/flRORγtGFP mice. Right: quantification of the number of RORgtGFP+CCR6+ thymocytes in Cd4CrePten+/+RORγtGFP and Cd4CrePtenfl/flRORγtGFP mice (n = 3 mice per group). (f) Quantification of numbers of IL-17A+TCRβ+ and CCR6+CD127+TCRβ+ thymocytes in 10–15-day-old WT and Cd4CrePtenfl/fl mice (n = 10 mice per group). (g) Relative Pten mRNA expression in pre-selection and post-selection DP cells from thymus of WT and Cd4CrePtenfl/fl mice (n = 5 mice per group for TCRβCD69 DP cells; 5 WT and 4 Cd4CrePtenfl/fl mice for TCRβ+CD69+ DP cells). (h) Relative Pten mRNA expression in WT pre-selection DP cells stimulated with anti-CD3/CD28 antibodies for 4 h (n = 5 mice per group). (i) Violin plots showing expression of Pten, Rorc, and Il23r in indicated thymocyte populations from WT mice (n = 2 mice). Data are representative of at least two (d,e; flow cytometry panels), or combined from five (a), at least four (b; c, spleen and pLN), three (c, lung and liver), or two (eh) independent experiments. Two-tailed unpaired Student’s t-test (a,b,eh). Data are shown as means ± SEM (ac,eh). *P < 0.05; **P < 0.01; ***P < 0.001; ns, not significant. Numbers indicate percentages of cells in gates (a,d,e).
Extended Data Fig. 2
Extended Data Fig. 2. Dispensable role of IL-6 for the generation and thymic-resident features of PTEN-deficient IL-17-producing cells.
(a) Quantification of percentages and numbers of IL-17A+TCRβ+ and CCR6+CD127+TCRβ+ thymocytes (n = 7 WT, 7 Cd4CrePtenfl/fl, 4 Il6−/−, and 8 Cd4CrePtenfl/flIl6−/− mice for frequencies; 6 WT, 6 Cd4CrePtenfl/fl, 2 Il6−/− and 6 Cd4CrePtenfl/flIl6−/− for numbers). (b) Relative number of IL-17A+TCRβ+ thymocytes in indicated 4–6-week-old mice (values were set to WT equal to 1 for normalization) (n = 11 WT, 8 Cd4CrePten+/fl, and 9 Cd4CrePtenfl/fl mice). (c) Percentages of IL-17A+TCRβ+ thymocytes and IL-17A+CD4+Foxp3CD44+ effector/memory T cells in the spleen and mesenteric lymph nodes (mLN) of 5–9-month-old WT and Cd4CrePtenfl/fl mice (n = 8 mice per group for thymus and spleen; 6 mice per group for mLN). (d) Relative number of IL-17A+TCRβ+ thymocytes (n = 5 mice per group for ≤ 20-week-old male mice; 10 mice per group for ≤ 20-week-old female mice and > 20-week-old female mice; 2 mice per group for > 20-week-old male mice). (e,f) Survival curves of male and female WT, Cd4CrePtenfl/fl, and Cd4CrePtenfl/flIl17ra−/− (e; n = 18–111 mice per group; see legend key for details), or male and female WT, Cd4CrePtenfl/fl, and Cd4CrePtenfl/flIl23a−/− mice (f; n = 48–111 mice per group; see legend key for details). WT and Cd4CrePtenfl/fl mice were the same in e and f. (g) Relative number of IL-17A-GFP+TCRβ+ cells (n = 3 mice per group for spleen, peripheral lymph nodes (pLN), and lung; 2 mice per group for liver). (h) Flow cytometry analysis of S1PR1, CD62L, CD69, and CD103 expression. Data are representative of at least three (h), or combined from four (a), at least six (b,d), three (c, thymus and spleen), or two (c, mLN; g) independent experiments. Two-tailed unpaired Student’s t-test (c,d) or log-rank test (e,f). Data are shown as means ± SEM (ad,g). *P < 0.05; **P < 0.01; ns, not significant. Numbers indicate mean fluorescence intensity (h).
Extended Data Fig. 3
Extended Data Fig. 3. Cellular and molecular characterization of PTEN-deficient IL-17-producing thymocytes.
(a) Flow cytometry analysis and quantification of percentages of TCRβ+ or TCRγδ+CCR6+CD127+ thymocytes (n = 7 mice per group). (b) Flow cytometry analysis and quantification of percentage of CD3ε+CCR6+CD127+TCRβ+ thymocytes (n = 7 mice per group). (c) Flow cytometry analysis and quantification of relative TCRβ mean fluorescence intensity (MFI) on the indicated thymocyte population from Cd4CrePtenfl/fl mice (n = 3 mice). (d) Flow cytometry analysis of CD1d:PBS57 tetramer staining on IL-17A+TCRβ+ thymocytes. (e) Flow cytometry analysis of IL-17A production among CD44+ thymocytes. (f) Flow cytometry analysis of CD1d:PBS57- and MR1:5-OP-RU-tetramer co-staining on CCR6+CD127+TCRβ+ or IL-17A+TCRβ+ thymocytes (blue, iNKT17; purple, MAIT17; orange, iNKT17MAIT17). (g,h) Enrichment plots showing activity of PTEN gene signature (see Supplementary Table 1) in WT iNKT (g) or WT MAIT (h) compared to CD4SP or CD8SP cells from public microarray datasets,. PTEN KO, Cd4CrePtenfl/fl; NES, normalized enrichment score; FDR, false discovery rate. (i) Flow cytometry analysis and quantification of MAIT cell number (n = 9 WT and 10 Cd4CrePtenfl/fl mice). (j) Quantification of percentages and numbers of RORγt+ and T-bet+ MAIT cells (pregated on total MAIT cells) (n = 7 mice per group). (k) Flow cytometry analysis and quantification of percentages of active caspase-3+ thymic iNKT and MAIT cells (n = 5 mice per group). (l) Quantification of percentages of BrdU+ thymic iNKT and MAIT cells (n = 3 mice per group for iNKT cells; 2 mice per group for MAIT cells). (m) Quantification of percentages of Ki67+ iNKT1 (CD1d:PBS57-tetramer+T-bet+PLZFlo) and iNKT2 (CD1d:PBS57-tetramer+PLZFhiRORγt) cells (n = 6 mice per group). Data are representative of at least six (d), two (e), or five (f), or combined from four (a,i,m), six (b,j), three (c), five (k), or two (l) independent experiments. Two-tailed unpaired Student’s t-test (b,c,im). Data are shown as means ± SEM (ac,im). *P < 0.05; **P < 0.01; ***P < 0.001; ns, not significant. Numbers indicate MFI (c) or percentages of cells in gates or quadrants (df,j,k).
Extended Data Fig. 4
Extended Data Fig. 4. TCR repertoire, surface molecule, and transcriptome analyses of PTEN-deficient iNKT17MAIT17 thymocytes.
(a) Shannon or Inverse Simpson’s diversity scores of TCR repertoires of indicated cell populations among CCR6+CD127+TCRβ+ thymocytes from Cd4CrePtenfl/fl mice (n = 3 mice). (b) Inverse Simpson’s diversity scores of the TCRα and TCRβ repertoires of sort-purified iNKT17, MAIT17, and iNKT17MAIT17 cells among CCR6+CD127+TCRβ+ thymocytes from Cd4CrePtenfl/fl mice. Each dot corresponds to an individual mouse (n = 4 mice). (c) Relative frequency of TCRα and TCRβ clones in sort-purified iNKT17, MAIT17, and iNKT17MAIT17cells among CCR6+CD127+TCRβ+ thymocytes from Cd4CrePtenfl/fl mice (n = 4 mice). FDR, false discovery rate. (d) Plot depicting differential expression profiles (|log2 FC| > 0.5, FDR < 0.05) in each indicated comparison. Red and blue numbers indicate the numbers of upregulated and downregulated genes in each comparison, respectively. Cells were profiled by scRNA-seq and identified as in Fig. 3e (n = 4 WT and 3 Cd4CrePtenfl/fl mice). (e) Functional enrichment analysis of the differentially expressed (|log2 FC| > 0.5, FDR < 0.05) genes in PTEN-deficient versus WT iNKT17MAIT17 cells (n = 4 WT and 3 Cd4CrePtenfl/fl mice). (f) Flow cytometry analysis and quantification of the numbers of CD4CD8 double-negative (DN), CD4+CD8+ double-positive (DP), CD4+ single-positive (CD4SP), and CD8+ SP (CD8SP) cells among the iNKT17MAIT17 thymocytes (pre-gated on CCR6+CD127+TCRβ+ cells) (n = 9 WT or 10 Cd4CrePtenfl/fl mice). (g) Flow cytometry analysis and quantification of percentages and numbers of PD-1 and PD-1+ cells among the CD4CD8iNKT17MAIT17 thymocytes (pre-gated on CCR6+CD127+TCRβ+ cells) (n = 4 WT or 5 Cd4CrePtenfl/fl mice). Data are combined from two (d), five (f) or three (g) independent experiments. Two-tailed paired Student’s t-test followed by Benjamin-Hochberg method (c; depicted for hyperexpanded TCR clonotypes), right-tailed Fisher’s exact test, (e) or two-tailed unpaired Student’s t-test (f,g). Data are shown as means ± SEM (f,g). Box plots (d): Box shows median with interquartile range (IQR) of 25% (minima)–75% (maxima); whiskers show 25% quantile ± IQR. **P < 0.01; ***P < 0.001; ns, not significant. Numbers indicate percentages of cells in gates (f,g).
Extended Data Fig. 5
Extended Data Fig. 5. Metabolic signatures of type-17 innate-like T cell subsets.
(a) Flow cytometry analysis and quantification of TMRM and MitoTracker Deep Red staining of CCR6+CD127+TCRβ+ thymocytes (n = 6 per group for TMRM; 6 WT and 5 Cd4CrePtenfl/fl for MitoTracker Deep Red). Data are relative to the average TMRM or MitoTracker Deep Red mean fluorescence intensity (MFI) in CCR6+CD127+TCRβ+ thymocytes from WT mice. (b) Metabolic signature scores of single cell transcriptomes of PTEN-deficient iNKT17, MAIT17, and iNKT17MAIT17 cells as compared with WT. Cells were profiled by scRNA-seq and identified as in Fig. 3e. Alignment to the left of the dashed line indicates enrichment in PTEN-deficient cells; alignment to the right of the dashed line indicates enrichment in WT cells (n = 3 WT and 4 Cd4CrePtenfl/fl mice). (c) Quantification of numbers of IL-17A+TCRβ+ and CCR6+CD127+TCRβ+ thymocytes in WT and Cd4CrePtenfl/fl mice treated with rapamycin or vehicle (n = 4 WT + vehicle, 4 Cd4CrePtenfl/fl + vehicle, 3 WT + rapamycin, and 4 Cd4CrePtenfl/fl + rapamycin mice for IL-17A+TCRβ+ thymocytes; 4 mice per group for CCR6+CD127+TCRβ+ thymocytes). (d) GSEA of Hallmark pathways upregulated (red) or downregulated (blue) in pre-selection DP cells from Cd4CrePtenfl/fl (PTEN KO) versus WT mice; Cd4CrePtenfl/flRptorfl/fl (PTEN/RAPTOR dKO) versus PTEN KO mice; and Cd4CrePtenfl/flRictorfl/fl (PTEN/RICTOR dKO) versus PTEN KO mice. NES, normalized enrichment score; FDR, false discovery rate. (e,f) Quantification of MitoTracker Deep Red staining of CCR6+CD127+TCRβ+ thymocytes from the indicated mice (e; n = 7 WT, 7 Cd4CrePtenfl/fl, 3 Cd4CreRptorfl/fl and 10 Cd4CrePtenfl/flRptorfl/fl mice; f; n = 11 WT, 8 Cd4CrePtenfl/fl, 2 Cd4CreRictorfl/fl, and 9 Cd4CrePtenfl/flRictorfl/fl mice). (g) Heatmap depicting the expression of Rorc and Il23r in post-selection DP cells from indicated mice (n = 4 WT, 5 Cd4CrePtenfl/fl, 7 Cd4CrePtenfl/flRptorfl/fl and 5 Cd4CrePtenfl/flRictorfl/fl mice). Data are combined from four (a, TMRM; e), three (a, MitoTracker Deep Red), two (c), or five (f) independent experiments. Two-tailed unpaired Student’s t-test (a) or one-way ANOVA with Tukey’s test (c,e,f). Data are shown as means ± SEM (a,c,e,f). ***P < 0.001. Numbers indicate MFI (a).
Extended Data Fig. 6
Extended Data Fig. 6. Roles of Foxo1, Stat3, and IL-23 signaling in type-17 innate-like T cell development.
(a) Flow cytometry analysis and quantification of percentage and number of CCR6+CD127+TCRβ+ thymocytes. Lower: flow cytometry analysis and quantification of the relative numbers of indicated subsets among CCR6+CD127+TCRβ+ thymocytes (n = 5 mice per group). (b) Quantification of TMRM and MitoTracker Deep Red staining of CCR6+CD127+TCRβ+ thymocytes (n = 6 WT and 10 Cd4CreFoxo1fl/fl mice). (c) Quantification of percentages of indicated populations among CCR6+CD127+TCRβ+ thymocytes (n = 7 WT and 8 Il23a−/− mice). (d) Quantification of percentages of indicated thymic iNKT subsets (n = 3 WT and 4 Il23a−/− mice for RORγt+PLZFint iNKT17, T-bet+PLZFlo iNKT1, PLZFhiRORγt iNKT2 and IL-4+ iNKT2; 5 WT and 6 Il23a−/− mice for IL-17A+ iNKT17; and 4 WT and 5 Il23a−/− mice for IFNγ+ iNKT1). (e) PTEN orchestrates a two-step thymic program to regulate the development of type-17 innate-like T cells downstream of TCR and IL-23–IL-23R–Stat3 signaling. Upper: In pre-positive selection DP cells, TCR signals initiate positive selection and downregulate PTEN expression. In post-positive selection DP cells, PTEN restrains RORγt-dependent induction of the type-17 program that induces IL-23R expression, and restrains Foxo1 activity that inhibits IL-23R expression. Sustained downregulation of PTEN expression at this stage allows for induction of IL-23R expression and IL-23–IL-23R–Stat3 signaling, which promotes the development of type-17 innate-like T cell subsets. Lower left, PTEN inhibits mTOR signaling to restrain metabolic activities and expression of RORγt and IL-23R in DP cells. Lower right, hyperactivation of IL-17RA and IL-23 signaling contributes to the fatality of mice with PTEN haploinsufficiency, a model of human PTEN Hamartoma Tumor Syndrome (PHTS). Data are combined from two (a,b), one (d, transcription factors and IL-4+ iNKT2 cells), four (c), or three (d, IL-17A+ iNKT17 and IFNγ+ iNKT1 cells) independent experiments. Two-tailed unpaired Student’s t-test (ad). Data are shown as means ± SEM (ad). *P < 0.05; **P < 0.01; ***P < 0.001; ns, not significant. Numbers indicate percentage of cells in gates or quadrants (a).
Fig. 1.
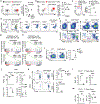
Fig. 1.. PTEN deficiency enhances IL-17-producing cells in the thymus and type-17 programming in post-selection DP thymocytes.
(a) Flow cytometry analysis and quantification of percentages and numbers of IL-17A- and IL-17F-producing TCRβ+ cells in the thymus of WT and Cd4CrePtenfl/fl mice after PMA/ionomycin stimulation for 4 h (n = 12 mice per group for IL-17A+TCRβ+; 6 mice per group for IL-17F+TCRβ+). (b) Flow cytometry analysis of cells among IL-17A+TCRβ+ thymocytes that express RORγt, CCR6, or CD127 from WT and Cd4CrePtenfl/fl mice. (c) GSEA enrichment plot of TH17-associated signature (obtained from GSE27241) in TCRβ+CD69+ post-selection CD4+CD8+ double-positive (DP) cells from Cd4CrePtenfl/fl compared to WT mice. NES, normalized enrichment score; FDR, false discovery rate. (d,e) TCRβCD69 pre-selection or TCRβ+CD69+ post-selection DP cells were isolated from WT or Cd4CrePtenfl/fl mice and subjected to transcriptome profiling to identify differentially expressed genes (|log2 fold-change| > 0.5, FDR < 0.1) between WT and PTEN-deficient cells, followed by weighted gene correlation network analysis (WGCNA). (d) Heatmap of differentially expressed genes in clusters identified by WGCNA (C1–C4). Functional gene modules (C1–C4) (see also Supplementary Table 4). (f) Real-time PCR analysis of Rorc expression in post-selection DP cells from WT and Cd4CrePtenfl/fl mice (n = 5 WT and 4 Cd4CrePtenfl/fl mice). (g) Flow cytometry analysis and quantification of relative mean fluorescence intensity (MFI) of RORγt expression in post-selection DP cells from WT and Cd4CrePtenfl/fl mice (n = 9 WT and 8 Cd4CrePtenfl/fl mice). (h) Relative Pten mRNA expression in pre-selection and post-selection DP cells from WT mice (n = 5 mice per group). (i) Relative Il23r mRNA expression in post-selection DP cells from WT and Cd4CrePtenfl/fl mice (n = 2 WT and 3 Cd4CrePtenfl/fl mice). Data are representative of at least two (b), or combined from at least five (a), two (f,h,i), or four (g) independent experiments. Two-tailed unpaired Student’s t-test (a,fi). Data are shown as means ± SEM (a,fi). *P < 0.05; **P < 0.01. Numbers indicate percentages of cells in gates (a,b) or MFI (g).
Fig. 2.
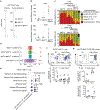
Fig. 2.. Loss of PTEN enhances IL-23-dependent development of IL-17-producing cells in the thymus, which contribute to fatality of female PTEN-haploinsufficient mice.
(a,b) Quantification of percentages and numbers of IL-17A+TCRβ+ (a) and CCR6+CD127+TCRβ+ cells (b) in WT, Cd4CrePtenfl/fl, Il23a−/−, and Cd4CrePtenfl/flIl23a−/− mice (n = 12 WT, 12 Cd4CrePtenfl/fl, 9 Il23a−/−, and 10 Cd4CrePtenfl/flIl23a−/− mice for IL-17A+TCRβ+ cells; 11 WT, 12 Cd4CrePtenfl/fl, 7 Il23a−/−, and 6 Cd4CrePtenfl/flIl23a−/− mice for CCR6+CD127+TCRβ+ cells). The average fold reduction in number of the indicated cell population in Il23a−/− compared with WT mice is indicated. (c) Quantification of relative number (normalized to WT controls) of IL-17A+TCRβ+ thymocytes in > 8-week-old WT and Cd4CrePten+/fl mice (n = 10 WT and 9 Cd4CrePten+/fl mice; both male and female mice were included). (d,e) Survival curves of male and female WT, Cd4CrePten+/fl, and Cd4CrePten+/flIl17ra−/− (d; n = 30–92 mice per group; see legend key for details), or male and female WT, Cd4CrePten+/fl, and Cd4CrePten+/flIl23a−/− mice (e; n = 39–92 mice per group; see legend key for details). WT and Cd4CrePten+/fl mice were the same in d and e. (f) Quantification of percentages of Rag2GFP+ and Rag2GFP− cells among CCR6+CD127+TCRβ+ thymocytes from WT and Cd4CrePtenfl/fl mice crossed with Rag2GFP reporter mice (n = 2 mice per group). (g) Quantification of relative number of IL-17A-GFP+TCRβ+ thymocytes from Pten+/+Il17iCreRosa26GFP (values were set to 1 for normalization) and Pten+/−Il17iCreRosa26GFP reporter mice (n = 3 mice per group). Data are combined from at least two (a,f,g) or at least five (b,c) independent experiments. One-way ANOVA with Tukey’s test (a,b), two-tailed unpaired Student’s t-test (c), or log-rank test (d,e). Data are shown as means ± SEM (ac,f,g). *P < 0.05; **P < 0.01; ***P < 0.001; ns, not significant.
Fig. 3.
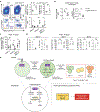
Fig. 3.. PTEN-deficient IL-17-producing T cells are heterogenous and less proliferative.
(a) Flow cytometry analysis and quantification of the numbers of IL-17A-producing TCRγδ or TCRγδ+ thymocytes (n = 5 mice per group). (b) Flow cytometry analysis and quantification of relative PLZF mean fluorescence intensity (MFI) in CCR6+CD127+TCRβ+ thymocytes compared to CD8+TCRβ+ thymocytes from Cd4CrePtenfl/fl mice (n = 4 mice). (c) Quantification of percentage and number of iNKT17 cells (RORγt+PLZFint) among total iNKT cells (n = 6 per group). (d) Flow cytometry analysis and quantification of number of CCR6+CD127+TCRβ+ thymocytes (n = 4 WT, 3 Cd4CrePtenfl/fl, 4 Cd1d−/−, and 3 Cd4CrePtenfl/flCd1d−/− mice). (e) UMAP (Uniform Manifold Approximation and Projection) plots showing distribution of iNKT17, MAIT17, and iNKT17MAIT17 cells from single-cell RNA-sequencing analysis. Right: frequency of iNKT17, MAIT17, and iNKT17MAIT17 cells among CCR6+CD127+TCRβ+ thymocytes (n = 4 WT and 3 Cd4CrePtenfl/fl mice). (f) Quantification of numbers of iNKT17, MAIT17, and iNKT17MAIT17 cells among CCR6+CD127+TCRβ+ or IL-17A+TCRβ+ thymocytes (n = 8 WT and 7 Cd4CrePtenfl/fl mice). See Extended Data Fig. 3f for gating strategies. (g) Quantification of relative numbers of iNKT17, MAIT17, and iNKT17MAIT17 cells among IL-17A+TCRβ+ thymocytes in Cd4CrePtenfl/fl mice relative to WT mice (n = 7 mice). (h) Quantification of percentages and numbers of IL-17- and IFNγ-producing MAIT17 and MAIT1 cells from thymus (n = 19 mice per group). (i) Quantification of percentage of Ki67+ iNKT17 (CD1d:PBS57-tetramer+RORγt+PLZFint) or MAIT17 (MR1:5-OP-RU-tetramer+RORγt+T-bet) cells from thymus (n = 6 mice per group). Data are combined from five (a,f,g), two (b,d), four (c,i), or eight (h) independent experiments. Two-tailed unpaired Student’s t-test (ac,f,h,i) or one-way ANOVA with Tukey’s test (d,g). Data are shown as means ± SEM (ad,fi). *P < 0.05; **P < 0.01; ***P < 0.001; ns, not significant. Numbers indicate percentages of cells in gates (a,d) or MFI (b).
Fig. 4.
Fig. 4.. PTEN plays a cell-intrinsic role for the development of IL-17-producing thymocytes with TCR and transcriptional diversity.
(a,b) Ratio of IL-17A+TCRβ+ cells or CCR6+CD127+TCRβ+ cells among CD45.2+ relative to CD45.1+ ‘spike’ thymocytes in the indicated mixed bone marrow chimeras (n = 4 mice per group). (b) Quantification of MAIT cell number among CD45.1+ ‘spike’ or CD45.2+ thymocytes in Cd4CrePtenfl/fl chimera mice (n = 4 mice). (c) Shannon or Inverse Simpson’s diversity scores of TCR repertoires for iNKT17, MAIT17, and iNKT17MAIT17 cell (as identified in Fig. 3e) from WT mice (n = 4 mice). (d) Relative abundance of TCR clones in iNKT17, MAIT17, and iNKT17MAIT17 populations from WT mice (n = 4 mice). (e) Quantification of unique TCR clonotypes in CCR6+CD127+TCRβ+ thymocytes from WT and Cd4CrePtenfl/fl mice (n = 4 WT and 3 Cd4CrePtenfl/fl mice). (f) Sequence analysis of top 20 expanded clonotypes shared by WT and PTEN-deficient CCR6+CD127+TCRβ+ thymocytes (n = 4 WT and 3 Cd4CrePtenfl/fl mice). Each clonotype indicated contains CDR3 amino acid sequences for both the TCRα and TCRβ chains, concatenated by an underscore symbol. (g) Shannon or Inverse Simpson’s diversity scores of TCR repertoires for iNKT17, MAIT17, and iNKT17MAIT17 cells from WT and Cd4CrePtenfl/fl mice (n = 4 WT and 3 Cd4CrePtenfl/fl mice). (h) Relative abundance of TCR clones in the iNKT17, MAIT17, and iNKT17MAIT17 populations from WT and Cd4CrePtenfl/fl mice (n = 4 WT and 3 Cd4CrePtenfl/fl mice). (i) Fold change/fold change plot analysis of the average gene expression of MAIT17 versus iNKT17, iNKT17MAIT17 versus iNKT17, or iNKT17MAIT17 versus MAIT17 compared with average gene expression changes in Cd4CrePtenfl/fl versus WT mice (transcriptomes of CCR6+CD127+TCRβ+ thymocytes were profiled by scRNA-seq and the subsets were identified as in Fig. 3e). Numbers of differentially expressed genes in each quadrant are indicated. Data are combined from two (a,b) independent experiments. Two-tailed unpaired Student’s t-test (a,b). Data are shown as means ± SEM (a,b,e). ***P < 0.001.
Fig. 5.
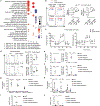
Fig. 5.. PTEN interplays with cellular metabolism and depends upon mTORC1 and mTORC2 signaling to shape type-17 programming.
(a) GSEA of Hallmark pathways upregulated (red) or downregulated (blue) in pre- or post-selection DP cells from Cd4CrePtenfl/fl (PTEN KO) versus WT mice. FDR, false discovery rate. (b) Flow cytometry analysis and quantification of relative TMRM and MitoTracker Deep Red mean fluorescence intensity (MFI) (n = 4 per group for TMRM; 3 mice per group for MitoTracker Deep Red). (c) Oxygen consumption rate (OCR) and ECAR (ECAR) in pre-selection DP cells from indicated mice (n = 6 technical replicates per group, pooled from 2 biological replicates). (d) Flow cytometry analysis and quantification of relative p-S6 (Ser235/236) or p-Akt (Ser473) MFI in DP cells from indicated mice (n = 7 mice per group for p-S6; 8 mice per group for p-Akt). (e,f) Quantification of numbers of IL-17A+TCRβ+ and CCR6+CD127+TCRβ+ thymocytes from indicated mice (e; n = 4 WT, 5 Cd4CrePtenfl/fl, 2 Cd4CreRptorfl/fl, and 5 Cd4CrePtenfl/flRptorfl/fl mice; f; n = 6 WT, 5 Cd4CrePtenfl/fl, 4 Cd4CreRictorfl/fl, and 7 Cd4CrePtenfl/flRictorfl/fl mice for IL-17A+TCRβ+ thymocytes; 7 WT, 7 Cd4CrePtenfl/fl, 4 Cd4CreRictorfl/fl, and 8 Cd4CrePtenfl/flRictorfl/fl mice for CCR6+CD127+TCRβ+ thymocytes). (g,h) Quantification of numbers of iNKT17, MAIT17, and iNKT17MAIT17 cells among CCR6+CD127+TCRβ+ thymocytes from indicated mice (g; n = 4 WT, 5 Cd4CrePtenfl/fl, 2 Cd4CreRptorfl/fl, and 5 Cd4CrePtenfl/flRptorfl/fl mice; h; n = 5 WT, 6 Cd4CrePtenfl/fl, 2 Cd4CreRictorfl/fl, and 7 Cd4CrePtenfl/flRictorfl/fl mice). (i,j) Quantification of total thymic MAIT cells from indicated mice (i; n = 8 WT, 5 Cd4CrePtenfl/fl, 5 Cd4CreRptorfl/fl, and 6 Cd4CrePtenfl/flRptorfl/fl mice; j; n = 6 WT, 5 Cd4CrePtenfl/fl, 4 Cd4CreRictorfl/fl, and 7 Cd4CrePtenfl/flRictorfl/fl mice). Data are representative of three (c), or combined from at least two (b, MitoTracker Deep Red; e,g,h), at least three (b, TMRM; d, p-S6; f,j), four (i), or five (d, p-Akt) independent experiments. Two-tailed unpaired Student’s t-test (c,d), or one-way ANOVA with Tukey’s test (b,ej). Data are shown as means ± SEM (bj). *P < 0.05; **P < 0.01; ***P < 0.001; ns, not significant.
Fig. 6.
Fig. 6.. Foxo1 and IL-23–Stat3 signaling reciprocally orchestrate type 17 innate-like cell development.
(a) Flow cytometry analysis and quantification of relative mean fluorescence intensity (MFI) of p-Foxo1/Foxo3a in DP cells (n = 6 WT, 4 Cd4CrePtenfl/fl, 2 Cd4CreRictorfl/fl, and 5 Cd4CrePtenfl/flRictorfl/fl mice). (b,c) Thymic IL-17A+TCRβ+ (b) or MAIT (c) cell number (n = 5 mice per group). (d) Relative Rorc and Il23r mRNA expression in post-selection DP cells (n = 4 WT and 3 Cd4CreFoxo1fl/fl mice). (e) IL-17A+TCRβ+ or CCR6+CD127+TCRβ+ cell number (n = 7 WT, 5 Cd4CrePtenfl/fl, 6 Cd4CreStat3fl/fl, and 8 Cd4CrePtenfl/flStat3fl/fl mice for IL-17A+TCRβ+ thymocytes; 7 WT, 6 Cd4CrePtenfl/fl, 5 Cd4CreStat3fl/fl, and 8 Cd4CrePtenfl/flStat3fl/fl mice for CCR6+CD127+TCRβ+ thymocytes). (f) Total thymic MAIT cell number (n = 4 WT, 3 Cd4CrePtenfl/fl, 5 Cd4CreStat3fl/fl, and 5 Cd4CrePtenfl/flStat3fl/fl mice). (g) Expression of indicated genes in post-selection DP cells (n = 5 WT, 3 Cd4CrePtenfl/fl, and 4 Cd4CrePtenfl/flStat3fl/fl mice). (h) Il23r in public datasets of thymic MAIT17 and MAIT1 cells, (h) or iNKT cell subsets (i). (j) Il23r expression in indicated thymocyte subsets from WT mice (n = 2 mice). (k) iNKT17, MAIT17, and iNKT17MAIT17 cell numbers (n = 12 WT, 12 Cd4CrePtenfl/fl, 7 Il23a−/−, and 8 Cd4CrePtenfl/flIl23a−/− mice). (l) Total thymic MAIT cell number (n = 10 WT, 10 Cd4CrePtenfl/fl, 5 Il23a−/−, and 6 Cd4CrePtenfl/flIl23a−/− mice). Average fold-change in number of the indicated cell population in WT versus Il23a−/− mice is indicated (k,l). Data are combined from four (a), at least two (b,c,l), one (d), or at least three (e,f,k) independent experiments. Two-tailed unpaired Student’s t-test (bd), one-way ANOVA with Tukey’s test (a,e,f,k,l), or two-tailed Wilcoxon rank sum test (hj; i depicts iNKT17 comparison versus all other subsets; j depicts post-selection DP comparison versus iNKT17, MAIT17, and iNKT17MAIT17). Data are shown as means ± SEM (af,k,l). Box plots (h): Box shows median with interquartile range (IQR) of 25% (minima)–75% (maxima); whiskers show 25% quantile ± IQR. *P < 0.05; **P < 0.01; ***P < 0.001; ns, not significant.

Comment in

References

    1. Taylor H, Laurence ADJ & Uhlig HH The Role of PTEN in Innate and Adaptive Immunity. Cold Spring Harb Perspect Med 9, a036996, doi:10.1101/cshperspect.a036996 (2019). - DOI - PMC - PubMed
    1. Hagenbeek TJ & Spits H T-cell lymphomas in T-cell-specific Pten-deficient mice originate in the thymus. Leukemia 22, 608–619, doi:10.1038/sj.leu.2405056 (2008). - DOI - PubMed
    1. Liu X et al. Distinct roles for PTEN in prevention of T cell lymphoma and autoimmunity in mice. J Clin Invest 120, 2497–2507, doi:10.1172/JCI42382 (2010). - DOI - PMC - PubMed
    1. Xue L, Nolla H, Suzuki A, Mak TW & Winoto A Normal development is an integral part of tumorigenesis in T cell-specific PTEN-deficient mice. Proc Natl Acad Sci U S A 105, 2022–2027, doi:10.1073/pnas.0712059105 (2008). - DOI - PMC - PubMed
    1. Hagenbeek TJ et al. The loss of PTEN allows TCR alphabeta lineage thymocytes to bypass IL-7 and Pre-TCR-mediated signaling. J Exp Med 200, 883–894, doi:10.1084/jem.20040495 (2004). - DOI - PMC - PubMed

Methods-only references

    1. Yang K, Neale G, Green DR, He W & Chi H The tumor suppressor Tsc1 enforces quiescence of naive T cells to promote immune homeostasis and function. Nat Immunol 12, 888–897, doi:10.1038/ni.2068 (2011). - DOI - PMC - PubMed
    1. Shiota C, Woo JT, Lindner J, Shelton KD & Magnuson MA Multiallelic disruption of the rictor gene in mice reveals that mTOR complex 2 is essential for fetal growth and viability. Dev Cell 11, 583–589, doi:10.1016/j.devcel.2006.08.013 (2006). - DOI - PubMed
    1. Cua DJ et al. Interleukin-23 rather than interleukin-12 is the critical cytokine for autoimmune inflammation of the brain. Nature 421, 744–748, doi:10.1038/nature01355 (2003). - DOI - PubMed
    1. Paik JH FOXOs in the maintenance of vascular homoeostasis. Biochem Soc Trans 34, 731–734, doi:10.1042/BST0340731 (2006). - DOI - PubMed
    1. Yang K et al. Homeostatic control of metabolic and functional fitness of Treg cells by LKB1 signalling. Nature 548, 602–606, doi:10.1038/nature23665 (2017). - DOI - PMC - PubMed

Publication types