. 2022 Nov;24(11):1630-1641.
doi: 10.1038/s41556-022-01001-y. Epub 2022 Oct 27.

Atypical nuclear envelope condensates linked to neurological disorders reveal nucleoporin-directed chaperone activities

Affiliations

Atypical nuclear envelope condensates linked to neurological disorders reveal nucleoporin-directed chaperone activities

Sarah M Prophet et al. Nat Cell Biol. 2022 Nov.

Abstract

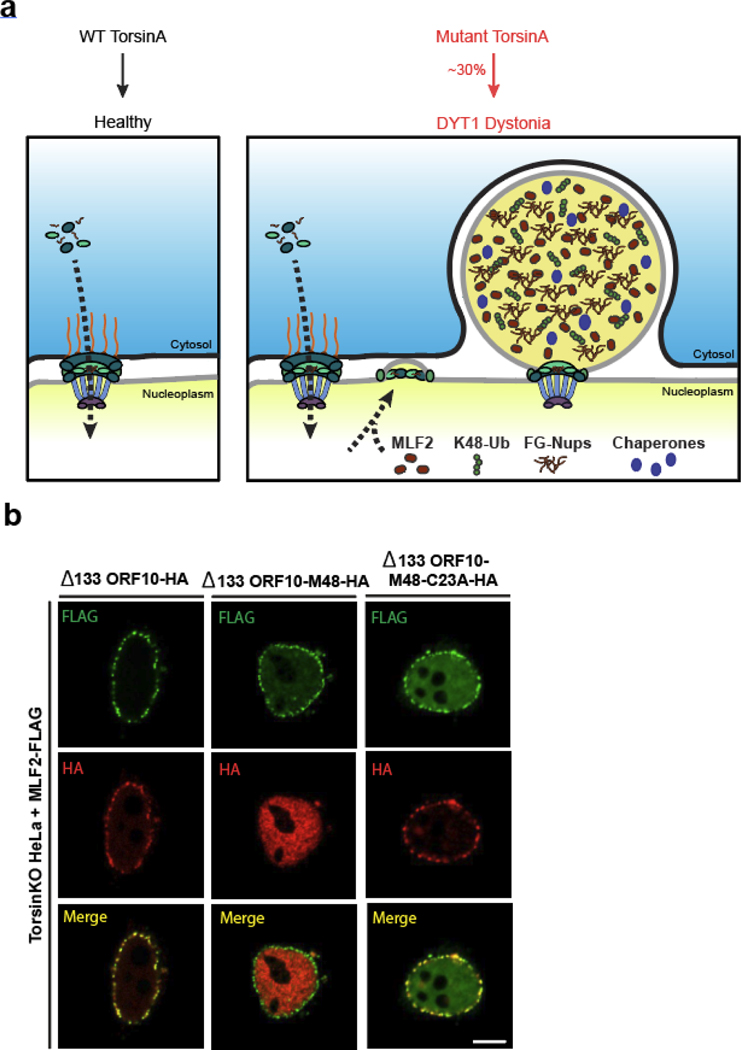
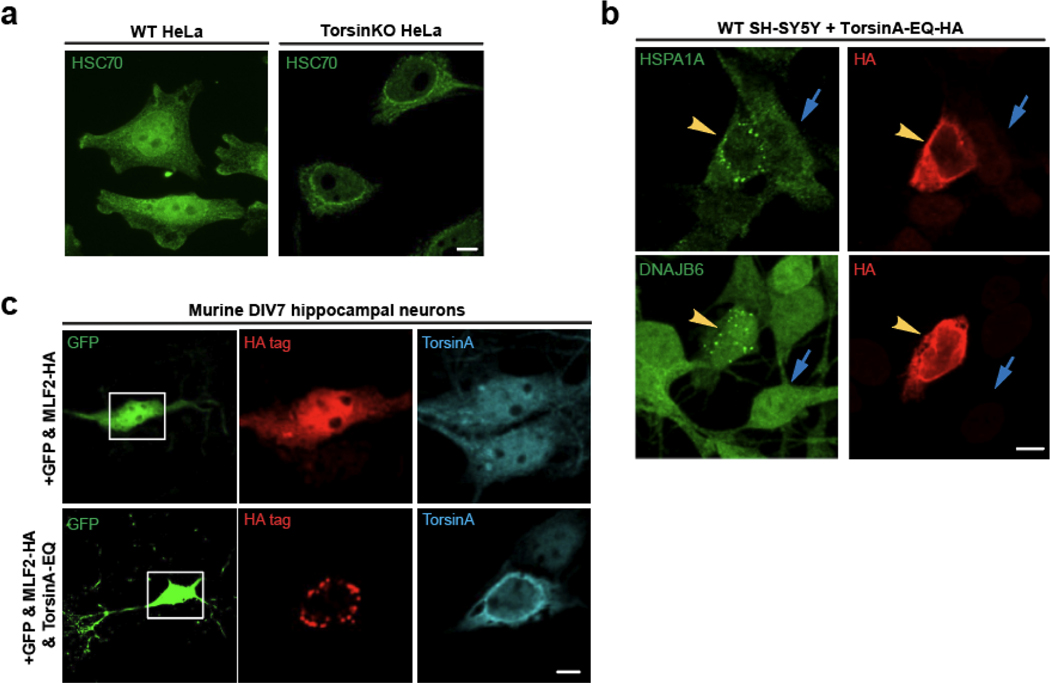
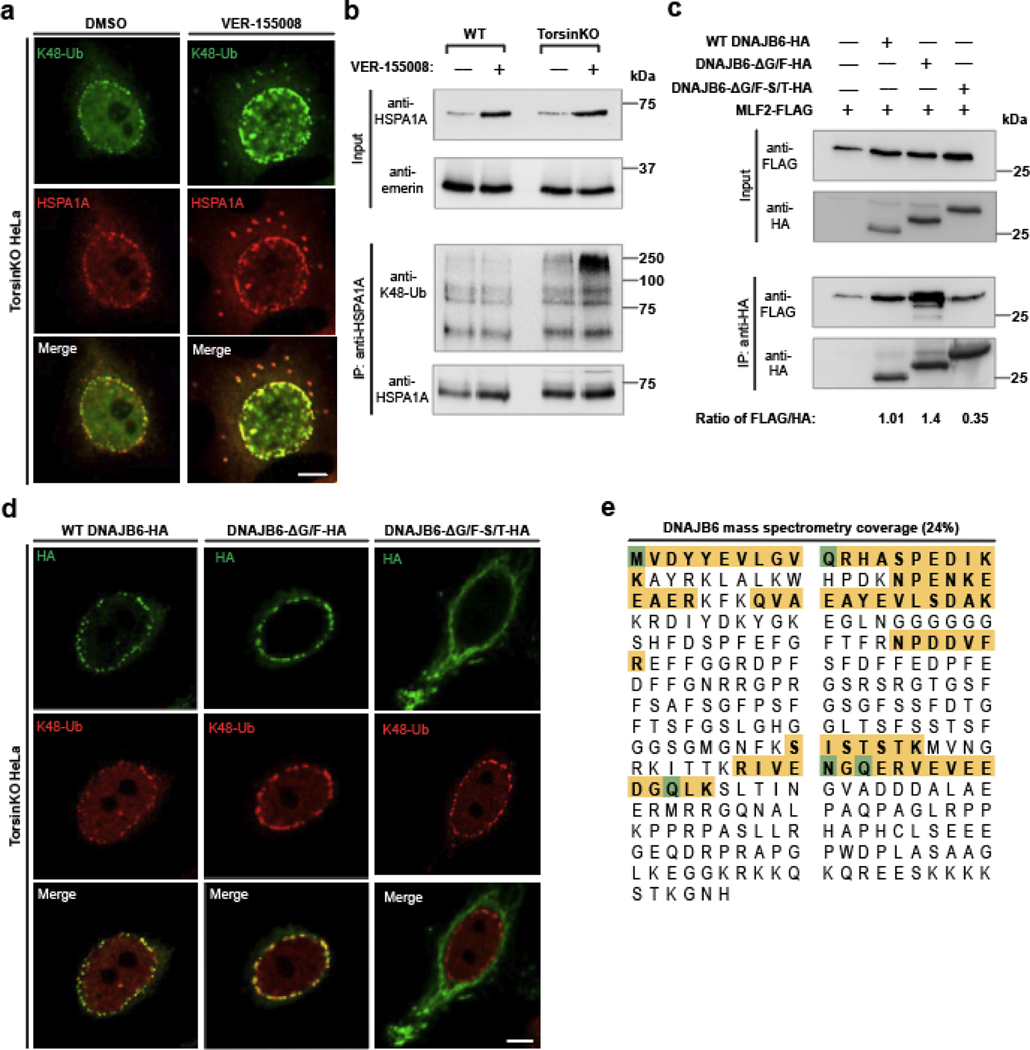
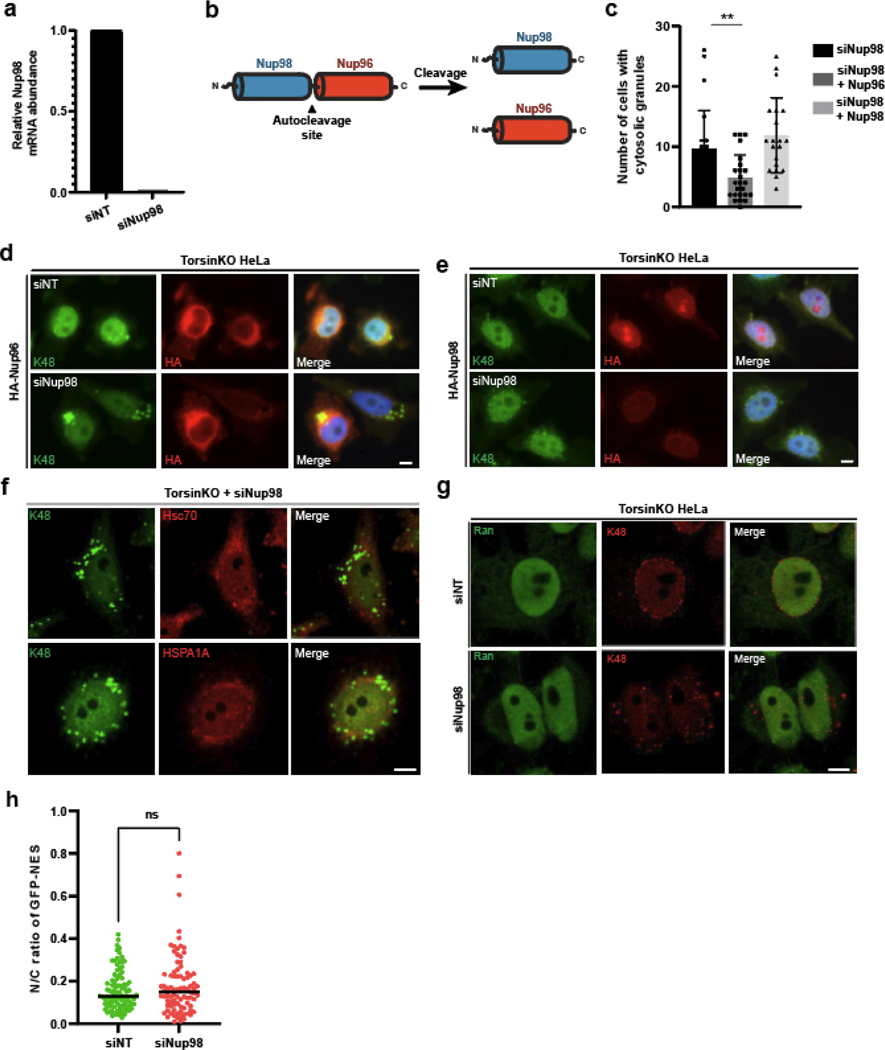
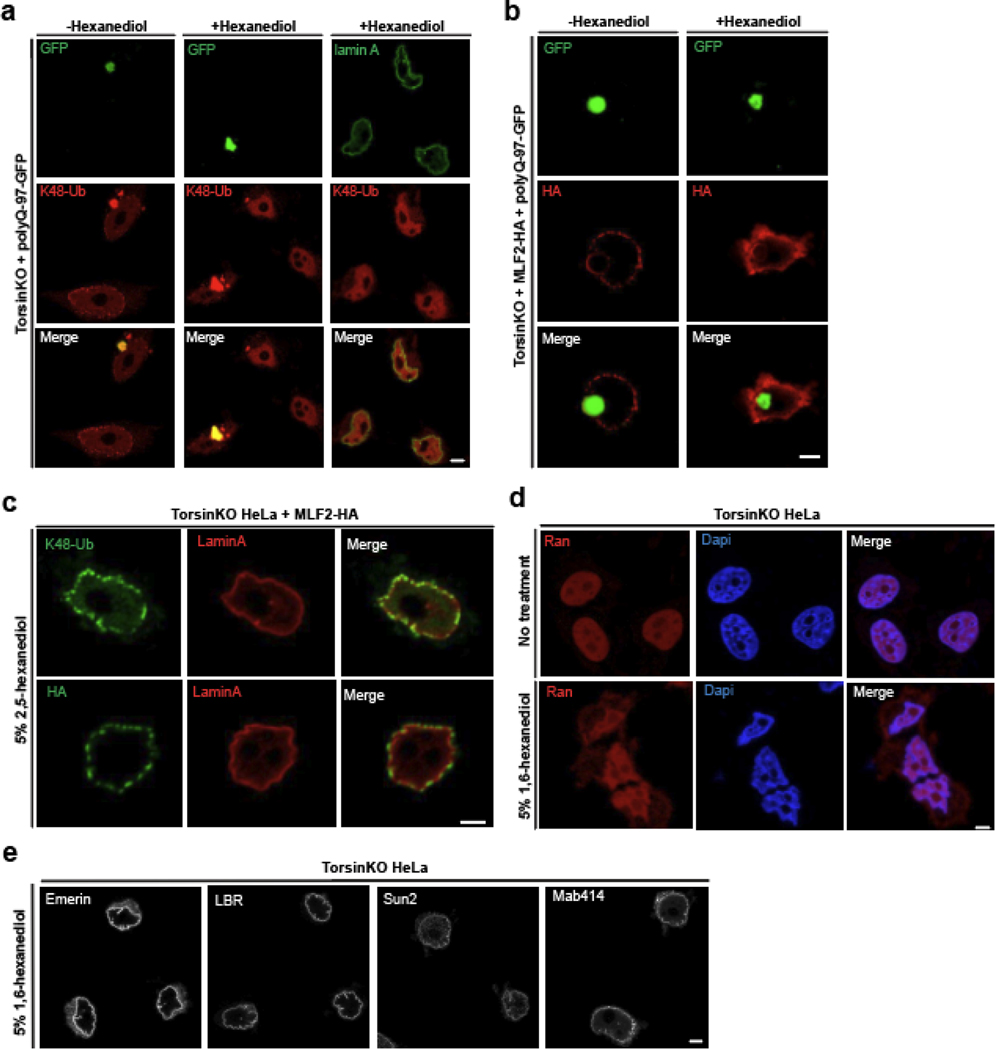
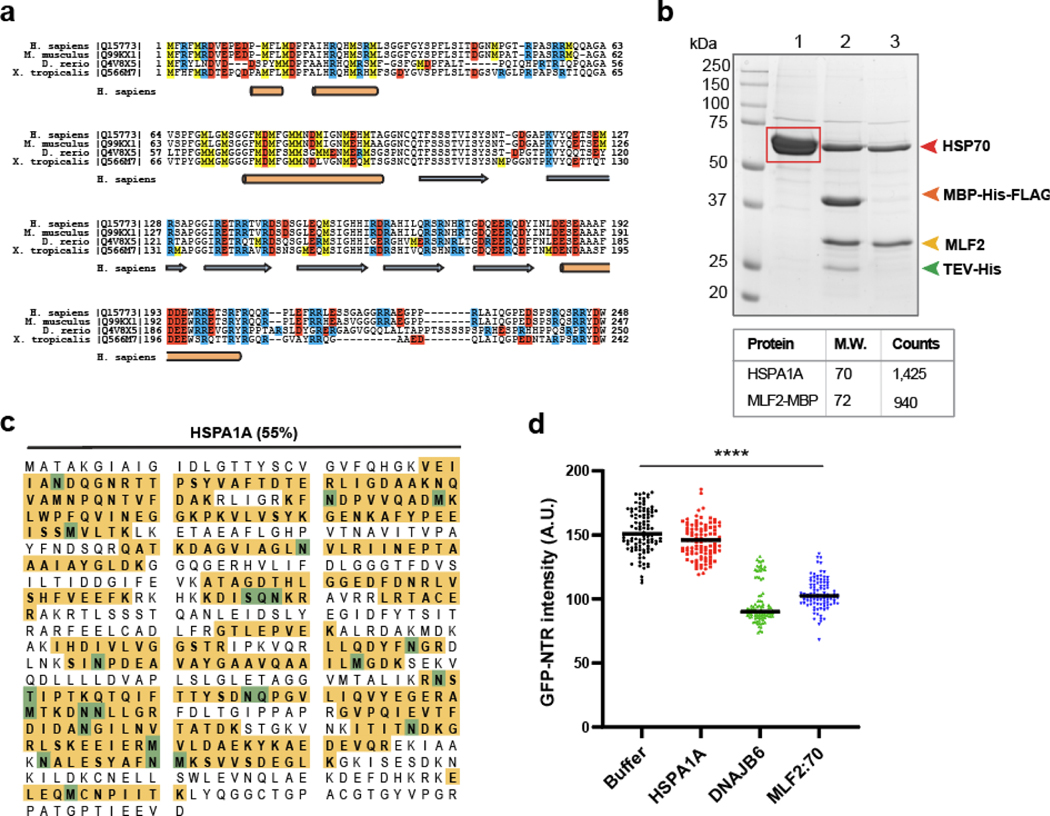
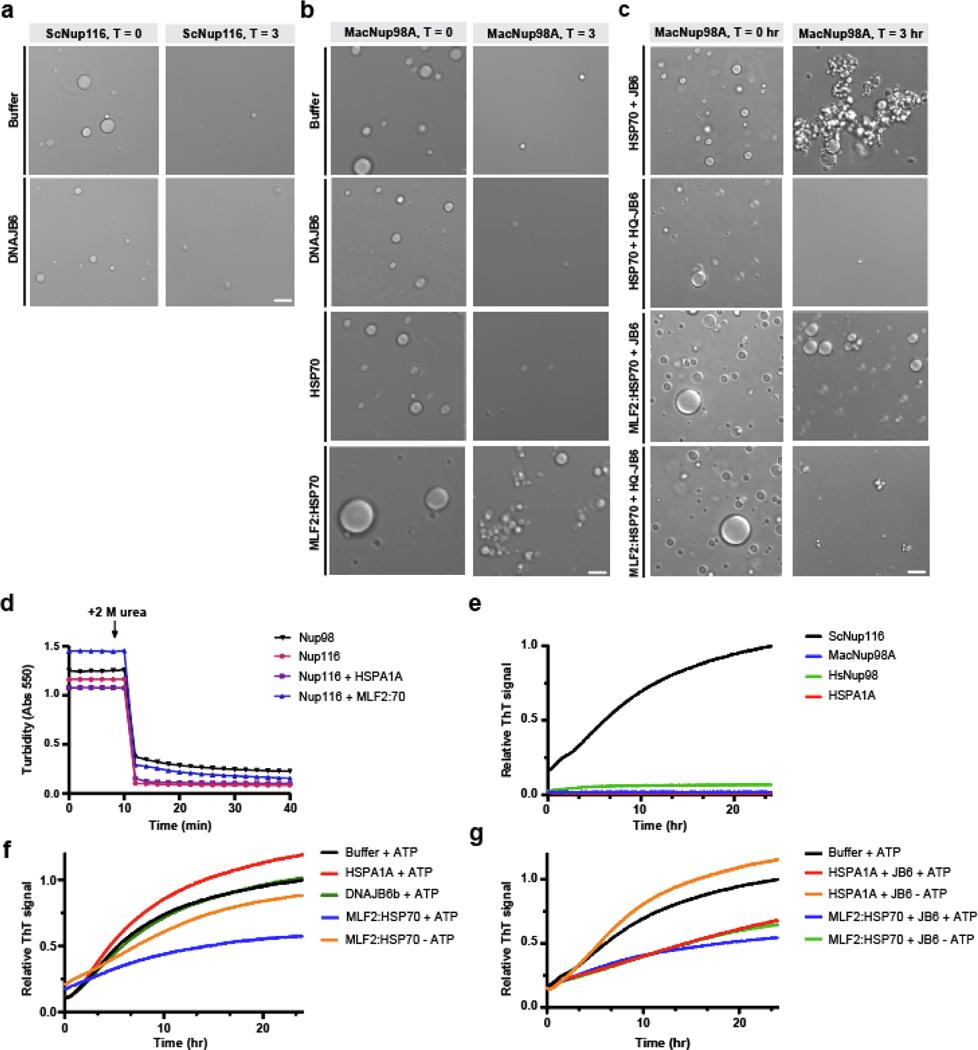
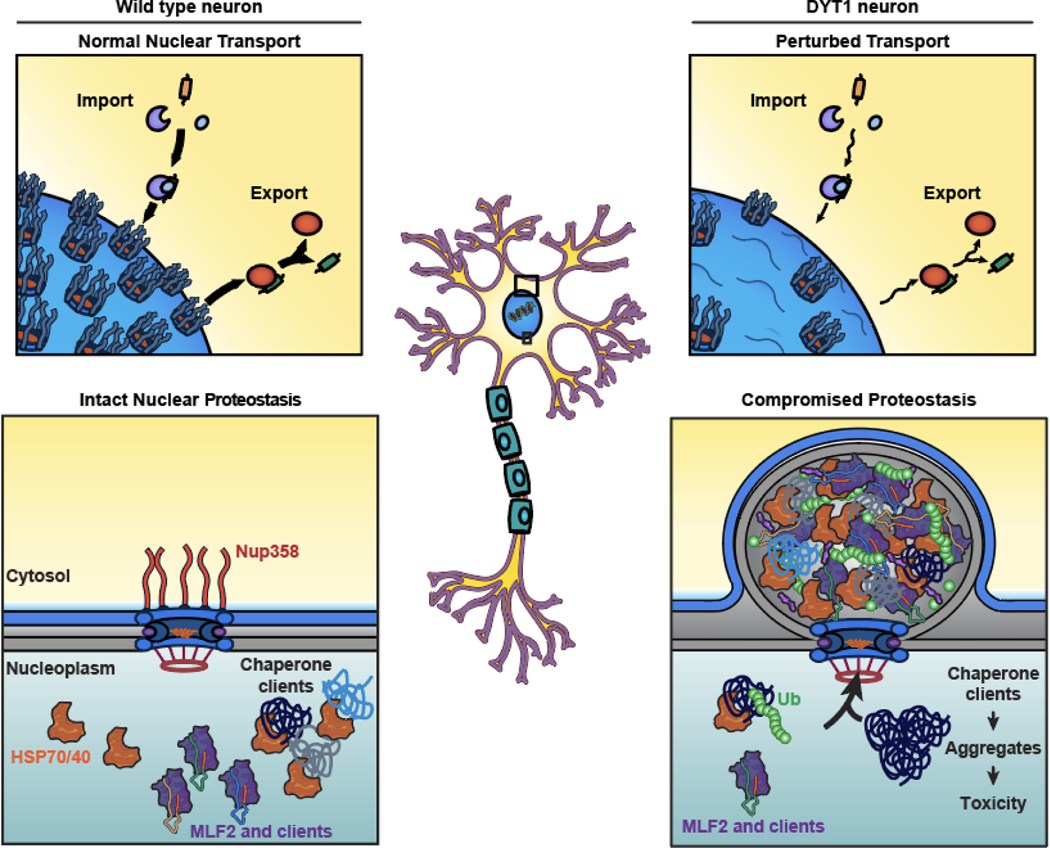
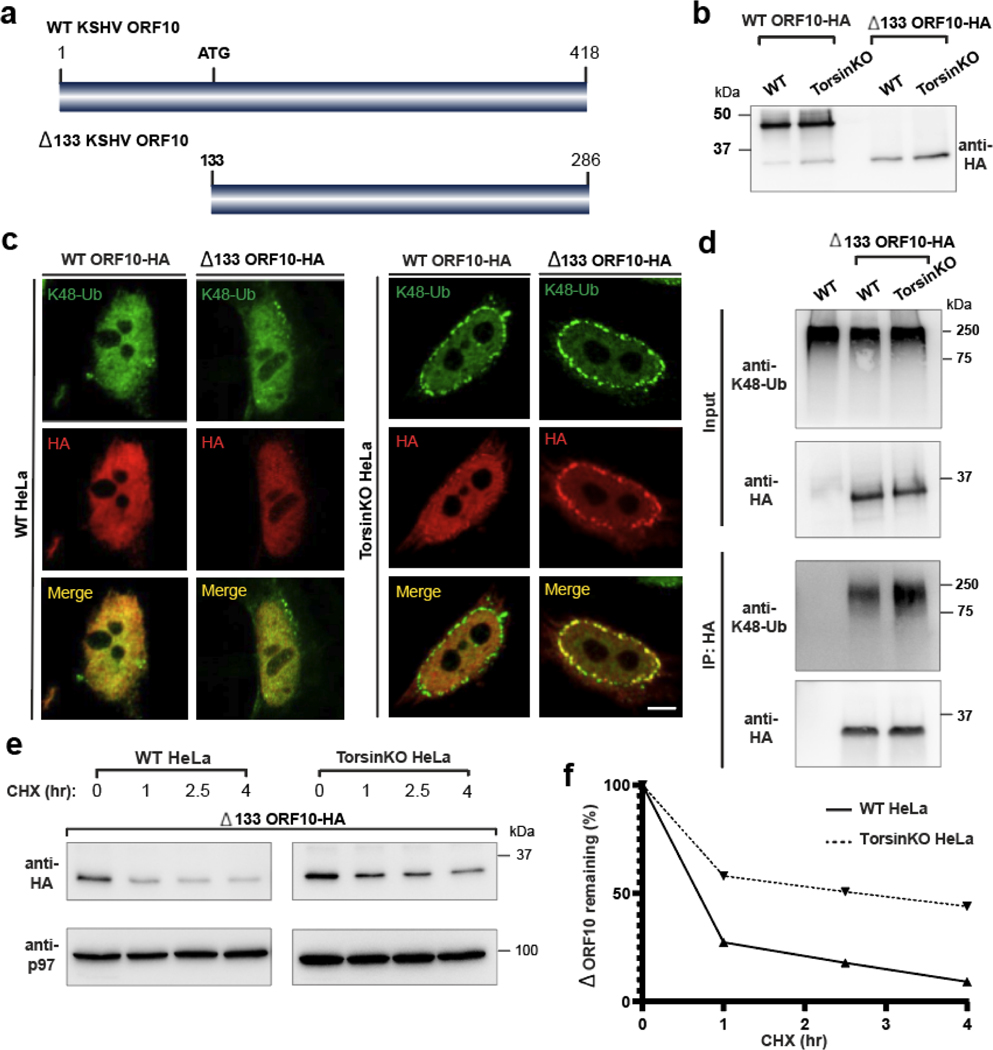
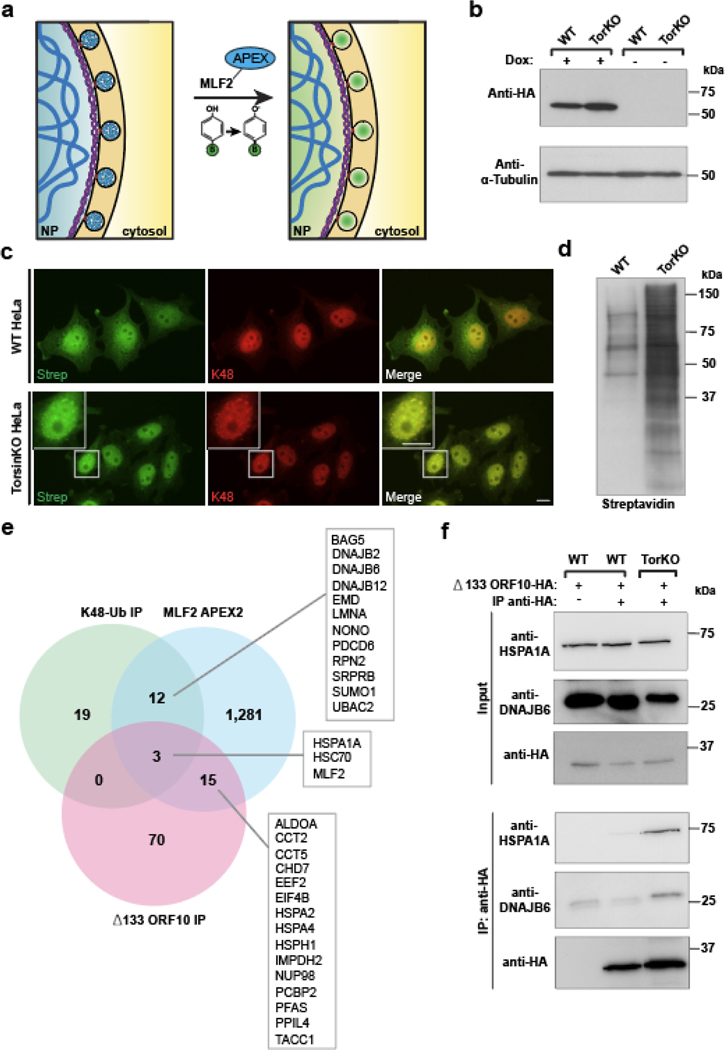
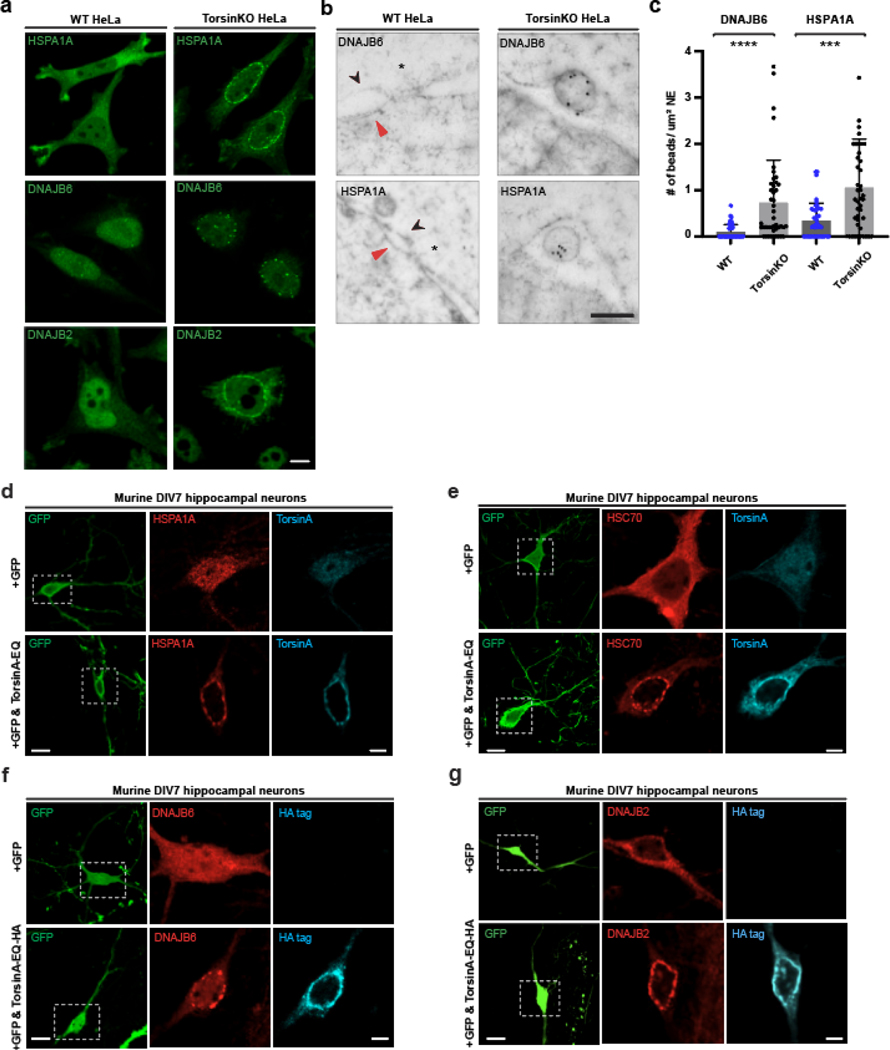
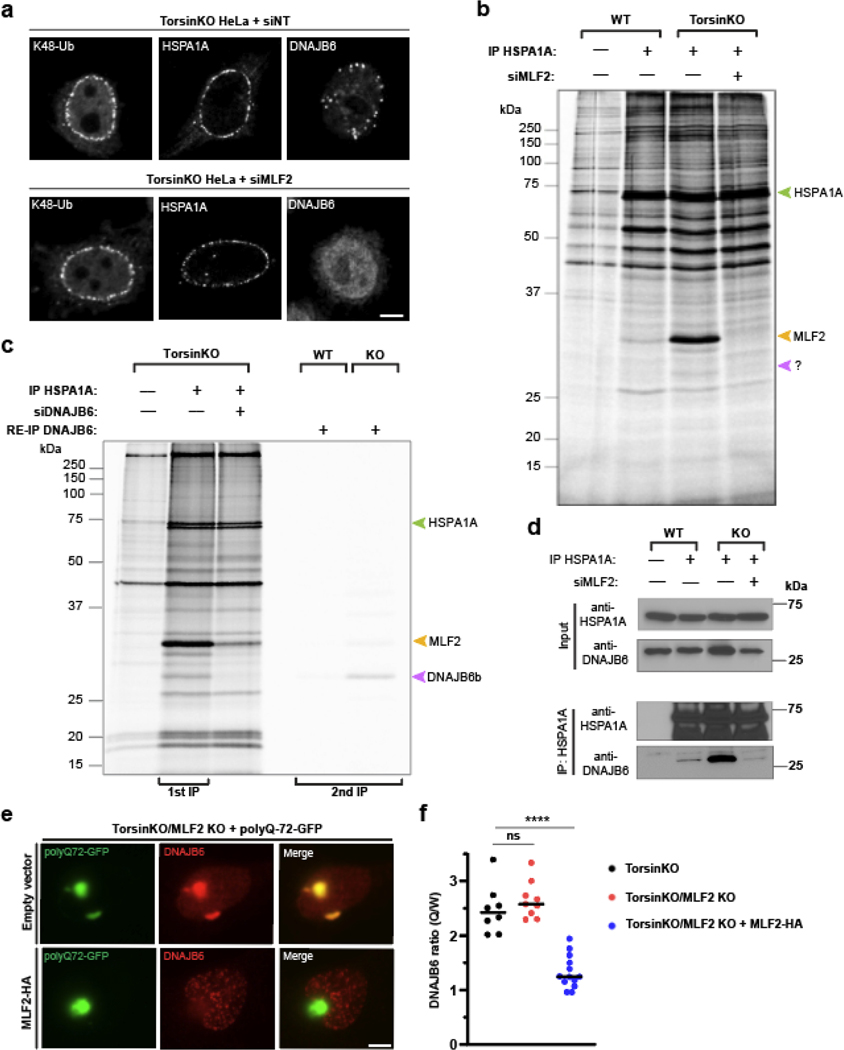
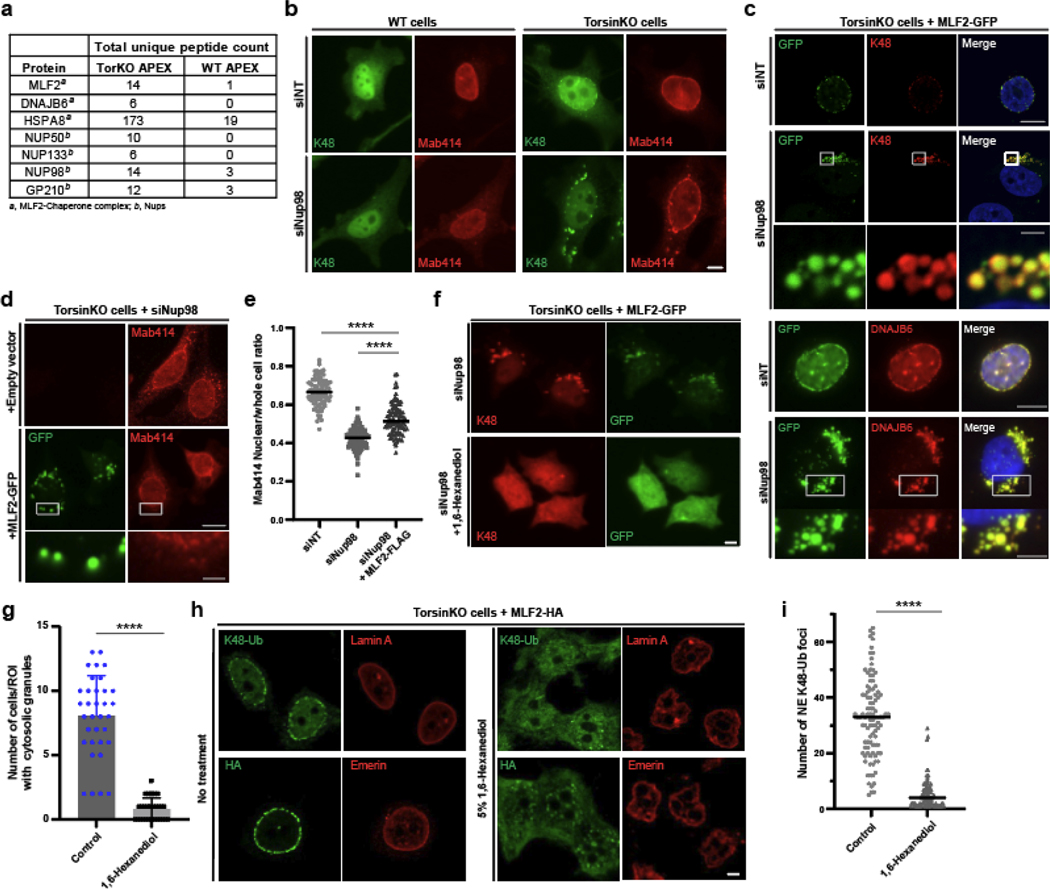
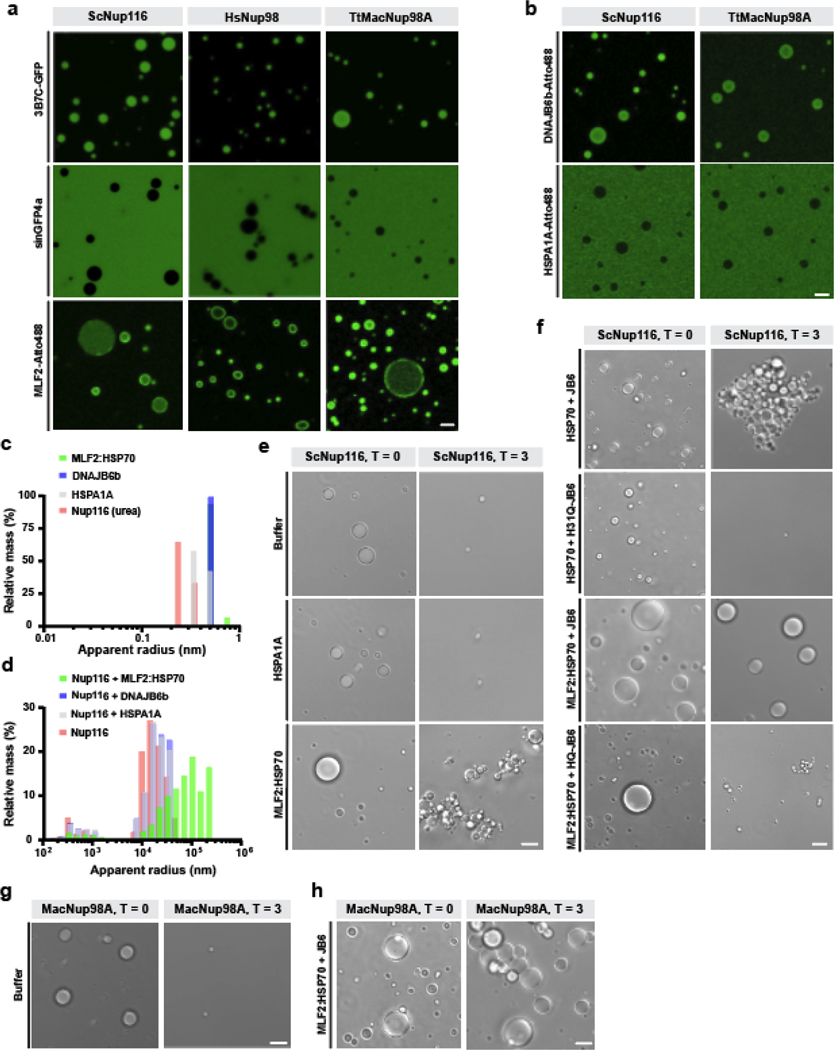
DYT1 dystonia is a debilitating neurological movement disorder arising from mutation in the AAA+ ATPase TorsinA. The hallmark of Torsin dysfunction is nuclear envelope blebbing resulting from defects in nuclear pore complex biogenesis. Whether blebs actively contribute to disease manifestation is unknown. We report that FG-nucleoporins in the bleb lumen form aberrant condensates and contribute to DYT1 dystonia by provoking two proteotoxic insults. Short-lived ubiquitylated proteins that are normally rapidly degraded partition into the bleb lumen and become stabilized. In addition, blebs selectively sequester a specific HSP40-HSP70 chaperone network that is modulated by the bleb component MLF2. MLF2 suppresses the ectopic accumulation of FG-nucleoporins and modulates the selective properties and size of condensates in vitro. Our study identifies dual mechanisms of proteotoxicity in the context of condensate formation and establishes FG-nucleoporin-directed activities for a nuclear chaperone network.


Conflict of interest statement

Competing interests statement

The authors declare no competing interests.

Figures

Extended data 1.
Extended data 1.. NE blebs recruit Δ133 ORF10 in a ubiquitin-dependent manner.
a, Schematic illustration of the NE blebs that form upon Torsin deficiency. In cells with mutant TorsinA, NPC biogenesis is compromised and a subset of nascent NPCs are arrested (ref. [22]). These arrested NPCs form blebs that are enriched for K48-linked ubiquitin (K48-Ub), FG-nucleoporins (FG-Nups), myeloid leukemia factor 2 (MLF2), and a specific chaperone network. The inner nuclear membrane (INM) is depicted in gray, outer nuclear membrane in black. b, Representative IF images of TorsinKO cells expressing MLF2-FLAG and Δ133 ORF10-HA fusion constructs. Δ133 ORF10 was fused to the cytomegalovirus deubiquitinase (DUB) domain, M48 (ref. [75]). M48 is a highly active DUB domain that efficiently removes ubiquitin conjugates (ref. [22, 35]). A C23A mutation renders the DUB domain catalytically inactive (ref. [75]). Scale bar, 5 μm.
Extended data 2.
Extended data 2.. Additional abundant molecular chaperones are sequestered into NE blebs of tissue culture cells and primary mouse neurons.
a, Representative image of endogenous HSC70 in WT and TorsinKO HeLa cells. Note that HSC70 re-localizes from diffusely throughout the cell to nuclear rim foci in TorsinKO cells. b, SH-SY5Y cells expressing a dominant-negative TorsinA construct, TorsinA-EQ-HA, sequester HSPA1A and DNAJB6 into NE blebs. Yellow arrowhead, transfected cell. Blue arrow, untransfected cell. Endogenous chaperones (green) form foci around the nuclear rim upon TorsinA-EQ-HA (red) expression. c, Murine DIV4 hippocampal neurons were transfected with GFP and either MLF2-HA alone or in combination with a dominant-negative TorsinA-EQ construct. Constructs were allowed to express for 72 hours before processing the DIV7 cultures for IF. Note that GFP expression was used to distinguish neurons from other cell types in the heterogeneous primary cell culture. Scale bar, 5 μm.
Extended data 3.
Extended data 3.. Chaperones are recruited to blebs by different mechanisms.
a, Representative IF images of TorsinKO cells treated with DMSO or VER-155008 for 24 hours. VER-155008 is a small molecule inhibitor of HSP70 ATPase activity, which targets the HSP70 ATP binding pocket and approximates an ADP-bound state (ref. [40]). This compound causes elevated HSPA1A expression and more K48-Ub to accumulate in blebs. Scale bar, 5 μm. b, An IP of HSPA1A from biochemically enriched ER/NE fractions from WT or TorsinKO cells treated with DMSO or VER-155008. c, A co-IP of MLF2-FLAG with HA-tagged DNAJB6 constructs lacking functional G/F-rich or S/T-rich regions in TorsinKO cells. ΔG/F indicates all phenylalanine residues have been mutated to alanine within the G/F-rich region, and ΔG/F-S/T indicates the mutation of the phenylalanine residues within the G/F- and S/T-rich regions. Note that DNAJB6-ΔG/F-S/T-HA retrieves significantly less MLF2-FLAG, suggesting that the S/T-rich region strongly promotes its interaction with MLF2 and recruitment to blebs. d, Representative IF images of the DNAJB6 constructs described in panel (c) in TorsinKO cells. Note that interfering with the S/T-rich region, but not the G/F-rich region, prevents DNAJB6 from reaching the bleb. Scale bar, 5 μm. e, DNAJB6 peptides identified by mass spectrometry from an IP of HSPA1A from TorsinKO cells (see figure 4b–d). Peptides identified by mass spectrometry are highlighted in yellow and post-translationally modified residues are rendered in green. While an IP of HSPA1A from TorsinKO cells identified DNAJB6 with 24% coverage, no DNAJB6 peptides were identified in the HSPA1A IP from WT HeLa cells. See Supplemental Table 3 for complete dataset. Unprocessed blots are available in source data.
Extended data 4.
Extended data 4.. Validation of Nup98 knockdown and effect on nuclear transport.
a, qPCR validation of Nup98 depletion upon 48 hours of 50 nM siRNA treatment. Relative Nup98 transcript levels are normalized to RPL32. b, Nup98 and Nup96 are translated as a single precursor protein that undergoes an autocleavage event to produce the two individual proteins (ref. [45]). Thus, RNAi knockdown of Nup98 results in the simultaneous depletion of Nup96. c-e, To distinguish which protein knockdown produces the cytosolic granules in TorsinKO cells, HA-tagged Nup98 or Nup96 was assessed for the ability to rescue the phenotype under knockdown conditions. c, Quantification of the rescue affect when HA-Nup96 or HA-Nup98 are expressed. The presence of cytosolic inclusions was assessed for 300 cells/condition in ≥20 ROIs. Error bar, SD. Statistical analysis was performed using a two-tailed unpaired Mann-Whitney test. ** indicates p = 0.0013. d, Representative IF images of TorsinKO cells expressing HA-Nup96 or HA-Nup98 (e) under nontargeting or siNup98–96 conditions. Results are quantified in panel (c). f, Representative IF images of endogenous Hsc70 and HSPA1A in TorsinKO cells upon Nup98 depletion. Note that these HSP70 members are not recruited to the cytosolic granules. g, Representative IF images of the Ran GTPase in TorsinKO cells under 48 hours of siNT or siNup98 conditions. h, The nuclear to cytoplasmic ratio was calculated for GFP-NES in TorsinKO cells under siNT (n = 94) or siNup98 (n = 87) conditions. The ratio was calculated using CellProfiler software (ref. [73]). Statistical analysis was performed using a two-tailed unpaired Mann-Whitney test. Ns, not significant. Scale bar, 5 μm for all panels. Source numerical data are available in source data.
Extended data 5.
Extended data 5.. The effects of 5% 1,6-hexanediol on NE integrity and bleb sensitivity to 2,5-hexanediol.
a, Representative IF images of TorsinKO cells expressing polyQ-97-GFP under normal IF conditions or exposed to 5% 1,6-hexanediol for five minutes prior to fixation. Note that the K48-Ub inside polyQ aggregates is not dissolved by 1,6-hexanediol but the K48-Ub inside blebs is sensitive to this alcohol. Lamin A staining demonstrates this 5% 1,6-hexanediol treatment does not break down NE membranes (see also panel (e)). b, Representative IF images of TorsinKO cells expressing polyQ-97-GFP and MLF2-HA treated with 5% 1,6-hexanediol for five minutes. A five-minute treatment with 5% 1,6-hexanediol does not dissolve polyQ aggregates but can selectively dissolve the contents of blebs. c, Treatment with the related alcohol 5% w/v 2,5-hexanediol for five minutes does not dissolve the K48-Ub or MLF2-HA sequestered inside blebs. d, Representative IF images of Ran in TorsinKO cells under normal IF conditions or after treatment with 5% 1,6-hexanediol for five minutes. Although the NE membranes are not disassembled by a 5% 1,6-hexanediol, the permeability barrier established by NPCs is lost. 1,6-hexanediol is known to disrupt the hydrophobic contacts required for the cohesion of FG-Nups within the central channel of the NPC (ref. [51]). e, Representative IF images of TorsinKO cells treated with 5% w/v 1,6-hexanediol for five minutes prior to fixation. This treatment does not compromise the integrity of the NE as determined by staining for multiple inner nuclear membrane proteins. Scale bar, 5 μm for all panels.
Extended data 6.
Extended data 6.. MLF2 is a methionine/arginine rich protein and associates with HSPA1A.
a, Multiple sequence alignment of MLF2 homologs from Xenopus tropicalis, Danio rerio, Mus musculus, and Homo sapiens. MLF2 is a methionine- and arginine-rich protein with a high degree of conservation. Methionine residues are highlighted in yellow boxes, arginine in blue, and positively charged residues in red. Orange cylinders indicate alpha helices predicted by AlphaFold [76] and blue arrows represent predicted beta sheets. b, MLF2 purified from Expi293F cells associates with HSPA1A. MLF2 was expressed as a maltose binding protein (MBP) fusion and affinity purified by virtue of FLAG- and His-tags. Lane 1, anti-FLAG resin elution composed of MLF2-Tev-MBP-His-FLAG and associating protein. Red box, gel section analyzed by mass spectrometry. Lane 2, incubation with Tev-His cleaved MBP-His from MLF2. Lane 3, Ni-NTA flowthrough in which MBP-His and Tev-His are removed. Mass spectrometry of the gel segment indicated in lane 1 confirmed the identity of the associating protein as HSPA1A. c, Mass spectrometry analysis of the co-purifying protein from panel (b) revealed 55% coverage of HSPA1A. Identified peptides mapping to HSPA1A are in yellow, post-translationally modified residues in green. See Supplemental Table 4 for complete dataset. d, 10 μM TtMacNup98A condensates were formed in the presence of 5 μM 3B7C-GFP plus 10 μM HSPA1A, DNAJB6Bb, or MLF2:HSP70. 3B7C-GFP signal intensity was measured in the center of 100 condensates/condition. Bars over datapoints indicate the mean intensity value. Statistical analysis was performed using a two-tailed unpaired Mann-Whitney test comparing buffer or HSPA1A conditions to DNAJB6b or MLF2:HSP70. **** indicates p < 0.0001. Source numerical data and unprocessed blots are available in source data.
Extended data 7.
Extended data 7.. MLF2 in complex with HSP70 and DNAJB6 preserves FG-rich condensate integrity over time.
a, Phase contrast images of 10 μM ScNup116 condensates formed in the presence of 2.5 μM DNAJB6b. Images were taken immediately after condensate formation (T = 0) or after three hours of incubation at 30ºC (T = 3) in the presence of ATP. Note the buffer condition is also shown in Fig. 6e. b, Phase contrast images of 10 μM TtMacNup98A condensates formed in the presence of 2.5 μM DNAJB6b, 5 μM HSPA1A, or 5 μM MLF2:HSP70. Images were taken at the timepoints described in panel (a). c, Images of 10 μM TtMacNup98A condensates formed in the presence of 5 μM HSPA1A plus 2.5 μM of the indicated DNAJB6b construct or 5 μM of the MLF2:HSP70 complex with 2.5 μM H31Q-DNAJB6b. Images were taken at the timepoints described in panel (a). Note the buffer condition is also shown in Fig. 6g. d, The turbidity of 10 μM ScNup116 or HsNup98 solutions in the absence or presence of 5 μM HSPA1A or the MLF2:HSP70 complex. Upon addition of 2 M urea, the condensates fully reverse and the solution loses turbidity as assessed by monitoring absorbance at 550 nm. e, 10 μM of ScNup116, TtMacNup98A, HsNup98, or 5 μM HSPA1A was incubated with 5 μM Thioflavin T (ThT) for 24 hours at 30ºC. ThT fluorescence (excitation 440 nm, emission 480 nm) was monitored to detect amyloid formation. All reactions contained 2 mM ATP and an ATP regenerating system. ThT signals for all conditions were normalized to the ScNup116 maximum value. f, 10 μM of ScNup116 was monitored for amyloid formation as described above in buffer containing 5 μM HSPA1A, 2.5 μM DNAJB6b, or 5 μM of the MLF2:HSP70 complex. Where indicated, 2 mM ATP was included or omitted. g, ScNup116 amyloid formation was observed under conditions with 5 μM HSP70 or the MLF2:HSP70 complex plus 2.5 μM DNAJB6b. Where indicated, 2 mM ATP was included or omitted. ThT conditions were as described for panel (e). Scale bar 5 μM for all panels. Source numerical data are available in source data.
Extended data 8.
Extended data 8.. A dual proteotoxicity mechanism contributes to DYT1 Dystonia onset.
Schematic model for how proteotoxicity may accumulate in Torsin-deficient cells. In wild type neurons, NPC biogenesis is unperturbed and chaperones are free to interact with clients. In DYT1 dystonia neurons, nuclear transport is perturbed due to defective NPC biogenesis. As FG-Nup containing blebs form instead of mature NPCs, they sequester proteins normally destined for degradation, chaperones, and MLF2. When essential chaperones are sequestered away from clients in Torsin-deficient cells, proteotoxic species may be allowed to form and persist to a greater extent than in cells with normal chaperone availability, sensitizing cellular proteostasis towards additional insults.
Figure 1.
Figure 1.. NE herniations arising from Torsin ATPase deficiency sequester and stabilize short-lived protein.
a, Schematic model of the ORF10 protein from KSHV. KSHV ORF10 contains an internal start codon at residue 133 that produces Δ133 ORF10. b, Immunoblot demonstrating expression of Δ133 ORF10-HA in WT and TorsinKO HeLa cells 24 hours post transfection. Note that ORF10-HA is produced as a major full-length protein a lower abundance Δ133 product. c, Representative IF images of full length and Δ133 ORF10-HA in WT and TorsinKO cells. Scale bar, 5 μm. d, Anti-HA immunoprecipitation (IP) from WT or TorsinKO cells expressing Δ133 ORF10-HA. The IP was probed with antibodies against K48-Ub and HA. Note that Δ133 ORF10-HA is associated with more K48-Ub in TorsinKO than WT cells. e, A cycloheximide (CHX) chase over four hours in WT and TorsinKO cells expressing Δ133 ORF10-HA. Cells were treated with 100 μg/mL of CHX at 37°C for the indicated timepoints. p97 serves as a loading control. f, Relative percentage of Δ133 ORF10-HA obtained in (e) was determined via densitometry by comparing to the abundance at time = 0. All data were standardized to p97 levels. Source numerical data and unprocessed blots are available in source data.
Figure 2.
Figure 2.. A comparative proteomics approach reveals NE blebs in Torsin-deficient cells are enriched for a highly specific chaperone network.
a, A schematic illustration of the APEX2 reaction strategy to identify bleb protein contents. Left panel, the MLF2-APEX2-HA fusion protein (blue) localizes within the bleb lumen. Right panel, after incubation with 500 μM of biotin-phenol, cells were treated with 1 mM H2O2. Upon exposure to H2O2, APEX2 oxidizes biotin phenol to form highly reactive biotin radicals that covalently label protein within a ~20 nm radius (ref. [74]) (green cloud). NP, nucleoplasm. b, The expression of MLF2-APEX2-HA was engineered in WT and TorsinKO cells to be under doxycycline (Dox) induction. Cells were treated with Dox for 24 hours before immunoblotting. c, Representative IF images of WT and TorsinKO cells after the APEX2 reaction. Note the enrichment of biotin conjugates in blebs of TorsinKO cells compared to the diffuse nuclear signal in WT cells. Strep (green) indicates fluorescently conjugated streptavidin signal and K48-Ub (red) indicate NE blebs. Scale bar, 10 μm. d, Immunoblot of biochemically enriched NE fractions from WT and TorsinKO cells after the MLF2-APEX2 reaction as described in (c). e, Candidate proteins potentially enriched in blebs were identified by mass spectrometry (MS). These were defined as proteins with spectral counts ≥1.5-fold enriched in APEX2 reactions carried out in TorsinKO cells compared to WT. The number of candidates identified for each of the three MS datasets are displayed as numbers within the Venn diagram. Hits overlapping between datasets are listed in alphabetical order. See Supplemental Tables 1,2 for complete datasets. f, To validate MS findings, the stable interaction between Δ133 ORF10-HA and HSPA1A or DNAJB6 was interrogated by co-IP. These interactions are unique to TorsinKO cells, consistent with the findings by comparative MS in panel (e). Unprocessed blots are available in source data.
Figure 3.
Figure 3.. Highly abundant molecular chaperones are sequestered into NE blebs of tissue culture cells and primary mouse neurons with compromised TorsinA function.
a, Antibodies against endogenous HSPA1A, DNAJB6, and DNAJB2 (green) reveal that chaperones from the HSP70 and HSP40 families become tightly sequestered into NE blebs upon Torsin deficiency. Scale bar, 5 μm. b, EM ultrastructure of the NE from WT or TorsinKO cells labeled with immunogold beads conjugated to anti-DNAJB6 (top) or anti-HSPA1A (bottom). Black arrowhead, outer nuclear membrane. Red arrowhead, inner nuclear membrane. Asterisk, NPC. Scale bar, 250 nm. c, The number of DNAJB6 or HSPA1A immunogold beads per μm2 centered around the NE (DNAJB6, WT n=50 micrographs, TorsinKO n=43 micrographs. HSPA1A, WT n=45 micrographs, TorsinKO n=43 micrographs. 400 μm2 of NE was quantified/condition). Error bars, SD. Statistical analyses were performed using a two-tailed unpaired Mann-Whitney test where **** indicates p < 0.0001 and *** p = 0.0002. d-g, Murine DIV4 hippocampal neurons were transfected with GFP and empty vector (top row of all panels) or a dominant-negative TorsinA-EQ construct (bottom row of all panels). Constructs were allowed to express for 72 hours before processing the DIV7 cultures for IF. GFP expression was used to distinguish neurons from other cell types in the heterogeneous primary cell culture. Localization of the chaperones shown in panels (d-g) was probed using antibodies against the indicated endogenous chaperone (red). Untagged TorsinA-EQ was transfected in panels (d) and (e) and detected with a TorsinA antibody (cyan). TorsinA-EQ-HA was transfected in panels (f) and (g) and detected with an anti-HA antibody (cyan). Scale bar, 20 μm for unmagnified images, 5 μm for magnified images. Source numerical data are available in source data.
Figure 4.
Figure 4.. MLF2 is required for DNAJB6 to localize to NE blebs in Torsin-deficient cells.
a, Representative IF images of chaperone localization upon knocking down MLF2 for 48 hours. Scale bar, 5 μm. b, WT and TorsinKO cells were metabolically labeled overnight with 150 μCi/mL 35S-Cys/Met and treated with a nontargeting or MLF2-targetting siRNA for 48 hours. HSPA1A was immunoprecipitated and stably associated proteins were detected by autoradiography. Green arrowhead, HSPA1A. Yellow arrowhead, MLF2. Purple arrowhead, unknown protein. c, Lanes 1–3, metabolically labeled TorsinKO cells were treated with a nontargeting or siRNA targeting DNAJB6 for 48 hours. HSPA1A was immunoprecipitated and co-eluting proteins were visualized by autoradiography. Lanes 4–5, metabolically labeled WT or TorsinKO cells under nontargeting siRNA were subjected to an HSPA1A IP, then disassociated and subjected to a second IP against DNAJB6 (RE-IP). d, HSPA1A was immunoprecipitated from TorsinKO and WT HeLa cells under siNT or siMLF2 conditions. e, A “tug of war” IF experiment showing that overexpression of MLF2-HA in TorsinKO/MLF2 KO cells titrates DNAJB6 out of polyQ72-GFP aggregates and into blebs. Representative IF images of TorsinKO/MLF2KO cells transfected with polyQ72-GFP alone (left column) or in combination with MLF2-HA (right column). Note that the HA channel is not shown. Scale bar, 5 μm. f, The ratio of DNAJB6 fluorescence signal inside polyQ72-GFP foci (Q) compared to whole cell (W) was calculated for at least eight cells/condition. Bars over datapoints indicate the mean ratio. Statistical analysis was performed using a two-tailed unpaired Mann-Whitney test where **** indicates p < 0.0001. ns, not significant. Source numerical data and unprocessed blots are available in source data.
Figure 5.
Figure 5.. Nup98 is required for the sequestration into NE blebs harboring condensates composed of K48-Ub, FG-nucleoporins, MLF2, and chaperones.
a, The APEX2 MS strategy described in (figure 2a) reveals an enrichment of chaperones and nucleoporins interacting with MLF2 in TorsinKO cells. b, Representative IF images of WT and TorsinKO cells under siNup98 conditions. In TorsinKO cells, cytosolic granules enriched for K48-Ub and FG-Nups (Mab414, red) form upon siNup98. Note the normal NE accumulation of K48-Ub in TorsinKO cells is abolished under siNup98. Scale bar, 5 μm. c, Representative IF images of TorsinKO cells expressing MLF2-GFP under siNup98 conditions. MLF2-GFP (top panels) localizes to the cytosolic granules containing K48-Ub that arise upon Nup98 depletion in TorsinKO cells. DNAJB6 (bottom panels) is also recruited to the cytosolic granules. 1x images scale bar, 10 μm. 8x magnification scale bar, 1.25 μm. d, Representative IF images of the effect on the FG-Nup accumulation in cytosolic granules upon overexpression of MLF2-GFP under siNup98 conditions. 1x images scale bar, 10 μm. 8x magnification scale bar, 1.25 μm. e, The ratio of nuclear to whole cell nucleoporin (Mab414) signal was determined for 94 cells/condition. Bars over datapoints indicate the mean ratio. Expressing MLF2-FLAG significantly decreases the amount of cytosolic FG-Nup mislocalization upon siNup98. f, Representative IF images of TorsinKO cells expressing MLF2-GFP under siNup98 conditions in the absence or presence of 5% 1,6-hexanediol for five minutes. Scale bar, 5 μm. g, The presence of cytosolic K48-Ub granules upon Nup98 depletion was assessed for 300 cells/condition (≥35 regions of interest (ROI) quantified/condition). Error bar, SD. h, Representative IF images of TorsinKO cells expressing MLF2-HA in the absence (left columns) or presence (right columns) of 5% 1,6-hexanediol for five minutes. The intact NE is indicated by laminA (top panels) and emerin (bottom panels). Scale bar, 5 μm. i, The number of K48-Ub foci around the NE rim was determined for 100 cells/condition. Bars over datapoints indicate the mean number of K48-Ub foci. For all panels, statistical analyses were performed using a two-tailed unpaired Mann-Whitney test. **** indicates p < 0.0001. Source numerical data are available in source data.
Figure 6.
Figure 6.. MLF2 interacts with FG-rich phases and preserves condensate integrity over time with HSP70 and DNAJB6.
a, Atto488-tagged MLF2 interacts with phylogenetically diverse FG-Nups. Purified, label-free ScNup116, HsNup98, or TtMacNup98A FG-domains were diluted from 500 μM stocks in 2 M urea to 10 μM in tris-buffered saline (TBS) to form condensates. Condensates were formed at room temperature in TBS containing 5 μM 3B7C-GFP, sinGFP4a, or MLF2-Atto488. b, HSPA1A-Atto488 is excluded from ScNup116 and TtMacNup98A condensates while DNAJB6b-Atto488 readily immerses into FG-rich phases. c, Solutions of 5 μM MLF2:HSP70, DNAJB6b, HSPA1A, or urea-denatured ScNup116 were analyzed by dynamic light scattering (DLS). Datasets of 100 reads with five-second acquisition times were collected for each condition. d, Solutions of 10 μM ScNup116 were formed in TBS with no additional protein (pink), 5 μM DNAJB6b (blue), 5 μM HSPA1A (grey), or 5 μM MLF2:HSP70 (green). Condensate size distributions were analyzed by DLS as described above. e, Phase contrast images of 10 μM ScNup116 condensates formed in the presence of 5 μM HSPA1A or 5 μM MLF2:HSP70. Images were taken immediately after condensates formation (T = 0) or after three hours of incubation at 30ºC (T = 3) in the presence of ATP. Note that the buffer condition is also shown in Extended Data Fig. 7a. f, Phase contrast images of 10 μM ScNup116 condensates formed in the presence of 5 μM HSPA1A or 5 μM of MLF2:HSP70 and 2.5 μM DNAJB6b constructs. Note the H31Q-DNAJB6b mutant cannot interact with HSP70. Images were taken at timepoints described in panel (e). g, Phase contrast images of 10 μM ThMacNup98A condensates immediately following formation or after three hours of incubation as described above. Note that the buffer condition is also shown in Extended Data Fig. 7b. h, Images of 10 μM ThMacNup98A condensates formed in the presence of 5 μM MLF2:HSP70 and 2.5 μM DNAJB6b at the zero timepoint or after three hours of incubation. Note that this condition is also shown in Extended Data Fig. 7c. Scale bar, 5 μm for all panels. Source numerical data are available in source data.

Comment in

References

    1. Khan YA, White KI, and Brunger AT, The AAA+ superfamily: a review of the structural and mechanistic principles of these molecular machines. Crit Rev Biochem Mol Biol, 2021: p. 1–32. - PubMed
    1. Rose AE, Brown RS, and Schlieker C, Torsins: not your typical AAA+ ATPases. Crit Rev Biochem Mol Biol, 2015. 50(6): p. 532–49. - PMC - PubMed
    1. Goodchild RE, Kim CE, and Dauer WT, Loss of the dystonia-associated protein torsinA selectively disrupts the neuronal nuclear envelope. Neuron, 2005. 48(6): p. 923–32. - PubMed
    1. Zhao C, et al., Regulation of Torsin ATPases by LAP1 and LULL1. Proc Natl Acad Sci U S A, 2013. 110(17): p. E1545–54. - PMC - PubMed
    1. Demircioglu FE, et al., Structures of TorsinA and its disease-mutant complexed with an activator reveal the molecular basis for primary dystonia. Elife, 2016. 5. - PMC - PubMed

Publication types

MeSH terms

Substances

Supplementary concepts