. 2023 Apr;41(4):541-551.
doi: 10.1038/s41587-022-01504-x. Epub 2022 Oct 27.

Targeting MYC with modular synthetic transcriptional repressors derived from bHLH DNA-binding domains

Affiliations

Targeting MYC with modular synthetic transcriptional repressors derived from bHLH DNA-binding domains

Thomas E Speltz et al. Nat Biotechnol. 2023 Apr.

Abstract

Despite unequivocal roles in disease, transcription factors (TFs) remain largely untapped as pharmacologic targets due to the challenges in targeting protein-protein and protein-DNA interactions. Here we report a chemical strategy to generate modular synthetic transcriptional repressors (STRs) derived from the bHLH domain of MAX. Our synthetic approach yields chemically stabilized tertiary domain mimetics that cooperatively bind the MYC/MAX consensus E-box motif with nanomolar affinity, exhibit specificity that is equivalent to or beyond that of full-length TFs and directly compete with MYC/MAX protein for DNA binding. A lead STR directly inhibits MYC binding in cells, downregulates MYC-dependent expression programs at the proteome level and inhibits MYC-dependent cell proliferation. Co-crystallization and structure determination of a STR:E-box DNA complex confirms retention of DNA recognition in a near identical manner as full-length bHLH TFs. We additionally demonstrate structure-blind design of STRs derived from alternative bHLH-TFs, confirming that STRs can be used to develop highly specific mimetics of TFs targeting other gene regulatory elements.


Conflict of interest statement

Competing interests

T.E.S., X.S. and R.E.M. are named inventors on patent applications related to this work. The remaining authors declare no competing interests.

Figures
Extended Data Fig. 1 |
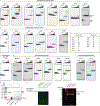
Extended Data Fig. 1 |. Optimization of synthetic transcriptional repressors.
a-e, Representative EMSA gels for compounds in this study. Titrations of compounds consist of 3-fold serial dilutions stating from 2 μM or 200 nM. The symbol (−) indicates a control well with no STR. EMSAs were performed as described in methods. The binding curves for the Kd values listed are shown in Figs. 2b,c. g, Ni-NTA resin pulldown gel for expressed his-tagged bHLH domains of MYC and MAX association in the presence of STR116. h, Uncropped version of gel shown in Fig. 4. i, Uncropped version of gel shown in Extended Data Fig. 4 f. Red channel shows CCNB. Green channel shows c-MYC, LDHA, and actin loading control.
Extended Data Fig. 2 |
Extended Data Fig. 2 |. STR affinity and specificity to E-Box DNA matches that of MYC and MAX protein.
a, Binding curves from EMSA experiments for dual-stabilized MAX-STRs used in this study. Data shown represent mean and s.d. from n = 3 independent replicates. Apparent Kd values represent mean and 95% C.I. from n = 3 independent replicates. b, Representative EMSA gels for recombinant MYC:MAX and MAX:MAX and associated binding curves. Kdapp values are from n = 3 independent replicates. c, Representative EMSA gels for DNA binding specificity experiments in the presence of increasing doses of unlabeled competitor oligos and associated plots of relative bound fraction determined by quantified band intensities. d, e, Representative EMSA gels for STR/protein competition experiments and associated competition curves. The indicated concentration of STR was incubated with 15 nM MYC:MAX (d) or 15 nM MAX:MAX (e) and 0.5 nM Ebox-IRD probe. The relative protein-bound E-Box DNA was quantified from n = 3 (e) or n = 2 (d) replicates and plotted to determine IC50 values. Data shown represent mean and s.d.
Extended Data Fig. 3 |
Extended Data Fig. 3 |. Hydrocarbon stapling promotes enhanced stability and cellular uptake.
a, Circular dichroism spectra for STR118 was measured at 25 °C (blue). The sample was heated to 95 °C for 5 min, cooled back down to 25 °C and the circular dichroism spectra of the same sample was obtained a second time (red). b, LCMS quantification of major fragments observed upon exposure of B-Z to trypsin. The area under the curve for extracted ion chromatograms of B-Z and indicated fragments was measured using a window of m/z ± 1. The plot shows the ratio of the area under the curve for each extracted ion chromatogram relative to the area under the curve for the extracted ion chromatogram of B-Z at time = 0 s. c, Representative EMSA gels from conditioned media stability assay. The assay was performed as described in methods. The images show 3 replicates for each STR. The experiment was repeated 3 times with similar results. d, e, Membrane integrity and viability of HeLa cells treated with FITC conjugated STR. d, Analysis of LDH release after 1-hour treatment of HeLa cells with 5 μM STR, vehicle (DMSO) or SDS lysis buffer. e, Cell-Titer-Glow viability analysis of HeLa cells treated with 5 μM STR or vehicle (DMSO) for 24 hours. Experiments were performed as described in methods. Data represent mean and s.d. of (n = 5, LDH) or (n = 2, CTG) biological replicates. Statistical analyses are by unpaired, two-sided t test. ns: not significant.
Extended Data Fig. 4 |
Extended Data Fig. 4 |. P-BioSTR118 photocrosslinks to E-Box DNA and occupies genomic DNA.
a, The chemical structure of P-BioSTR118. b, Representative EMSA gel and binding curve for P-BioSTR118 show high affinity binding for E-Box oligo. c, Denatured SDS-PAGE gel shows higher molecular weight E-Box oligo adducts are only formed upon exposure to UV at 365 nm. d, ChIP-qPCR quantification of endogenous MYC occupancy at control and E-box-containing target genes in HeLa cells. e, Photo-ChIP-qPCR quantification of P-BioSTR118 occupancy at control and E-box-containing target genes in P493–6 cells treated with 10 μM STR for 24 hr. ChIP-qPCR data represent the mean and s.e.m. of n = 2 (d) and n = 3 (e) independent biological replicates. Statistical analyses are by unpaired, two-sided t test.
Extended Data Fig. 5 |
Extended Data Fig. 5 |. STRs alter the proteome and reduce proliferation of MYC-dependent cell lines.
a, Venn diagram depicting total number of shared and unique peptides analyzed between STR116 and tetracycline treated P493–6 cells. b, Bar graph of the average median change in expression of indicated number of proteins analyzed for individual datasets. c, DAVID-GO analyses indicating clusters of relevant upregulated (c, red, top) and downregulated (d, blue, bottom) proteins shared between STR116 and tetracycline treated P493–6 cells. P-values for SILAC ratios were calculated using a background-based t-test. e, Firefly luciferase activity in HCT116 E-box reporter cells measured after STR treatment (20 μM for 24 hr). Data shown represent mean and s.d. of n = 3 independent biological replicates. Statistical analyses are by unpaired, two-sided t test. f, Representative western blot analysis of P493–6 cells after 48 hr treatment with indicated combinations of vehicle (‘MYC-ON’), tetracycline (‘MYC-OFF’) and 20 μM STR116 or STR118. g, Viability of P493–6 cells treated with STR116 under conditions of low (left, ‘MYC-OFF’) or high MYC expression (right, ‘MYC-ON’) after 72 hr. h, i, Relative viability of Ramos (h) or Jurkat (i) cells treated with STR116 after 72 hr. Viability plots show mean and s.d. for n = 3 independent biological replicates.
Extended Data Fig. 6 |
Extended Data Fig. 6 |. Analysis of B-Z:E-Box crystal structure.
a, Electron density map (top, s = 2.0), overlay of resolved structure onto density map (middle) and cartoon representation for unit cell of crystal structure (bottom). b, DNA overhang contact between neighboring DNA duplexes (top). Contacts between thymine and adenine on oligos from adjacent complexes (bottom). c-e, Hydrophobic core formed between residues from B-Z homodimer include bPhe43, bLeu46, zLeu64 and zAla67. Additional interacting residues between B-Z homodimers include bIle39 and zArg60 near DNA binding interface and zTyr70, zLys66, bPro51, and bVal50 near the c-terminus of the basic helix. f, Cartoon representation of Max homodimer (monomer 1 blue, monomer 2 pink, PDB: 1HLO) bound to DNA (left), B-Z homodimer (monomer 1 yellow with chemical crosslink green, monomer 2 orange) bound to DNA (right) and overlay of structures (middle). Structural alignment of B-Z homodimer to Max homodimer results in an RMSD of 0.847 Å for the backbone of the entire DNA binding domain held in common and 2.3 Å for entire bHLH structure. The interface between DNA binding domain of B-Z (1781 Å2) is also comparable to that of MAX homodimer (1726 Å2). g, Structural alignment for all residues in common between MAX and B-Z. h, Overview of basic helices from structure alignment.
Extended Data Fig. 7 |
Extended Data Fig. 7 |. Quantitative multiplexed EMSA (qEMSA) assay allows one-pot direct comparison of binding to a pool of unique DNA motifs.
a, Schematic depicting workflow of qEMSA. b, qEMSA profile of STR118 depicting high selectivity for canonical E-box DNA. c-g, Bar graphs indicating specific target enrichment derived from qEMSA experiments for STR118 (c) MAX/MAX (d), (e) STR116, (f) STR640 and (g) STR690. Data shown represent mean and s.d. from n = 2 independent replicates.
Extended Data Fig. 8 |
Extended Data Fig. 8 |. Design and characterization of TFAP4- and OLIG2 derived STRs.
a, Sequences of DNA probes containing target motifs E1, E2, and E3 used in b-f. b, Representative EMSA gels showing DNA binding of indicated compound with DNA consensus oligo E1, E2, and E3 in the presence of 0.01 mg/ml salmon sperm DNA. c-f, Dose-dependent target selectivity curves from quantified EMSA gels for native MAX dimer (c) or MAX- (d), TFAP4- (e) and OLIG2-derived (f) STRs binding to indicated target sequences, E1, E2, or E3.
Fig. 1 |
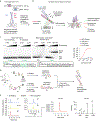
Fig. 1 |. Modular design and synthesis of MAX-derived synthetic transcriptional repressors.
a, Schematic depiction of the bHLH domains of MYC and MAX. Pink and blue coloring identifies individual monomers that form heterodimeric or homodimeric complexes of MYC/MAX or MAX/MAX with duplex DNA. b, Cross-dimer ligation of B and Z helices from opposing monomers (blue + pink, B-Z, left) results in a non-natural TF mimetic that can recognize specific DNA sequences via formation of a ‘sandwich’ dimer. c, Representative EMSA gels showing binding of target (E-box) and control (AP1) oligonucleotides across a dose range of individual basic helices and the cross-dimer mimic, B-Z. d,e, Convergent synthesis scheme (d) and characterization (e) of STRs containing secondary and tertiary domain-stabilizing groups. B and Z helices are synthesized on-resin with bis-alkylated, terminal olefin-containing ‘S5’ amino acids at defined positions for on-resin ring closing metathesis. ‘Stapled’ B helices harbor an orthogonal LysMMT at a defined C-terminal position for deprotection and acylation with a maleimide linker. Stapled helices (Z2 and B1 shown here) are ligated in aqueous solution and readily purified to yield STRs of approximately 6 kDa. Representative chromatograms and mass spectrum of crude precursors and purified B1-Z2 are shown in e. aa, amino acid.
Fig. 2 |
Fig. 2 |. STRs bind E-box DNA with high affinity and specificity.
a, Structural representation of a MAX-STR with potential elements for optimization highlighted. b,c, Sequences of individual basic and zipper peptides containing helix-stabilizing amino acids, mutations and interhelix ligation sites. S5, (S)-5-pentenyl alanine; NL, norleucine; Aib, α-amino isobutyric acid; k, D-lysine. Interhelix ligation sites are shown in green and, in all cases here, represent a glycylmaleimide-modified lysine in the basic helix, ligated via a thioether with the corresponding zipper helix cysteine in elaborated STRs. Binding curves from representative EMSA experiments with individual STR library members are shown below. d, Representative EMSA gels of STR116 and STR118 binding to E-box consensus site containing double-stranded DNA. Apparent Kd values are the mean and 95% confidence interval from n = 3 independent replicates. e, Chemical structures of STR116 and STR118 using the same nomenclature as in b and c. f, Representative EMSA gels showing competition between STR116 or STR118 and MAX/MAX for binding to E-Box DNA (left) with summary table of IC50 values for specific STRs (right), which represent mean and 95% confidence interval from n = 2 independent replicates. CI, confidence interval.
Fig. 3 |
Fig. 3 |. Synthetic modifications improved the stability of STRs in biological environments.
ad, CD spectroscopy analysis of B-Z, STR116 and STR118 at 25 °C (a) and across temperatures (b,c,d) at 10 μM in phosphate buffer. e, Kinetic quantification of STR stability incubated with recombinant trypsin. Kinetic curve fits were derived using a non-linear one-phase decay fit. Data shown represent mean and s.d. from n = 2 independent replicates. f, Quantification of STR DNA-binding activity after incubation in conditioned cell media for 0, 24 or 48 hours. Data shown are mean and s.d. from n = 3 independent replicates. g, Representative EMSA gels of STR118 maintained at 25 °C or heated to 95 °C, cooled to 25 °C and then analyzed for E-box DNA binding. h, Petal plot presentation of activity features for indicated STRs.
Fig. 4 |
Fig. 4 |. STRs are cell permeable and oppose MYC-dependent gene expression and phenotypes in cells.
a,b, Representative confocal fluorescence microscopy images (a) and quantification of total fluorescence intensity (b) of HeLa cells treated with 5 μM STRs. c, Fluorescence gel analysis of extracted intracellular contents from HeLa cells treated with 1 μM of the indicated FITC-STR. 1 μM fluorescent standard of each FITC-STR is included for quantitative comparison. d, Competitive ChIP–qPCR quantification of endogenous MYC occupancy at control and E-box-containing target genes in P493–6 cells treated with STR116 (20 μM) or vehicle for 24 hours. e, Representative SILAC chromatograms for MYC and known MYC-regulated proteins in P493–6 cells treated with vehicle (DMSO), Tet (0.1 μg ml−1, 72 hours) or STR116 (20 μM, 48 hours). Ratios listed are the treated versus control ratio for each chromatogram. R.T., retention time. f, Volcano plot depictions of the protein expression profiles from Tet-treated and STR116-treated P493–6 SILAC cells. The location of validated MYC targets from the ‘DANG_MYC_TARGETS_UP’ gene set are highlighted in red, with MYC highlighted in blue. P values were calculated using a background-based t-test. g,h, Relative viability of proliferating (cells starting in the MYC-ON state, left) or rescued (cells starting in the MYC-OFF state and then released, right) P493–6 cells treated with vehicle, Tet or STR116 for each timepoint are shown. i, Relative viability ratio of proliferating P493–6 cells comparing STR116 to vehicle-treated cells under low, mid and high MYC expression induced by dose-dependent Tet treatment. Graph in b shows per-cell values (n = 60 cells) with mean and s.d. shown as solid bars. ChIP–qPCR data represent the mean and s.d. of n = 2 biological replicates. Viability plots show mean and s.d. from n = 3 biological replicates. Statistical analyses are by unpaired, two-sided t-test. ****P < 0.0001. A.U., arbitrary units.
Fig. 5 |
Fig. 5 |. X-ray crystal structure of a STR:E-box DNA complex.
a, X-ray crystal structure of B-Z monomer (PDB ID: 7RCU) with inset showing electron density map (2Fo-Fc, level 1.5 σ) of the glycine-maleimide linker (green). b, Structure of the B-Z sandwich dimer bound to duplex DNA containing a central 5′-CACGTG-3′ consensus sequence. One monomer is shown using sidechain ball-and-stick representation, with the second monomer shown as a transparent surface; interhelix linker is shown as green spheres. c, Structural alignment of the STR complex (yellow, orange and gray) and MAX protein homodimer (pink, blue and light blue; PDB ID: 1HLO). d, The B-Z dimeric interface involves extensive hydrophobic and polar interactions, highlighted in yellow, to form the intermolecular tetrahelix core and orient the two DNA-binding helices. e, Individual sequence-specific B-Z:E-box contacts are shown in insets, with the relevant target nucleotides highlighted in the corresponding consensus sequence. Nucleotides in the sense and antisense strands are denoted as N and N’, respectively. f, Schematic of contacts between an individual B-Z monomer and one half-site of the E-box-containing oligonucleotide. Red and gray dashes denote sequence-specific and backbone contacts, respectively; double wedges denote Van der Waals interactions.
Fig. 6 |
Fig. 6 |. Reprogramming STRs for alternative, specific DNA binding.
a, Schematic depicting the design of MAX-STRs. b, qEMSA profile of MAX/MAX indicating some preference for non-canonical E-box motifs. c, qEMSA profile of STR116 displaying high selectivity for E-box DNA. d, Modular reprogramming of STRs to generate TFAP4-STRs and OLIG2-STRs with altered sequence specificities. e, Structures of B-Z, STR640 and STR690. f, EMSA analysis for natural MAX bHLH domain (amino acids 22–102), B-Z, STR690 and STR640 with duplex DNA probes E1, E2 and E3 (antisense complement strand not shown) in the presence of 0.01 mg ml−1 of salmon sperm DNA. g,h, qEMSA profiles of STR640 (g) and STR690 (h) depicting high selectivity for unique targets. aa, amino acid.

References

    1. Lambert SA et al. The human transcription factors. Cell 172, 650–665 (2018). - PubMed
    1. Talanian RV, McKnight CJ & Kim PS Sequence-specific DNA binding by a short peptide dimer. Science 249, 769–771 (1990). - PubMed
    1. Kouzarides T & Ziff E Leucine zippers of fos, jun and GCN4 dictate dimerization specificity and thereby control DNA binding. Nature 340, 568–571 (1989). - PubMed
    1. Blancafort P, Segal DJ & Barbas CF 3rd Designing transcription factor architectures for drug discovery. Mol. Pharmacol 66, 1361–1371 (2004). - PubMed
    1. Brent R & Ptashne M A eukaryotic transcriptional activator bearing the DNA specificity of a prokaryotic repressor. Cell 43, 729–736 (1985). - PubMed

Publication types

MeSH terms

Substances