. 2023 Mar;41(3):344-354.
doi: 10.1038/s41587-022-01505-w. Epub 2022 Oct 27.

Quantitative sequencing using BID-seq uncovers abundant pseudouridines in mammalian mRNA at base resolution

Affiliations

Quantitative sequencing using BID-seq uncovers abundant pseudouridines in mammalian mRNA at base resolution

Qing Dai et al. Nat Biotechnol. 2023 Mar.

Abstract

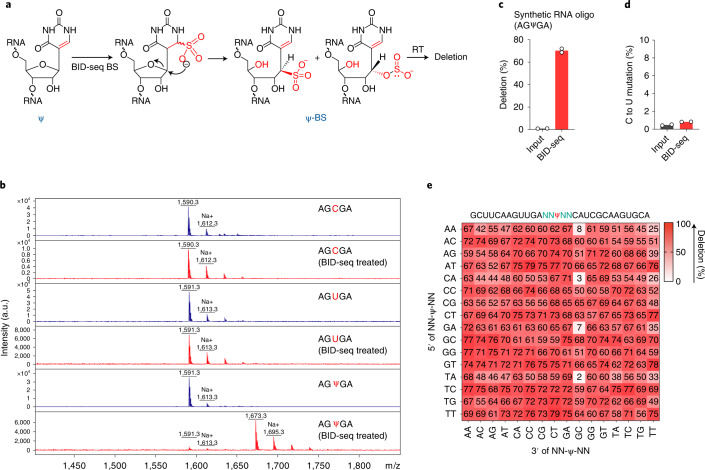
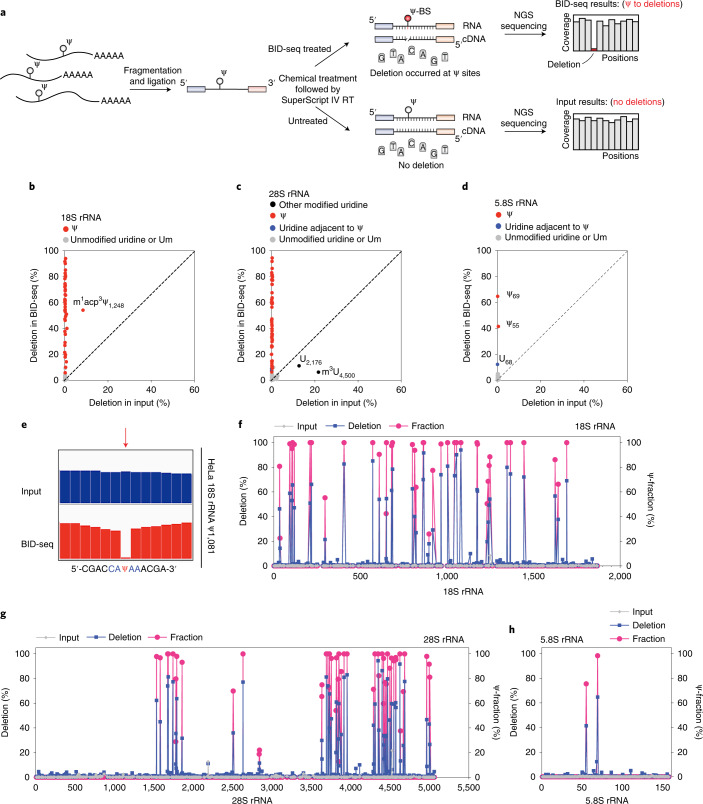
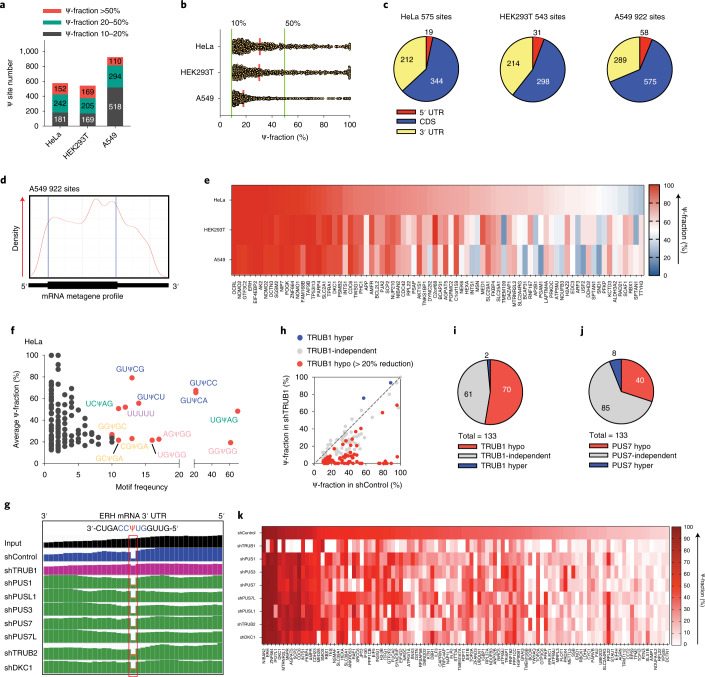
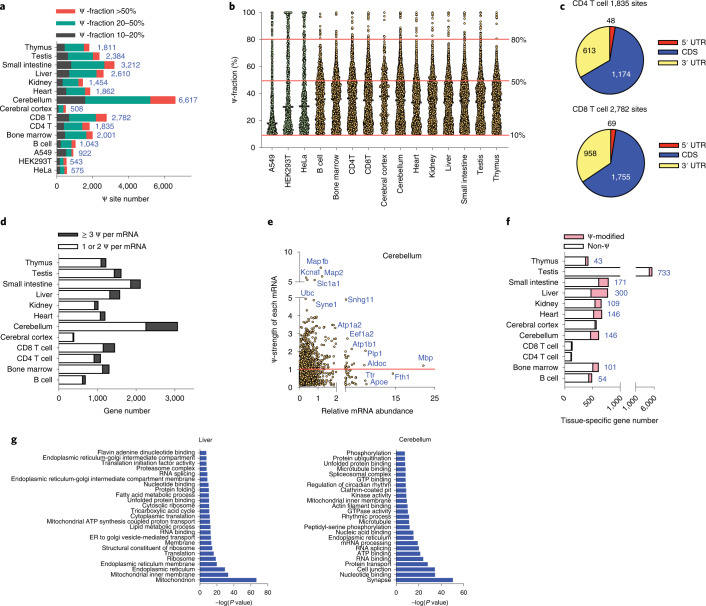
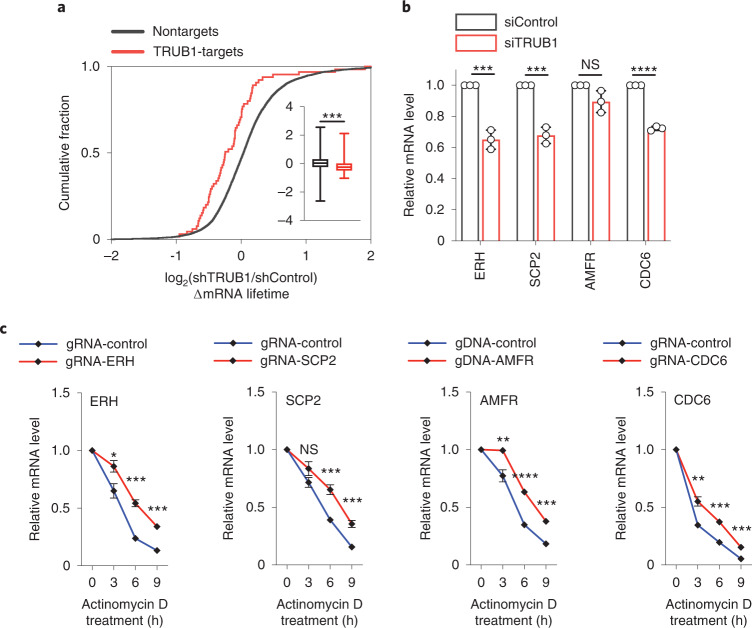
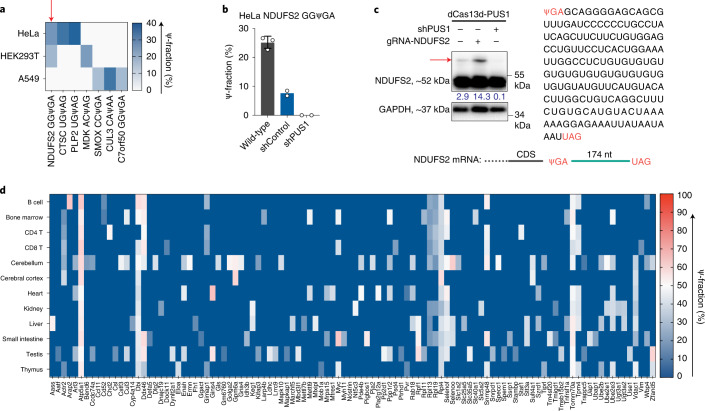
Functional characterization of pseudouridine (Ψ) in mammalian mRNA has been hampered by the lack of a quantitative method that maps Ψ in the whole transcriptome. We report bisulfite-induced deletion sequencing (BID-seq), which uses a bisulfite-mediated reaction to convert pseudouridine stoichiometrically into deletion upon reverse transcription without cytosine deamination. BID-seq enables detection of abundant Ψ sites with stoichiometry information in several human cell lines and 12 different mouse tissues using 10-20 ng input RNA. We uncover consensus sequences for Ψ in mammalian mRNA and assign different 'writer' proteins to individual Ψ deposition. Our results reveal a transcript stabilization role of Ψ sites installed by TRUB1 in human cancer cells. We also detect the presence of Ψ within stop codons of mammalian mRNA and confirm the role of Ψ in promoting stop codon readthrough in vivo. BID-seq will enable future investigations of the roles of Ψ in diverse biological processes.


Conflict of interest statement

C.H. is a scientific founder, a member of the scientific advisory board and equity holder of Aferna Green, Inc. and AccuaDX Inc., and a scientific cofounder and equity holder of Accent Therapeutics, Inc.

Figures

Fig. 1
Fig. 1. BID-seq quantitatively detects Ψ sites as deletion signatures.
a, Chemical structure of the Ψ-BS adduct after bisulfite treatment. b, BID-seq BS selectively reacts with Ψ and completely converts it into the Ψ-BS adduct under optimized conditions, without affecting normal C or U bases in RNA. c, The deletion ratio at the 100% modified Ψ site within the AGΨGA motif (synthesized RNA oligo) after BID-seq treatment versus that in the input. d, The average C to U mutation ratio at normal cytidine bases in synthesized RNA oligo after BID-seq treatment versus that in input. For cd, n = 2 biologically independent samples. e, Heatmap plot for deletion ratios on 256 motifs (NNΨNN) after BS treatment in BID-seq, which contain one 100% modified Ψ within each motif. Source data
Fig. 2
Fig. 2. BID-seq detects known Ψ sites in human ribosomal RNA with modification stoichiometry.
a, Flowchart of library construction pipeline for BID-seq, revealing Ψ modification fraction by deletion ratio signature. b, Two-dimensional (2D) plot for deletion ratios of known Ψ sites in HeLa 18S ribosomal RNA, in BID-seq treated library versus input. c, 2D plot for deletion ratios of known Ψ sites in HeLa 28S ribosomal RNA, in BID-seq treated library versus input. d, 2D plot for deletion ratios of known Ψ sites in HeLa 5.8S ribosomal RNA, in BID-seq treated library versus input. e, An example IGV plot of the highly modified Ψ site at position 1,081 of HeLa 18S ribosomal RNA, within a CAΨAA motif. fh, Deletion and Ψ fraction detected by BID-seq in HeLa 18S rRNA (f), 28S rRNA (g), and 5.8S rRNA (h), respectively. After BS treatment in BID-seq, the deletion rates and Ψ fractions are marked in blue and pink, respectively. Source data
Fig. 3
Fig. 3. BID-seq detects Ψ sites at base resolution in human mRNA and characterizes the ‘writer’ protein for individual Ψ sites.
a, BID-seq reveals 575, 543 and 922 Ψ sites (modification fraction above 10%) in HeLa, HEK293T and A549 cells, respectively. b, Modification level distribution of Ψ sites in mRNA from HeLa, HEK293T and A549 cells, with the definition of highly modified Ψ sites as those above 50% Ψ-fraction. c, Pie chart showing the distribution of mRNA Ψ sites in HeLa, HEK293T and A549 cells, with stoichiometry ≥10% in three mRNA segments. d, Metagene plot of 922 Ψ sites (modification fraction >10%) in A549 mRNA. e, Heatmap plot of Ψ-fraction for 78 overlapped Ψ sites with above 50% Ψ-fraction in at least one human cell line and above 10% Ψ-fraction in three cell lines, in a matrix of the corresponding gene name versus each cell line. f, Distribution of motifs for 575 Ψ sites in HeLa mRNA, with ‘x axis’ as the motif frequency and ‘y axis’ showing the average Ψ modification fraction of each motif. g, Example IGV plot to show raw reads coverage at the highly modified Ψ site in HeLa ERH mRNA. The deletion signatures reflect the modification level change in shTRUB1 versus shControl, but not depletion of other PUS enzymes. h, Among 133 Ψ sites (above 10% Ψ-fraction) in shControl HeLa mRNA, scatter plot of BID-seq data shows the reduced Ψ-fraction at 70 Ψ sites in TRUB1-depleted cells. i, Pie chart of TRUB1 hypo-regulated, hyper-regulated and TRUB1-independent Ψ sites. j, Pie chart of PUS7 hypo-regulated, hyper-regulated and PUS7-independent Ψ sites. k, Heatmap plot of Ψ-fraction for 104 Ψ sites that show reduced modification level under the depletion of a specific PUS enzyme or multiple PUS enzymes, in a matrix of the corresponding gene name versus the knockdown of each PUS enzyme. Source data
Fig. 4
Fig. 4. Mouse tissue mRNAs are heavily modified with Ψ.
a, BID-seq reveals a large number of Ψ sites (modification fraction >10%) in 12 mouse tissues, with the Ψ site number in three human cell lines shown for comparison. b, Modification level distribution of mRNA Ψ sites in 12 mouse tissues, in which a number of Ψ sites are highly modified (modification fractions above 50%). The modification level distribution of Ψ sites in three human cell lines are shown as comparison. c, Pie chart showing the distribution of mRNA Ψ sites in CD4 T and CD8 T cells, with stoichiometry ≥10% in three mRNA segments. d, The number of Ψ-modified genes (with Ψ sites >10% fraction) that contain one or two Ψ versus above three Ψ sites per mRNA, in 12 mouse tissues. e, 2D plot of Ψ-modified genes (Ψ-fraction above 10% for each Ψ site) in mouse cerebellum, respectively, with ‘x axis’ as the mRNA abundance normalized to Rps8 (abundant nontarget gene, without any Ψ on mRNA) and ‘y axis’ showing the Ψ-strength of each gene, defined as the sum of Ψ fraction at all the Ψ sites within one mRNA. The cutoff of Ψ-strength 1.0 was marked by a red line. f, Among tissue-specific genes in each tissue type, the gene number distribution of non-Ψ-modified genes versus Ψ-modified genes. g, Top 25 enriched GO clusters from nontissue-specific Ψ-modified genes, in mouse liver and cerebellum, respectively. One-sided Fisher’s exact test. Adjusted P values using the linear step-up method. Source data
Fig. 5
Fig. 5. Ψ affects mRNA stability.
a, Cumulative distribution showing the decreased mRNA half-life for TRUB1-targets in TRUB1-depleted HeLa cells versus the control, compared with nontargets. n = 7,881 nontargets, and n = 65 TRUB1-targets. Box, first and third quartiles; line in the middle of the box, median; short line, maximum and minimum; ***P = 0.0008; unpaired, two-tailed t-test. b, Relative mRNA levels of four representative transcripts carrying TRUB1-regulated highly modified Ψ, in siTRUB1 versus siControl. P = 0.0006, 0.0005, 0.0612 and <0.0001, respectively; unpaired, two-tailed t-test. c, Stable expression of dCas13d-TRUB1, by gRNA transfection, restored Ψ and increased half-life of the target mRNA in TRUB1-depeted HeLa cells. For ERH: P = 0.0104, 0.0002 and 0.0002, respectively; unpaired, two-tailed t-test. For SCP2: P = 0.0511, 0.0006 and 0.0006, respectively; unpaired, two-tailed t-test. For AMFR: P = 0.0025, <0.0001 and 0.0002, respectively; unpaired, two-tailed t-test. For CDC6: P = 0.0015, 0.0002 and 0.0002, respectively; unpaired, two-tailed t-test. For bc, n = 3, biologically independent samples; data are presented as mean values ± s.d.; NS, P ≥ 0.05; *P < 0.05; **P < 0.01; ***P < 0.001 and ****P < 0.0001. Source data
Fig. 6
Fig. 6. The presence of Ψ promotes stop codon readthrough in vivo.
a, Heatmap plot of Ψ fraction for seven Ψ sites within mRNA stop codon in three human cell lines, in a matrix of the corresponding gene name versus each cell line. b, Ψ modification fraction of Ψ within stop codon of the NDUFS2 mRNA, in wild-type HeLa cells, shControl HeLa cells and PUS1-depleted HeLa cells, respectively. For wild-type HeLa cells, n = 3, biologically independent samples; data are presented as mean values ± s.d. For shControl and PUS1-depleted HeLa cells, n = 2, biologically independent samples. c, Stop codon readthrough for the NDUFS2 mRNA in HeLa cells investigated by immunoblotting assay. shControl or shPUS1 HeLa cells stably expressing dCas13d-PUS1 were transfected with control or NDUFS2 gRNA for 48 h. The percentage numbers of readthrough ratio are shown in blue. The readthrough protein bands are labeled by red arrow. d, Heatmap plot of Ψ-fraction for 106 Ψ sites within mRNA stop codons in mouse tissues, in a matrix of the corresponding gene name versus tissue type. Source data

Similar articles

Cited by

References

    1. Frye M, Harada BT, Behm M, He C. RNA modifications modulate gene expression during development. Science. 2018;361:1346–1349. doi: 10.1126/science.aau1646. - DOI - PMC - PubMed
    1. Roundtree IA, Evans ME, Pan T, He C. Dynamic RNA modifications in gene expression regulation. Cell. 2017;169:1187–1200. doi: 10.1016/j.cell.2017.05.045. - DOI - PMC - PubMed
    1. Borchardt EK, Martinez NM, Gilbert WV. Regulation and function of RNA pseudouridylation in human cells. Annu. Rev. Genet. 2020;54:309–336. doi: 10.1146/annurev-genet-112618-043830. - DOI - PMC - PubMed
    1. Carlile TM, et al. Pseudouridine profiling reveals regulated mRNA pseudouridylation in yeast and human cells. Nature. 2014;515:143–146. doi: 10.1038/nature13802. - DOI - PMC - PubMed
    1. Schwartz S, et al. Transcriptome-wide mapping reveals widespread dynamic-regulated pseudouridylation of ncRNA and mRNA. Cell. 2014;159:148–162. doi: 10.1016/j.cell.2014.08.028. - DOI - PMC - PubMed

Publication types