. 2022 Nov;8(11):1304-1316.
doi: 10.1038/s41477-022-01244-5. Epub 2022 Oct 27.

Towards a unified theory of plant photosynthesis and hydraulics

Affiliations

Towards a unified theory of plant photosynthesis and hydraulics

Jaideep Joshi et al. Nat Plants. 2022 Nov.

Abstract

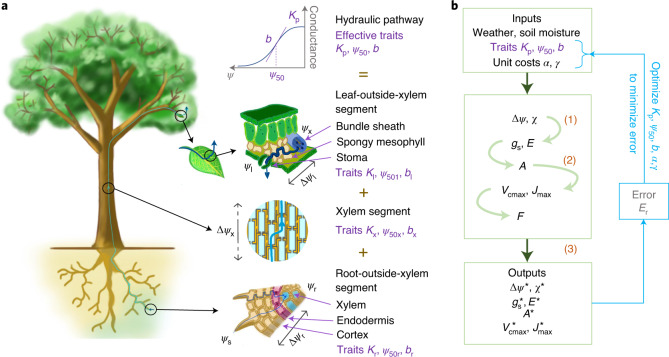
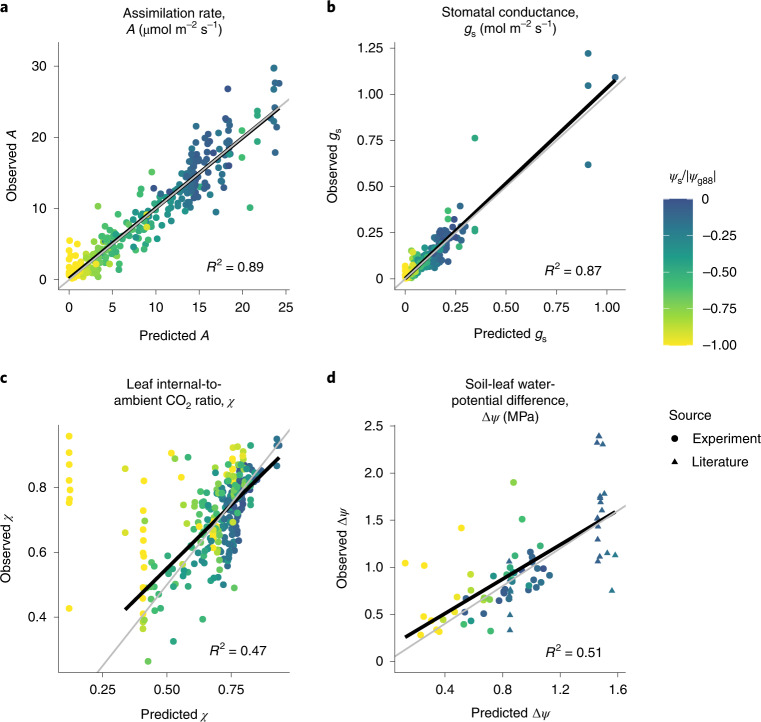
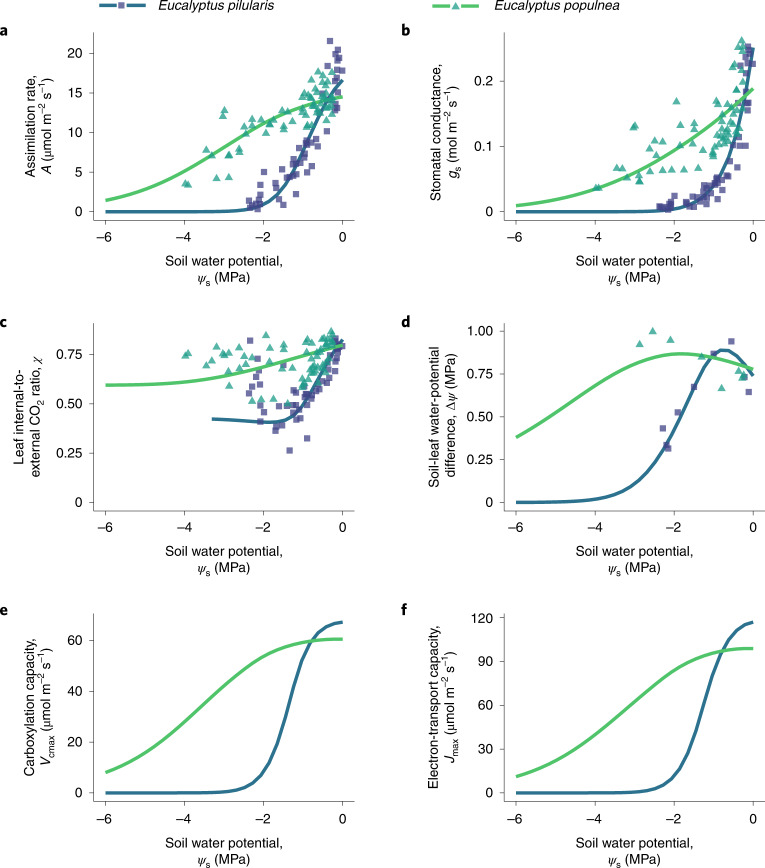
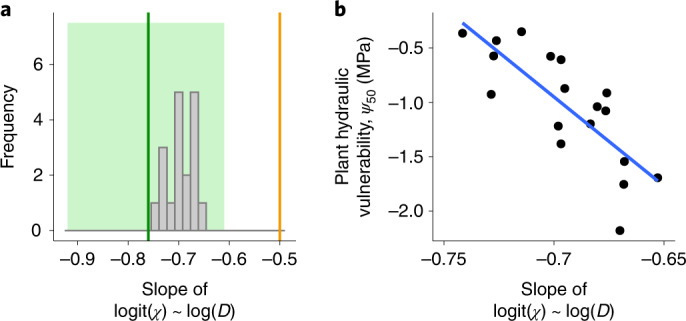
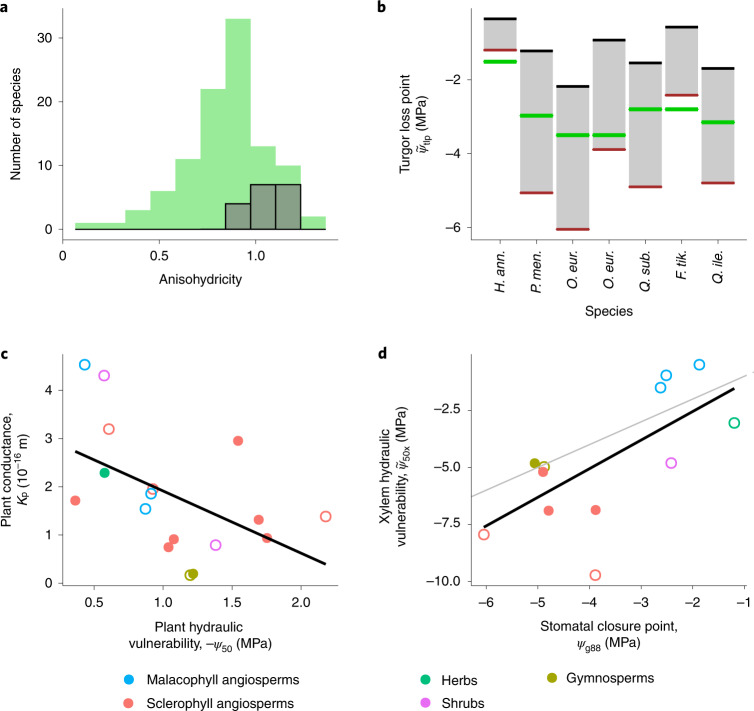
The global carbon and water cycles are governed by the coupling of CO2 and water vapour exchanges through the leaves of terrestrial plants, controlled by plant adaptations to balance carbon gains and hydraulic risks. We introduce a trait-based optimality theory that unifies the treatment of stomatal responses and biochemical acclimation of plants to environments changing on multiple timescales. Tested with experimental data from 18 species, our model successfully predicts the simultaneous decline in carbon assimilation rate, stomatal conductance and photosynthetic capacity during progressive soil drought. It also correctly predicts the dependencies of gas exchange on atmospheric vapour pressure deficit, temperature and CO2. Model predictions are also consistent with widely observed empirical patterns, such as the distribution of hydraulic strategies. Our unified theory opens new avenues for reliably modelling the interactive effects of drying soil and rising atmospheric CO2 on global photosynthesis and transpiration.


Conflict of interest statement

The authors declare no competing interests.

Figures

Fig. 1
Fig. 1. Schematic representation of our model, underlying first principles and notation.
a, Water-transport pathway. Purple labels indicate the three hydraulic traits that determine the conductance to water flow of each of the three segments of the water-transport pathway. Water potentials are shown at various points along the pathway: ψs in soil, ψr in roots at the beginning of the xylem segment, ψx at the end of the xylem segment and ψl in leaves near the stomata. The soil-to-leaf water potential difference Δψ = ψs − ψl thus comprises the successive pressure drops along the three segments, that is, Δψr = ψs − ψr along the radial outside-xylem segment within the roots, Δψx=ψrψx along the xylem and Δψl=ψxψl along the outside-xylem segment within the leaves. b, Model-calibration pathway. The model takes as inputs three effective whole-plant hydraulic traits (Kp, ψ50 and b) together with two cost parameters (the unit costs of photosynthetic and hydraulic capacities, α and γ, respectively). It predicts as outputs the optimal values (denoted by asterisks) of stomatal conductance gs*, assimilation rate A*, transpiration E*, acclimated photosynthetic capacities Vcmax* and Jmax*, soil-to-leaf water-potential difference Δψ* and leaf internal-to-external CO2 ratio χ*. Each variable is first calculated as a function of Δψ and χ, as shown by the four light-green arrows, from which the optimal combination (Δψ*, χ*) is then calculated by maximizing profit F according to equation (1). Blue arrows and boxes indicate the process through which the best-fit traits and unit costs for each species are calculated by minimizing the model error. Orange labels indicate the three principles and hypotheses underlying the model, displayed next to the processes they affect.
Fig. 2
Fig. 2. Predicted gas-exchange rates and water relations closely match observations for 18 species.
ac, Pooled data from all 18 species comparing assimilation rate A (a), stomatal conductance gs (b) and leaf-internal-to-external CO2 ratio χ (c) for different values of soil (predawn leaf) water potential ψs. d, Predicted values of soil-to-leaf water-potential difference Δψ compared to observations for (1) six species for which midday leaf water potentials were reported in the corresponding experiments, and thus measured under the same environmental conditions as the gas-exchange rates (circles), and (2) two species (Pseudotzuga menziesii and Olea europea var. Meski) for which values were obtained from literature (triangles). Colours indicate soil water potential relative to the stomatal closure point (ψg88) of the species; thus, yellow points represent soil water potentials at or beyond stomatal closure. Black lines show linear regressions, while grey lines are the 1:1 lines that represent perfect predictions. In c, we ignore points with ψs < ψg88 (yellow points) while calculating the regression line, since there is a known bias in predictions of χ beyond stomatal closure (see Discussion).
Fig. 3
Fig. 3. Predicted photosynthetic responses to progressive soil drought closely match observations.
Matches are shown here for two Eucalyptus species from contrasting climates, and corresponding matches for all 18 species are shown in Supplementary Fig. 1. af, Predicted responses (lines) and observed responses (points) to decreasing soil water potential (ψs, measured as predawn leaf water potential): assimilation rate A (a), stomatal conductance gs (b), leaf-internal-to-external CO2 ratio χ (c), soil-to-leaf water-potential difference Δψ (d), carboxylation capacity Vcmax (e) and electron-transport capacity Jmax (f). Eucalyptus pilularis (blue lines and squares) typically occupies warm and humid coastal areas in eastern Australia, whereas Eucalyptus populnea (green lines and triangles) typically occupies semi-arid interior regions of eastern Australia. Since both species were grown in the same greenhouse during the experiment, their contrasting responses reveal genetic adaptations to their native environments. For both species, progressive drought was experimentally induced over 12 d, resulting in a fast instantaneous response of stomatal conductance in combination with a slow acclimating response of photosynthetic capacity. Our model predictions readily account for both responses.
Fig. 4
Fig. 4. Our model correctly predicts the response of χ to vapour pressure deficit.
a, The model-predicted distribution of the slope of the relationship between logit(χ) and log(D) for the analysed species (grey bars) is well within the range reported in ref. (their reported mean and confidence interval is shown by the green line and green region, respectively). It is significantly different from −0.5 (orange line; a one-sample t-test shows a predicted mean slope of −0.7 and a 95% confidence interval of (−0.72, −0.68)). For each species, we calculate the predicted slope by varying vapour pressure deficit in the range 5–5,000 Pa while keeping other environmental parameters constant (at values reported in the respective experiments, with ψs = 0) and using fitted trait values (Table 1). b, This slope is correlated with the ψ50 (black points are species-specific values and the blue line is a linear regression line), with more negative slopes observed for species with less negative ψ50 (drought avoiders). This could be a reason why earlier datasets supported a slope value of −0.5, as such datasets were often dominated by temperate evergreen species, which are typically characterized by highly negative values of ψ50.
Fig. 5
Fig. 5. Our model predictions are consistent with widely observed empirical patterns.
a, The predicted distribution of the degree of anisohydricity among the 18 analysed species (grey bars) lies within the observed global distribution (green bars; as reported in ref. ). b, Consistent with empirical observations, the observed turgor loss point (thick green line) lies between the model-predicted water potential at 50% loss of plant conductivity (ψ50; black line) and the model-predicted water potential at 88% stomatal closure (ψg88; brown line). c, Plant hydraulic conductance (Kp) is weakly negatively correlated with ψ50, with no species having high values of both traits, implying a weak safety-efficiency trade-off in line with empirical observations. d, When leaf water potential is at ψg88, the observed loss of xylem conductivity is typically less than 50% (implied by observed xylem hydraulic vulnerability ψ~50x being less than model-predicted ψg88), which means that plants close their stomata before the onset of substantial xylem embolism. Furthermore, the difference between the regression line (black) and the 1:1 line (grey) is low, implying that the hydraulic safety margin ψ~50xψg88 is small on average. Sources for values of ψ~50x are given in Supplementary Table 2. Closed circles indicate species for which γ was estimated using data on Δψ, whereas open circles refer to species for which such data were not available and for which we therefore used an average value of γ estimated for the respective plant types.

Similar articles

Cited by

References

    1. Raschke K, Monteith JL, Weatherley PE. How stomata resolve the dilemma of opposing priorities. Phil. Trans. R. Soc. Lond. B. 1976;273:551–560. doi: 10.1098/rstb.1976.0031. - DOI
    1. Brodribb TJ, Cochard H. Hydraulic failure defines the recovery and point of death in water-stressed conifers. Plant Physiol. 2009;149:575–584. doi: 10.1104/pp.108.129783. - DOI - PMC - PubMed
    1. Brodribb TJ, Bowman DJMS, Nichols S, Delzon S, Burlett R. Xylem function and growth rate interact to determine recovery rates after exposure to extreme water deficit. New Phytol. 2010;188:533–542. doi: 10.1111/j.1469-8137.2010.03393.x. - DOI - PubMed
    1. Choat B, et al. Triggers of tree mortality under drought. Nature. 2018;558:531–539. doi: 10.1038/s41586-018-0240-x. - DOI - PubMed
    1. Keeling, R. F. et al. Atmospheric evidence for a global secular increase in carbon isotopic discrimination of land photosynthesis. Proc. Natl Acad. Sci. USA10.1073/pnas.1619240114 (2017). - PMC - PubMed