

A framework for detecting noncoding rare-variant associations of large-scale whole-genome sequencing studies
- PMID: 36303018
- PMCID: PMC10008172
- DOI: 10.1038/s41592-022-01640-x
A framework for detecting noncoding rare-variant associations of large-scale whole-genome sequencing studies
Abstract
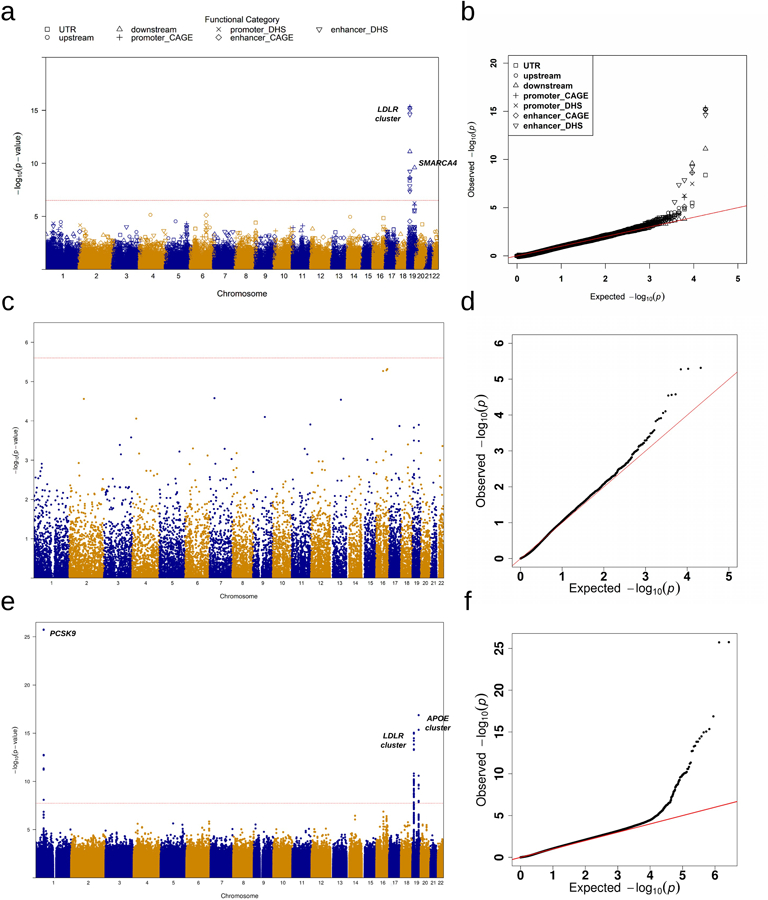
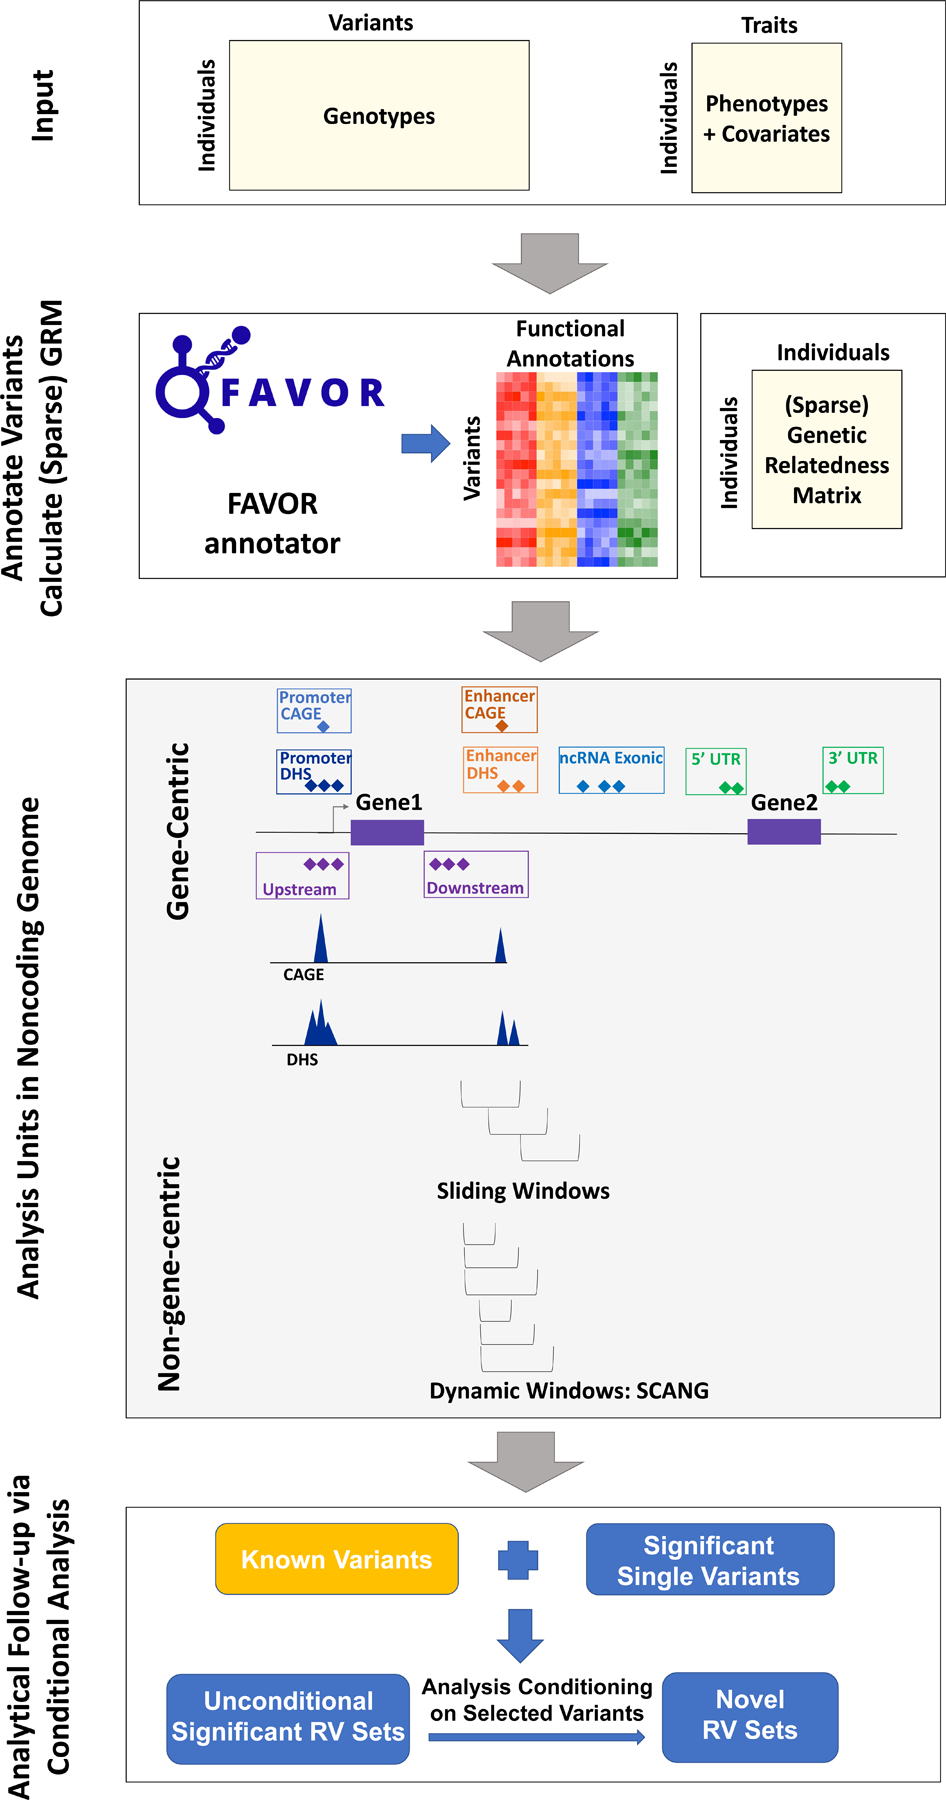
Large-scale whole-genome sequencing studies have enabled analysis of noncoding rare-variant (RV) associations with complex human diseases and traits. Variant-set analysis is a powerful approach to study RV association. However, existing methods have limited ability in analyzing the noncoding genome. We propose a computationally efficient and robust noncoding RV association detection framework, STAARpipeline, to automatically annotate a whole-genome sequencing study and perform flexible noncoding RV association analysis, including gene-centric analysis and fixed window-based and dynamic window-based non-gene-centric analysis by incorporating variant functional annotations. In gene-centric analysis, STAARpipeline uses STAAR to group noncoding variants based on functional categories of genes and incorporate multiple functional annotations. In non-gene-centric analysis, STAARpipeline uses SCANG-STAAR to incorporate dynamic window sizes and multiple functional annotations. We apply STAARpipeline to identify noncoding RV sets associated with four lipid traits in 21,015 discovery samples from the Trans-Omics for Precision Medicine (TOPMed) program and replicate several of them in an additional 9,123 TOPMed samples. We also analyze five non-lipid TOPMed traits.
© 2022. The Author(s), under exclusive licence to Springer Nature America, Inc.
Conflict of interest statement
Competing interests
S.M.G. is now an employee of Regeneron Genetics Center. J.B.M. is an Academic Associate for Quest Diagnostics R&D. For B.D.M.: The Amish Research Program receives partial support from Regeneron Pharmaceuticals. M.E.M. reports grant from Regeneron Pharmaceutical unrelated to the present work. B.M.P. serves on the Steering Committee of the Yale Open Data Access Project funded by Johnson & Johnson. L.M.R. is a consultant for the TOPMed Admistrative Coordinating Center (through Westat). For S.R.: Jazz Pharma, Eli Lilly, Apnimed, unrelated to the present work. The spouse of C.J.W. works at Regeneron Pharmaceuticals. P.N. reports investigator-initiated grants from Amgen, Apple, AstraZeneca, Boston Scientific, and Novartis, personal fees from Apple, AstraZeneca, Blackstone Life Sciences, Foresite Labs, Novartis, Roche / Genentech, is a co-founder of TenSixteen Bio, is a shareholder of geneXwell and TenSixteen Bio, and spousal employment at Vertex, all unrelated to the present work. X. Lin is a consultant of AbbVie Pharmaceuticals and Verily Life Sciences. The remaining authors declare no competing interests.
Figures
Comment in
-
STAARpipeline: an all-in-one rare-variant tool for biobank-scale whole-genome sequencing data.Nat Methods. 2022 Dec;19(12):1532-1533. doi: 10.1038/s41592-022-01641-w. Nat Methods. 2022. PMID: 36316564 No abstract available.
References
Methods-only references
-
- Li X & Li Z xihaoli/STAARpipeline: STAARpipeline_v0.9.6 Version 0.9.6 10.5281/zenodo.6871504 (2022). - DOI
-
- Li X & Li Z xihaoli/STAARpipelineSummary: STAARpipelineSummary_v0.9.6 Version 0.9.6 10.5281/zenodo.6871524 (2022). - DOI
-
- Li X & Li Z xihaoli/STAARpipeline-Tutorial: v0.9.6 Version 0.9.6 10.5281/zenodo.6871408 (2022). - DOI
Publication types
MeSH terms
Grants and funding
- N01 HC025195/HL/NHLBI NIH HHS/United States
- R01 DK078616/DK/NIDDK NIH HHS/United States
- U01 HL054472/HL/NHLBI NIH HHS/United States
- U01 HG007417/HG/NHGRI NIH HHS/United States
- R01 HL071025/HL/NHLBI NIH HHS/United States
- UL1 RR033176/RR/NCRR NIH HHS/United States
- R01 HL112064/HL/NHLBI NIH HHS/United States
- KL2 TR001100/TR/NCATS NIH HHS/United States
- UM1 AI069423/AI/NIAID NIH HHS/United States
- 75N92020D00002/HL/NHLBI NIH HHS/United States
- F30 HL149180/HL/NHLBI NIH HHS/United States
- R01 HL113323/HL/NHLBI NIH HHS/United States
- R01 HL132947/HL/NHLBI NIH HHS/United States
- P30 DK040561/DK/NIDDK NIH HHS/United States
- U01 HL137183/HL/NHLBI NIH HHS/United States
- N01 HC095161/HL/NHLBI NIH HHS/United States
- P30 CA016672/CA/NCI NIH HHS/United States
- 75N92020D00005/HL/NHLBI NIH HHS/United States
- R01 HL104135/HL/NHLBI NIH HHS/United States
- T32 HL144442/HL/NHLBI NIH HHS/United States
- R35 CA197449/CA/NCI NIH HHS/United States
- P30 ES010126/ES/NIEHS NIH HHS/United States
- R01 HL168897/HL/NHLBI NIH HHS/United States
- N01 HC095168/HL/NHLBI NIH HHS/United States
- R01 HL071251/HL/NHLBI NIH HHS/United States
- R01 HL123915/HL/NHLBI NIH HHS/United States
- R01 HL133040/HL/NHLBI NIH HHS/United States
- R01 HL120393/HL/NHLBI NIH HHS/United States
- R01 HL087698/HL/NHLBI NIH HHS/United States
- R01 HL046380/HL/NHLBI NIH HHS/United States
- R03 HL141439/HL/NHLBI NIH HHS/United States
- U54 HG003067/HG/NHGRI NIH HHS/United States
- K01 AG059898/AG/NIA NIH HHS/United States
- R01 HL155742/HL/NHLBI NIH HHS/United States
- U01 DK085524/DK/NIDDK NIH HHS/United States
- KL2 TR002542/TR/NCATS NIH HHS/United States
- U01 DK062413/DK/NIDDK NIH HHS/United States
- R01 HL109946/HL/NHLBI NIH HHS/United States
- R01 HL071259/HL/NHLBI NIH HHS/United States
- K01 HL136700/HL/NHLBI NIH HHS/United States
- R01 HG006703/HG/NHGRI NIH HHS/United States
- U19 CA203654/CA/NCI NIH HHS/United States
- U01 HL080295/HL/NHLBI NIH HHS/United States
- UL1 TR001079/TR/NCATS NIH HHS/United States
- N01 HC095169/HL/NHLBI NIH HHS/United States
- U01 HG012064/HG/NHGRI NIH HHS/United States
- P30 ES005605/ES/NIEHS NIH HHS/United States
- R21 HL140385/HL/NHLBI NIH HHS/United States
- R01 DK113003/DK/NIDDK NIH HHS/United States
- R01 HL059367/HL/NHLBI NIH HHS/United States
- U01 HL130114/HL/NHLBI NIH HHS/United States
- R01 AR048797/AR/NIAMS NIH HHS/United States
- R01 AR042742/AR/NIAMS NIH HHS/United States
- R01 HL092577/HL/NHLBI NIH HHS/United States
- R01 HL117191/HL/NHLBI NIH HHS/United States
- R01 HG009974/HG/NHGRI NIH HHS/United States
- R24 AG047115/AG/NIA NIH HHS/United States
- P01 HL107202/HL/NHLBI NIH HHS/United States
- P50 HL118006/HL/NHLBI NIH HHS/United States
- U01 HL054509/HL/NHLBI NIH HHS/United States
- 75N92020D00001/HL/NHLBI NIH HHS/United States
- U01 HL120393/HL/NHLBI NIH HHS/United States
- R01 HL113338/HL/NHLBI NIH HHS/United States
- R01 DK117445/DK/NIDDK NIH HHS/United States
- R01 HL077612/HL/NHLBI NIH HHS/United States
- R01 HL153805/HL/NHLBI NIH HHS/United States
- R01 AG058921/AG/NIA NIH HHS/United States
- R01 HL129132/HL/NHLBI NIH HHS/United States
- R01 HL137922/HL/NHLBI NIH HHS/United States
- R01 HL071250/HL/NHLBI NIH HHS/United States
- R35 HL135824/HL/NHLBI NIH HHS/United States
- R01 AI079139/AI/NIAID NIH HHS/United States
- R01 DK110113/DK/NIDDK NIH HHS/United States
- U19 AI111224/AI/NIAID NIH HHS/United States
- R01 HL138737/HL/NHLBI NIH HHS/United States
- P30 DK079626/DK/NIDDK NIH HHS/United States
- R01 NS058700/NS/NINDS NIH HHS/United States
- T32 HG000040/HG/NHGRI NIH HHS/United States
- N01 HC095167/HL/NHLBI NIH HHS/United States
- R01 HL127564/HL/NHLBI NIH HHS/United States
- R01 HL141845/HL/NHLBI NIH HHS/United States
- R01 DK075787/DK/NIDDK NIH HHS/United States
- R01 AR072199/AR/NIAMS NIH HHS/United States
- R01 HL120854/HL/NHLBI NIH HHS/United States
- R01 HL163560/HL/NHLBI NIH HHS/United States
- R01 HL163972/HL/NHLBI NIH HHS/United States
- K23 HL123778/HL/NHLBI NIH HHS/United States
- U01 HL137181/HL/NHLBI NIH HHS/United States
- N01 HC095159/HL/NHLBI NIH HHS/United States
- S10 OD026880/OD/NIH HHS/United States
- F32 HL085989/HL/NHLBI NIH HHS/United States
- R01 MH078111/MH/NIMH NIH HHS/United States
- 75N92020D00003/HL/NHLBI NIH HHS/United States
- R01 HL141944/HL/NHLBI NIH HHS/United States
- R01 HL119443/HL/NHLBI NIH HHS/United States
- R01 HL105756/HL/NHLBI NIH HHS/United States
- UM1 AI068634/AI/NIAID NIH HHS/United States
- F30 HL107066/HL/NHLBI NIH HHS/United States
- K01 HL125751/HL/NHLBI NIH HHS/United States
- R01 HL067348/HL/NHLBI NIH HHS/United States
- T32 HL007208/HL/NHLBI NIH HHS/United States
- R01 HL142711/HL/NHLBI NIH HHS/United States
- R35 HL135818/HL/NHLBI NIH HHS/United States
- T32 GM074897/GM/NIGMS NIH HHS/United States
- R01 HL113326/HL/NHLBI NIH HHS/United States
- R00 HL129045/HL/NHLBI NIH HHS/United States
- U01 HL072524/HL/NHLBI NIH HHS/United States
- K08 HL140203/HL/NHLBI NIH HHS/United States
- K08 HL141601/HL/NHLBI NIH HHS/United States
- P30 DK063491/DK/NIDDK NIH HHS/United States
- R01 HL071051/HL/NHLBI NIH HHS/United States
- R56 AG058543/AG/NIA NIH HHS/United States
- U19 AI077439/AI/NIAID NIH HHS/United States
- R01 HL142028/HL/NHLBI NIH HHS/United States
- R35 GM127131/GM/NIGMS NIH HHS/United States
- U01 HL137880/HL/NHLBI NIH HHS/United States
- R01 HG010869/HG/NHGRI NIH HHS/United States
- M01 RR000052/RR/NCRR NIH HHS/United States
- T32 GM007205/GM/NIGMS NIH HHS/United States
- UL1 TR001420/TR/NCATS NIH HHS/United States
- R01 HL049762/HL/NHLBI NIH HHS/United States
- 75N92020D00004/HL/NHLBI NIH HHS/United States
- R01 HL148239/HL/NHLBI NIH HHS/United States
- R01 AI132476/AI/NIAID NIH HHS/United States
- P01 HL045522/HL/NHLBI NIH HHS/United States
- R01 HL132320/HL/NHLBI NIH HHS/United States
- N01 HC095163/HL/NHLBI NIH HHS/United States
- 75N92020D00007/HL/NHLBI NIH HHS/United States
- U01 HL072518/HL/NHLBI NIH HHS/United States
- U01 DK078616/DK/NIDDK NIH HHS/United States
- U01 HL137162/HL/NHLBI NIH HHS/United States
- R01 HL143221/HL/NHLBI NIH HHS/United States
- R01 HL142992/HL/NHLBI NIH HHS/United States
- M01 RR007122/RR/NCRR NIH HHS/United States
- K01 HL129039/HL/NHLBI NIH HHS/United States
- R01 HL133870/HL/NHLBI NIH HHS/United States
- KL2 TR002490/TR/NCATS NIH HHS/United States
- R01 DA037904/DA/NIDA NIH HHS/United States
- S10 OD030463/OD/NIH HHS/United States
- R01 HL059684/HL/NHLBI NIH HHS/United States
- R01 MH078143/MH/NIMH NIH HHS/United States
- R21 HL123677/HL/NHLBI NIH HHS/United States
- R01 DK071891/DK/NIDDK NIH HHS/United States
- K01 HL130609/HL/NHLBI NIH HHS/United States
- T32 HL007374/HL/NHLBI NIH HHS/United States
- R01 AR063611/AR/NIAMS NIH HHS/United States
- R01 HL071205/HL/NHLBI NIH HHS/United States
- 75N92019D00031/HL/NHLBI NIH HHS/United States
- R03 HL154284/HL/NHLBI NIH HHS/United States
- UL1 TR000040/TR/NCATS NIH HHS/United States
- S10 OD020069/OD/NIH HHS/United States
- R01 MD012765/MD/NIMHD NIH HHS/United States
- N01 HC095166/HL/NHLBI NIH HHS/United States
- R01 HL151855/HL/NHLBI NIH HHS/United States
- F32 HL150992/HL/NHLBI NIH HHS/United States
- K23 HL138461/HL/NHLBI NIH HHS/United States
- R01 MH101244/MH/NIMH NIH HHS/United States
- UM1 DK078616/DK/NIDDK NIH HHS/United States
- UG3 HL151865/HL/NHLBI NIH HHS/United States
- R01 MH083824/MH/NIMH NIH HHS/United States
- U01 CA182913/CA/NCI NIH HHS/United States
- T32 CA154274/CA/NCI NIH HHS/United States
- U01 HG009088/HG/NHGRI NIH HHS/United States
- P42 ES016454/ES/NIEHS NIH HHS/United States
- P20 GM121334/GM/NIGMS NIH HHS/United States
- 75N92020D00006/HL/NHLBI NIH HHS/United States
- U01 DK105561/DK/NIDDK NIH HHS/United States
- UL1 TR001873/TR/NCATS NIH HHS/United States
- R01 HL117626/HL/NHLBI NIH HHS/United States
- N01 HC095162/HL/NHLBI NIH HHS/United States
- UL1 TR001881/TR/NCATS NIH HHS/United States
- R01 HL131565/HL/NHLBI NIH HHS/United States
- N01 HC095164/HL/NHLBI NIH HHS/United States
- N01 HC095165/HL/NHLBI NIH HHS/United States
- R13 CA124365/CA/NCI NIH HHS/United States
- P01 HL132825/HL/NHLBI NIH HHS/United States
- K01 HL146980/HL/NHLBI NIH HHS/United States
- U54 GM115428/GM/NIGMS NIH HHS/United States
- R01 HL118267/HL/NHLBI NIH HHS/United States
- U01 HL054495/HL/NHLBI NIH HHS/United States
- R01 HL071258/HL/NHLBI NIH HHS/United States
- R01 HL055673/HL/NHLBI NIH HHS/United States
- R01 HL149683/HL/NHLBI NIH HHS/United States
- R01 HL092301/HL/NHLBI NIH HHS/United States
- U01 HL054473/HL/NHLBI NIH HHS/United States
- P30 DK020595/DK/NIDDK NIH HHS/United States
- R01 HL149836/HL/NHLBI NIH HHS/United States
- K01 HL135405/HL/NHLBI NIH HHS/United States
- R03 OD030608/OD/NIH HHS/United States
- UM1 AI068636/AI/NIAID NIH HHS/United States
- R01 AG057381/AG/NIA NIH HHS/United States
- N01 HC095160/HL/NHLBI NIH HHS/United States
LinkOut - more resources
Full Text Sources
Other Literature Sources
