. 2022 Nov;19(11):1461-1471.
doi: 10.1038/s41592-022-01646-5. Epub 2022 Oct 27.

Sensitive genetically encoded sensors for population and subcellular imaging of cAMP in vivo

Affiliations

Sensitive genetically encoded sensors for population and subcellular imaging of cAMP in vivo

Crystian I Massengill et al. Nat Methods. 2022 Nov.

Abstract

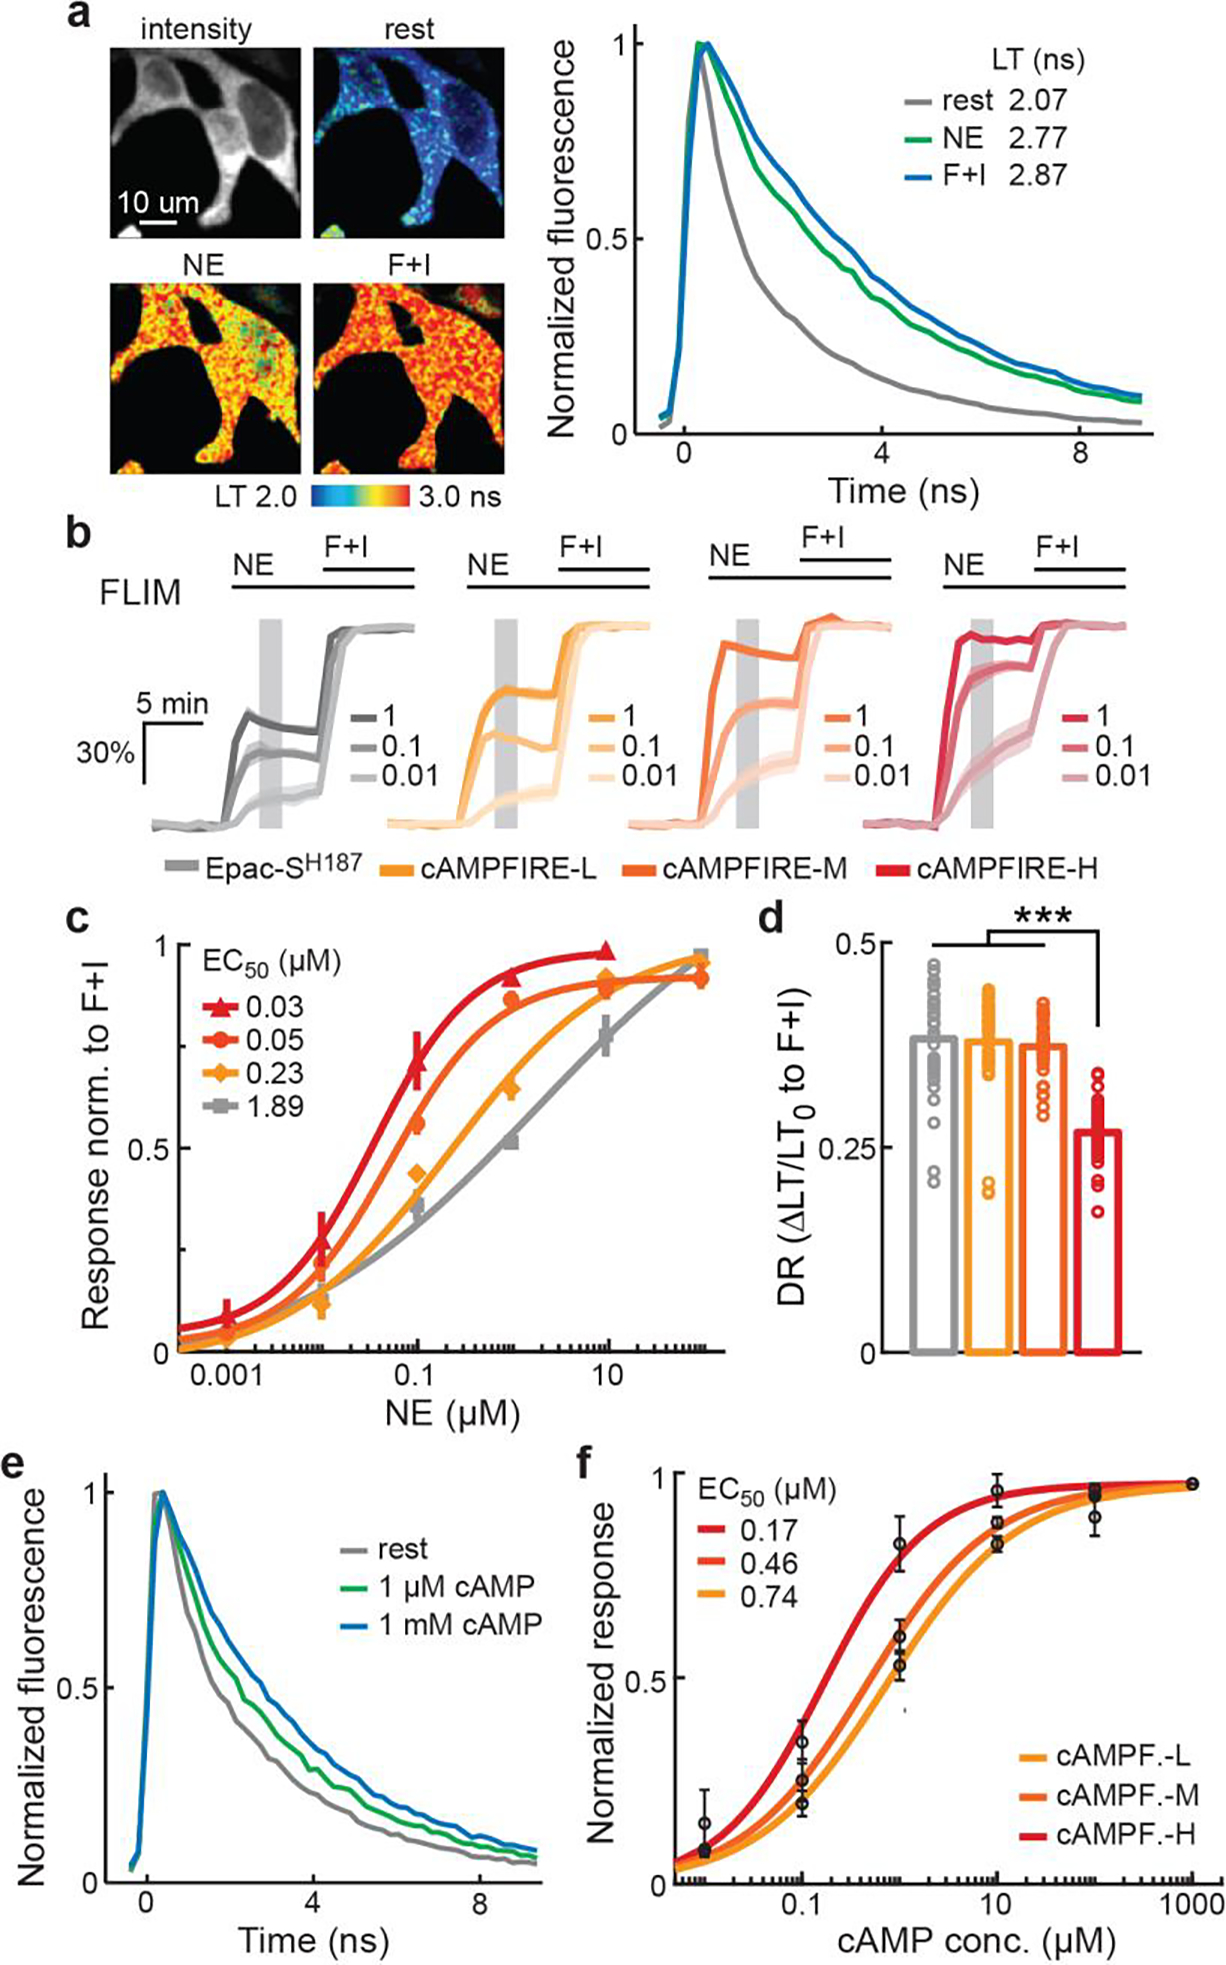
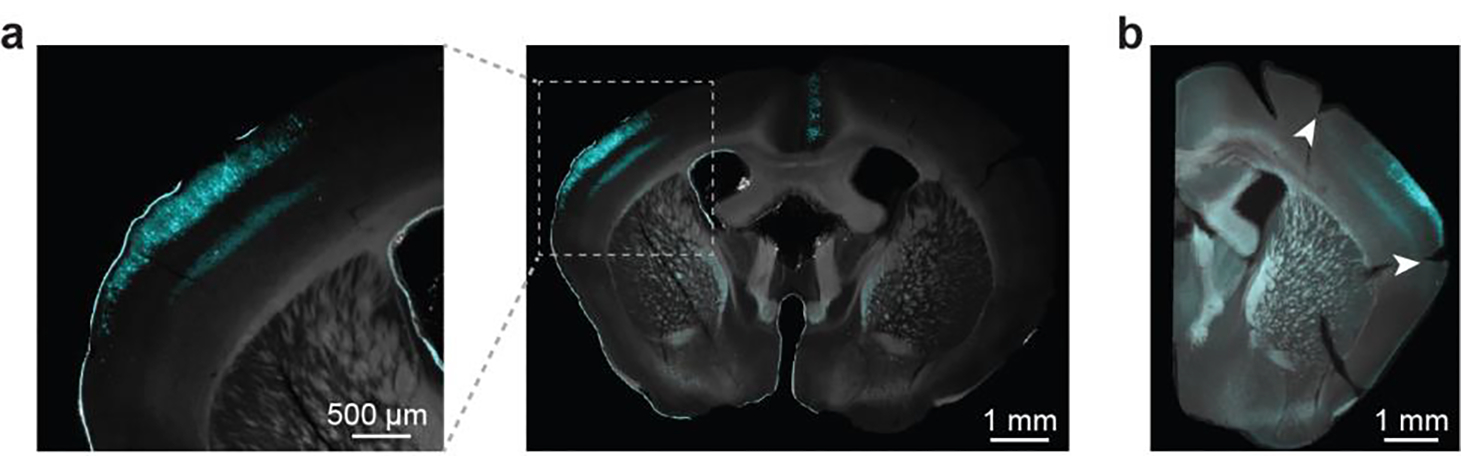
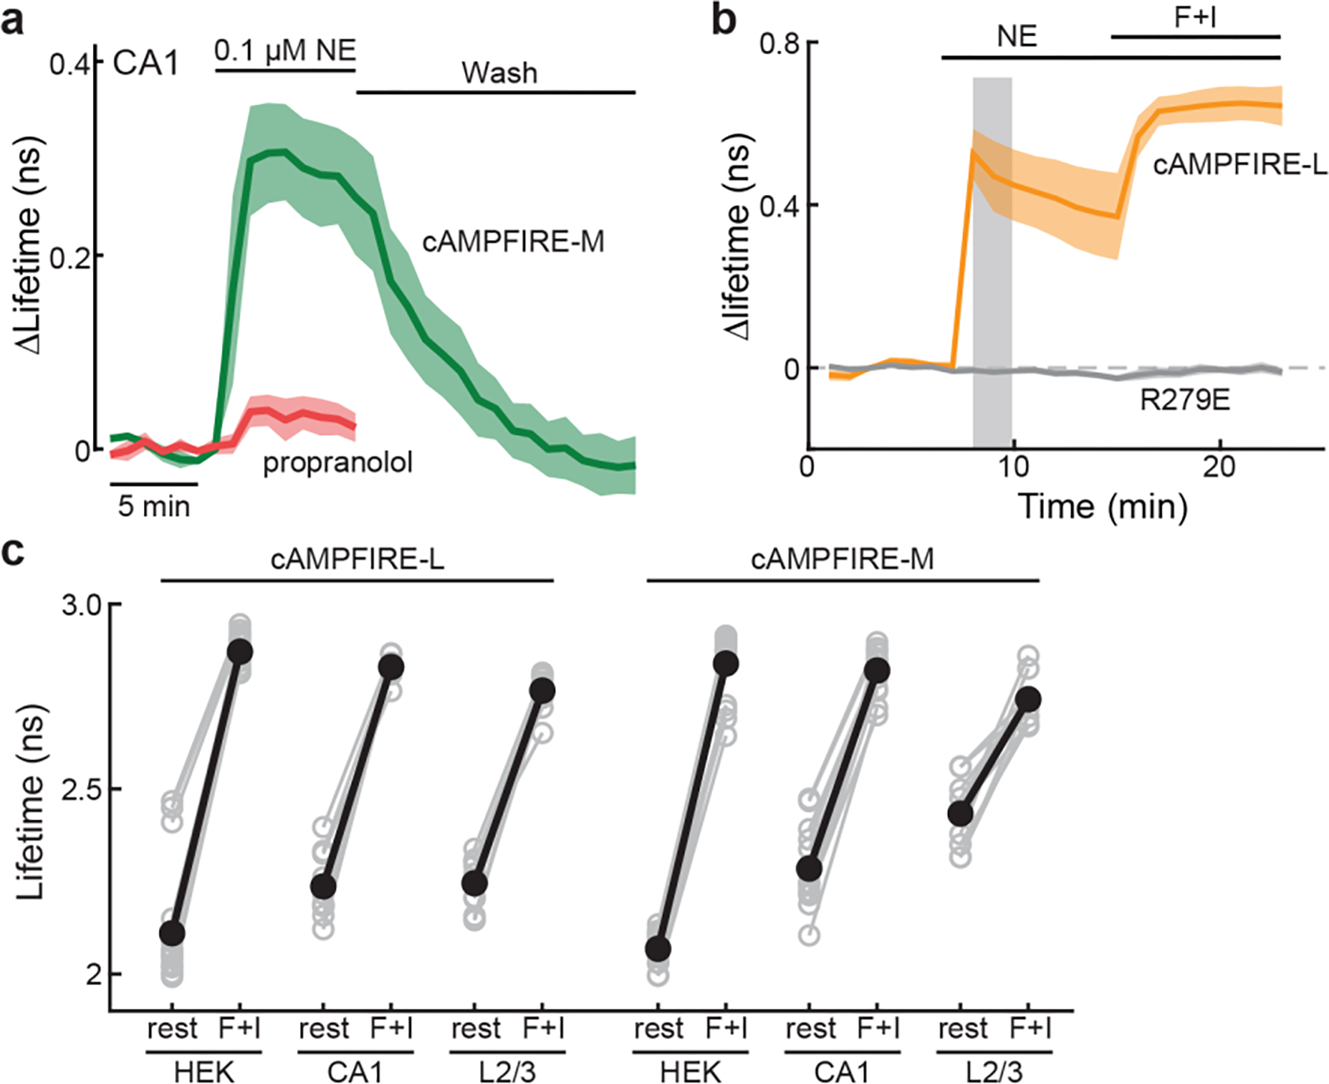
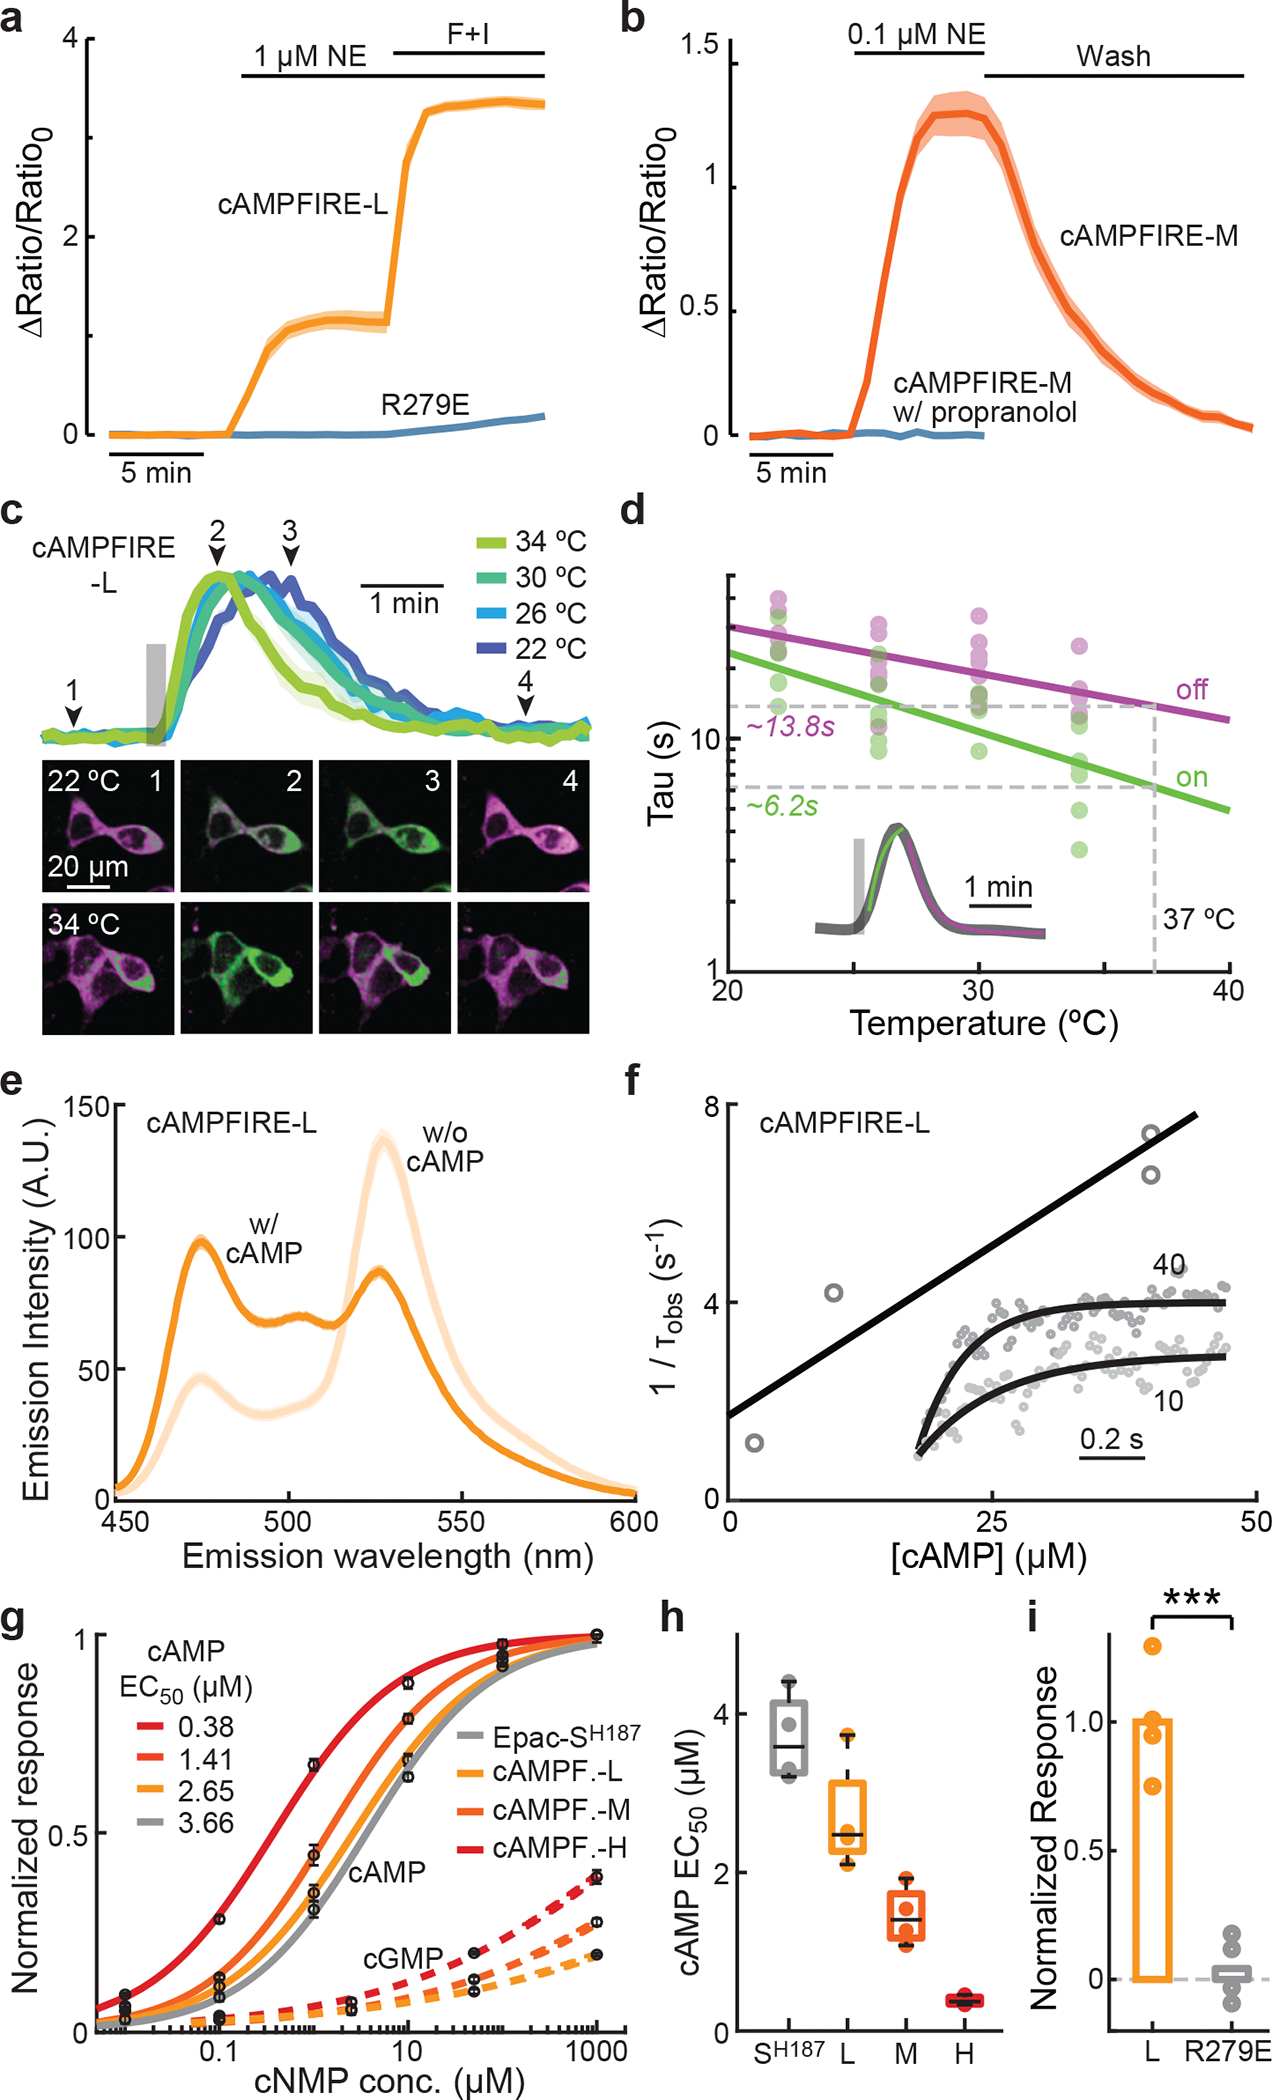
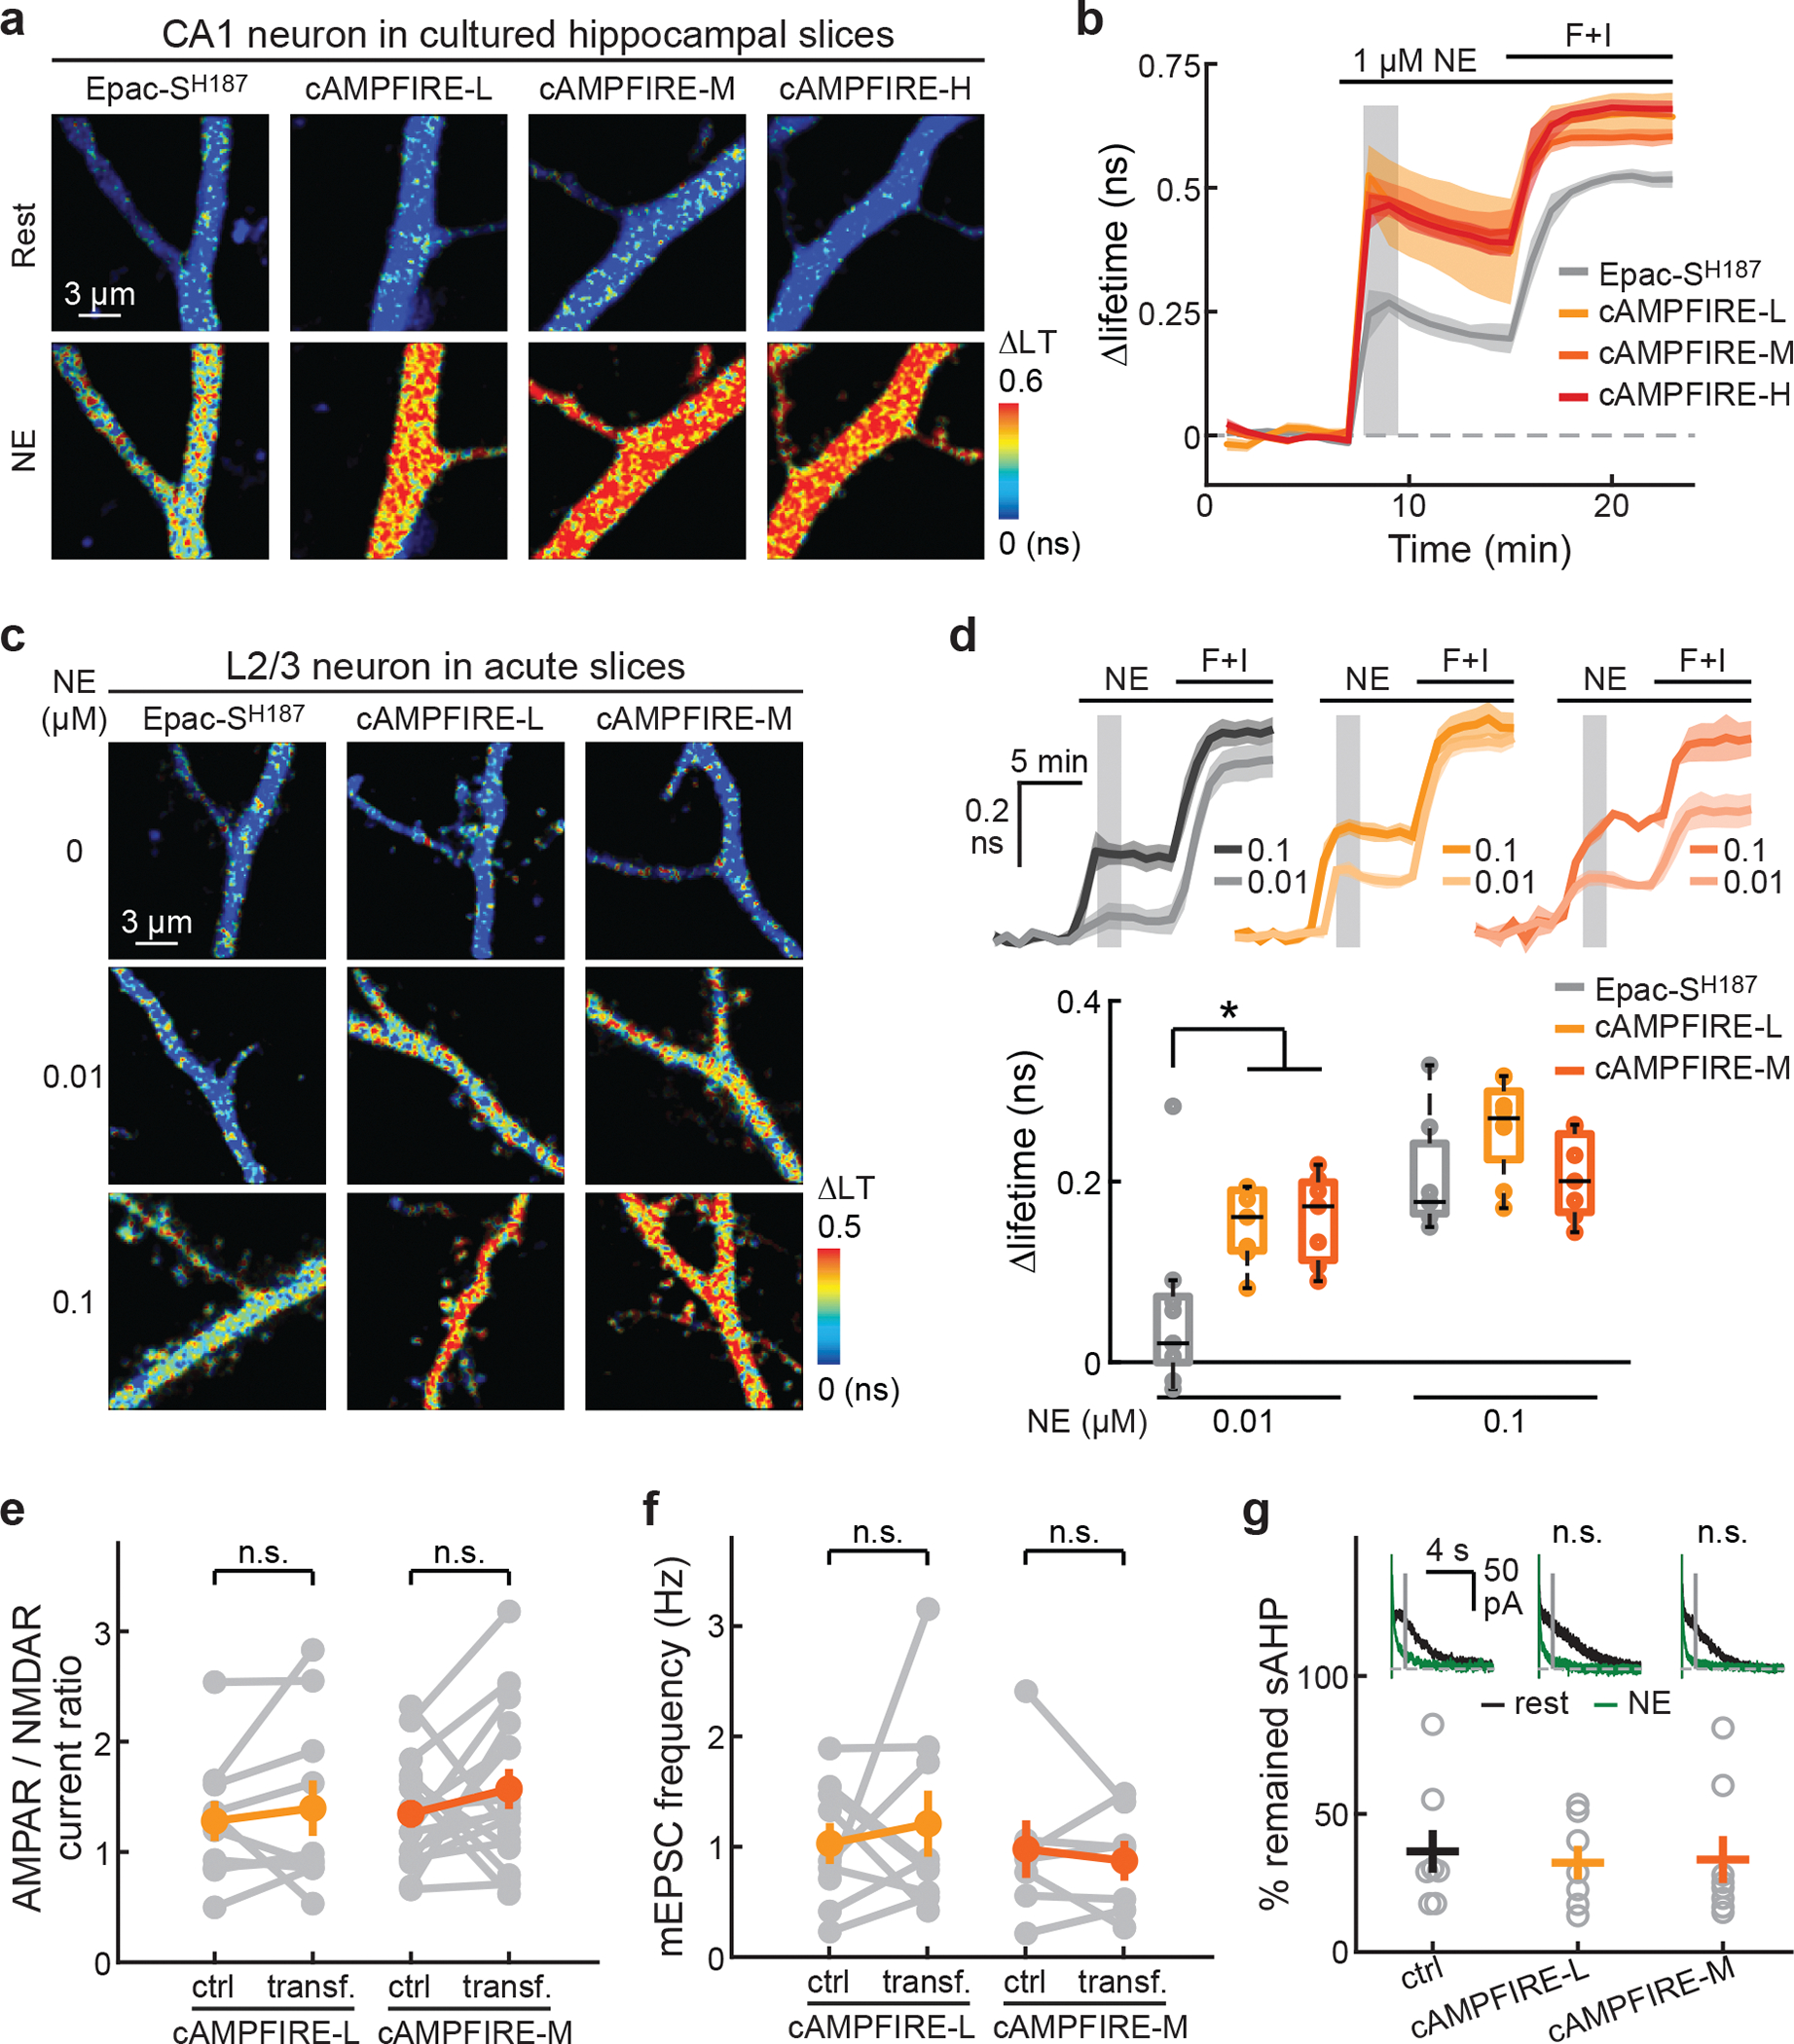
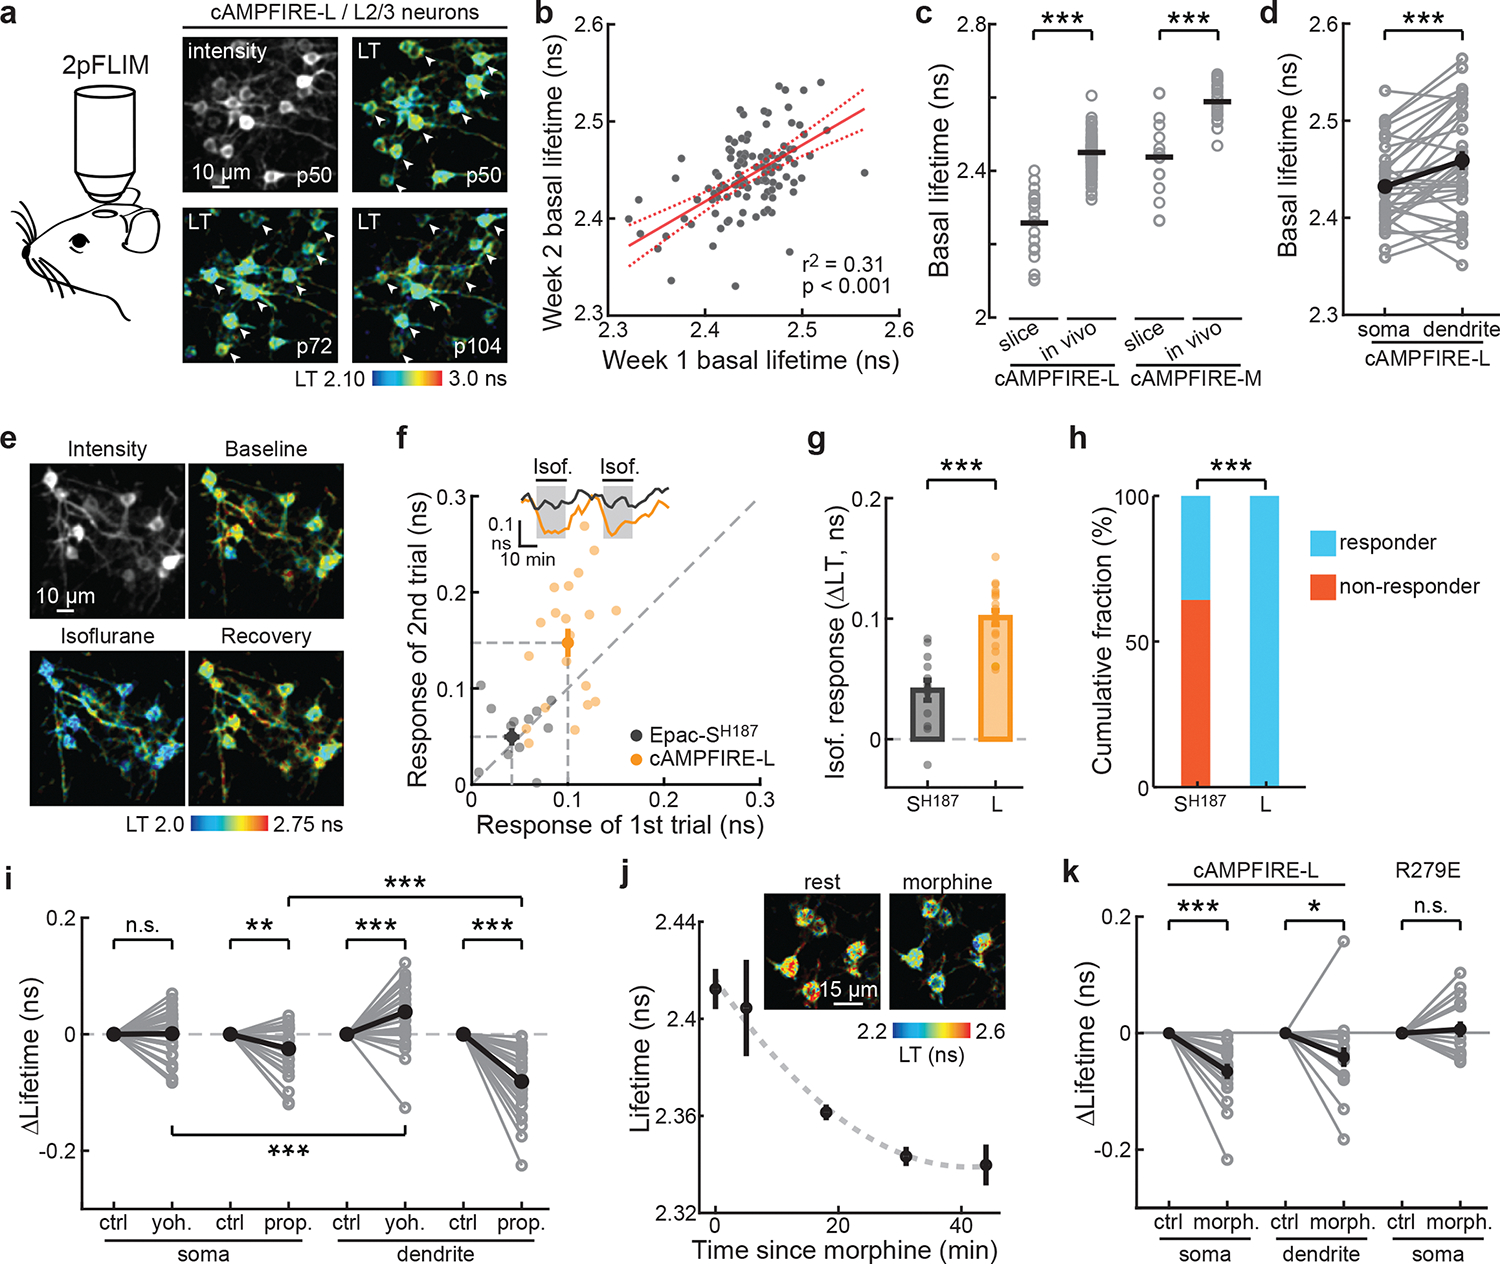
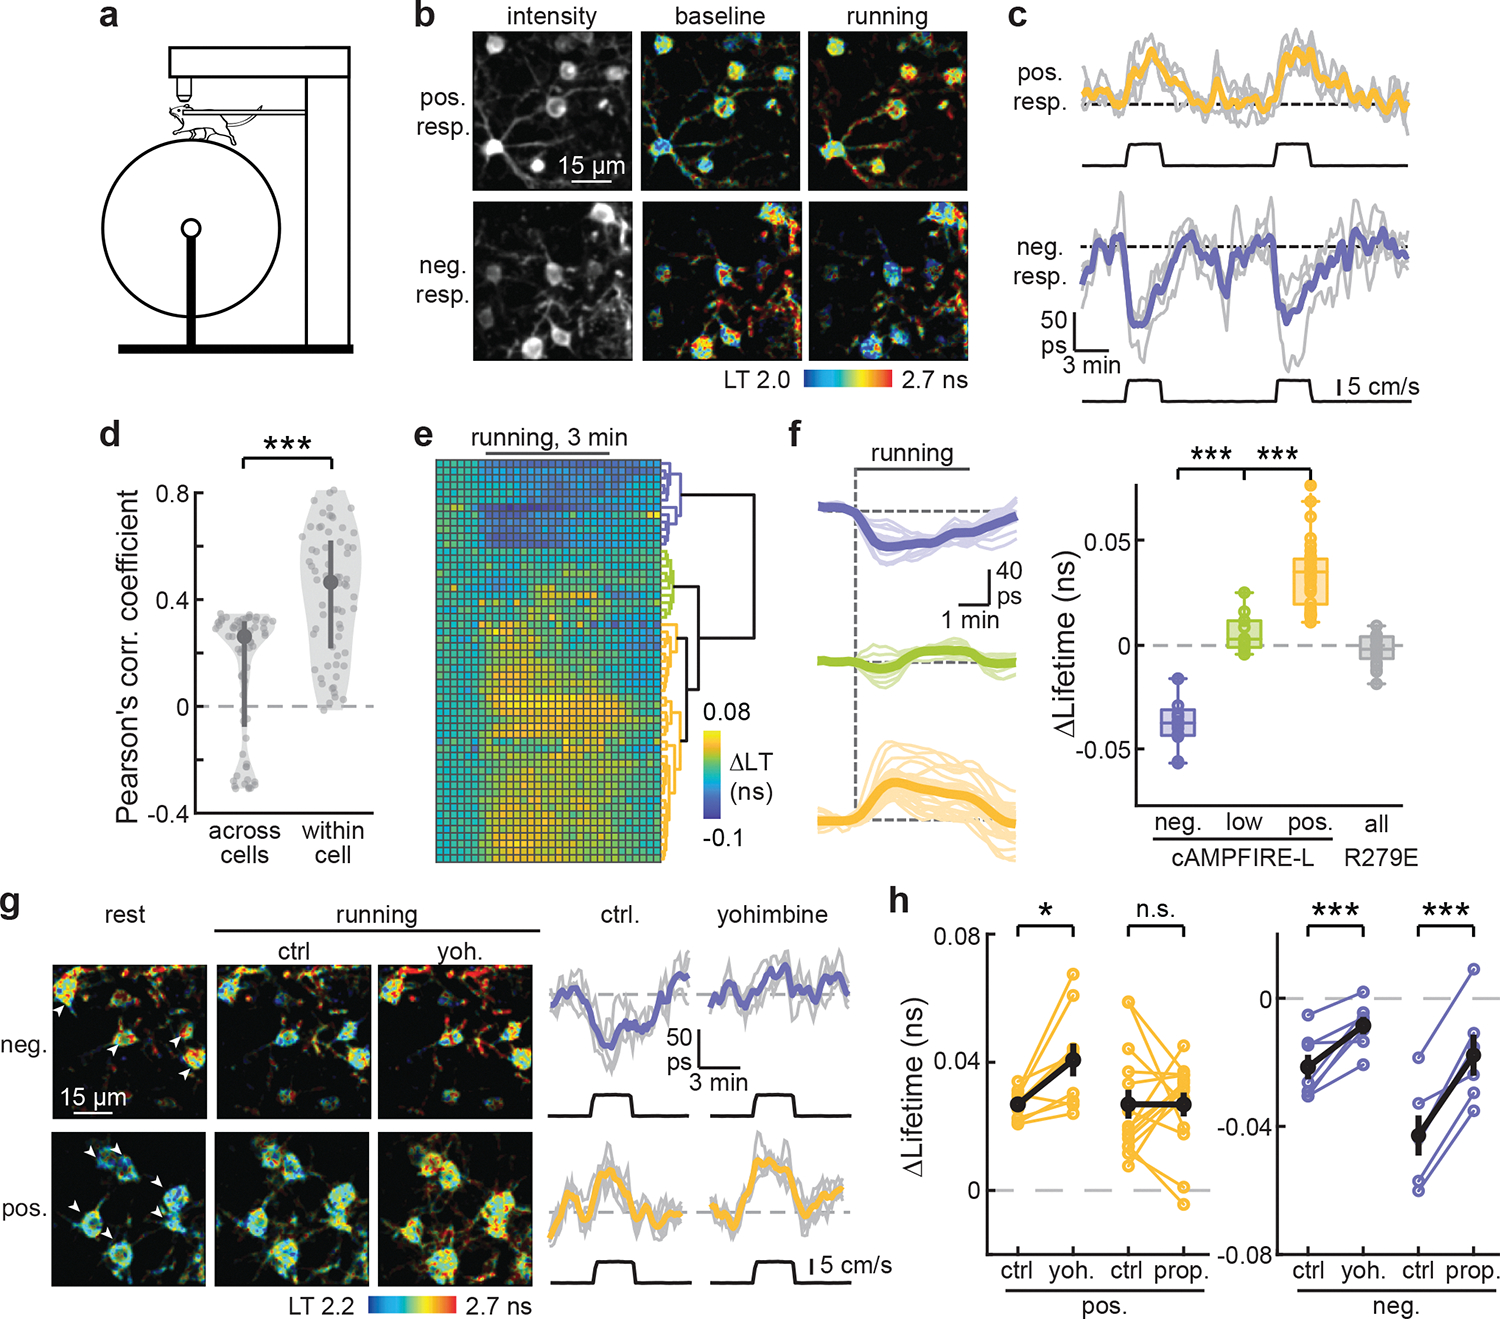
Cyclic adenosine monophosphate (cAMP) signaling integrates information from diverse G-protein-coupled receptors, such as neuromodulator receptors, to regulate pivotal biological processes in a cellular-specific and subcellular-specific manner. However, in vivo cellular-resolution imaging of cAMP dynamics remains challenging. Here, we screen existing genetically encoded cAMP sensors and further develop the best performer to derive three improved variants, called cAMPFIREs. Compared with their parental sensor, these sensors exhibit up to 10-fold increased sensitivity to cAMP and a cytosolic distribution. cAMPFIREs are compatible with both ratiometric and fluorescence lifetime imaging and can detect cAMP dynamics elicited by norepinephrine at physiologically relevant, nanomolar concentrations. Imaging of cAMPFIREs in awake mice reveals tonic levels of cAMP in cortical neurons that are associated with wakefulness, modulated by opioids, and differentially regulated across subcellular compartments. Furthermore, enforced locomotion elicits neuron-specific, bidirectional cAMP dynamics. cAMPFIREs also function in Drosophila. Overall, cAMPFIREs may have broad applicability for studying intracellular signaling in vivo.


Conflict of interest statement

Competing interests

The authors declare no competing interests.

Figures

Extended Data Figure 1.
Extended Data Figure 1.. Correcting the perinuclear localization of the Epac-SH187 sensor.
a, Crystal structure of the NPL sequence in Epac2A (top) and the alignment of NPL sequences between Epac1 with Epac2. The positions tested are highlighted in the structure (red) and at the alignment (asterisks). b, Representative images of the indicated mutants compared to Epac-SH187 in HEK cells. From left to right starting from the top, n (cells/coverslips) = 69/29, 50/5, 59/29, 18/3, 12/2, 12/2, 37/4. c, Response time course (left) and quantification of the response of indicated constructs to the indicated stimuli in HEK cells. From left to right, n = 20, 13, and 11. Dark lines and bars indicate mean. Shaded area indicates s.e.m. d, Representative images of the indicated mutant compared to Epac-SH187 in L2/3 pyramidal neurons. Single two-photon optical sections are shown. n (cells/mice) = 18/5 and 20/8 for Epac-SH187 and L777A/K778A, respectively.
Extended Data Figure 2.
Extended Data Figure 2.. Localization-correcting mutations reduce the tendency of the sensor to aggregate.
a & b, Representative images (a) and quantifications (b) of the number of aggregates per cell resulting from the indicated constructs. To ease the visualization of aggregates, saturated pixels (for display only) are showed in red. Single cpV: a sensor variant that is the same as Epac-SH187 with the exception that it only has a single cpVenus as the FRET acceptor. From left to right, n (cells) = 12, 58, 53, 48, and 41. Lines indicate mean. ***: p < 0.001 (from left to right, p = 3.3×10⁻¹⁰, 5.2×10⁻¹⁰ and 1.7×10⁻¹⁰) for all comparisons, two-tailed Welch test.
Extended Data Figure 3.
Extended Data Figure 3.. Candidate residues for tuning the affinity of cAMP binding.
a, Crystal structure analyses of the cAMP binding site of Epac2A suggests 10 positions that potentially affect the cAMP binding affinity. b, Alignment of a portion of the CNB domain of Epac1 with those of the CNG channel CNGA2 and CNGA3. Known positions at which mutations affect the affinity of the CNG channels to their ligand are shown (asterisks).
Extended Data Figure 4.
Extended Data Figure 4.. Responses of cAMPFIREs in absolute CFP/YFP ratios.
From left to right, n (cells) = 65, 53, 49, and 55. Black points indicate mean. The resting CFP/YFP ratios were (mean ± s.e.m): 0.164 ± 0.002 for Epac-SH187, and 0.222 ± 0.004 for cAMPFIRE-H; ***: p = 1.6×10⁻¹⁹, two-tailed Welch test.
Extended Data Figure 5.
Extended Data Figure 5.. pH dependence of cAMPFIRE responses.
Sensor signal (fluorescence ratio) in the absence (black; Apo) or presence (red) of 100 μM cAMP normalized to the dynamic range of the sensor at pH 7.3 under the same measurement conditions. Averaged data are presented as mean ± s.e.m. n = 3 measurements, each from a different protein aliquot, for each condition.
Extended Data Figure 6.
Extended Data Figure 6.. 2pFLIM characterizations of cAMPFIREs in HEK cells and as immunoprecipitated proteins.
a, Representative images and lifetime decay curves of cAMPFIRE-M in HEK cells in the presence of the indicated stimuli. Representative of 10 cells from 4 coverslips. b & c, 2pFLIM response traces (b), and NE concentration-response curves in HEK cells fitted by the Hill equation (c), of Epac-SH187 and cAMPFIRE-L, M, and H in HEK cells. Hill coefficients = 0.32, 0.51, 0.79, and 0.84, respectively, for Epac-SH187 and cAMPFIRE-L, M, and H. From low to high concentrations, the n (cells) is: for cAMPFIRE-L, 8, 8, 8, 13, 8, and 8; for cAMPFIRE-M, 6, 8, 8, 10, 9, and 8; for cAMPFIRE-H, 8, 14, 7, 11, and 8; and for Epac-SH187, 9, 8, 11, 4, and 8. Dark lines and shaded areas in panel b, and points and error bars in panel c indicate mean and s.e.m., respectively. d, 2pFLIM response amplitudes of each sensor in HEK cells elicited by 25 μM forskolin and 50 μM IBMX. From left to right, n (cells) = 32, 45, 41, and 48. Bars indicate mean. ***: p < 0.001 for all comparisons, from left to right, p = 1.7×10⁻¹⁸, 1.1×10⁻²⁸, and 8.2×10−39, dF = 35, 53, and 60, two-tailed Welch test. e, Representative lifetime decay curves of cAMPFIRE-L immunoprecipitated onto Protein A agarose beads in the presence of the indicated cAMP concentrations. Representative of 3 beads. f, 2pFLIM concentration-response curves of cAMPFIRE proteins immunoprecipitated onto Protein A agarose beads in response to cAMP. Points and error bars indicated mean and s.e.m., respectively. For cAMPFIRE-L, -M, and -H, respectively, n = 3, 4 and 4 beads; Hill coefficients = 0.65, 0.68, and 0.82.
Extended Data Figure 7.
Extended Data Figure 7.. Transfection and imaging of L2/3 neurons in the somatosensory cortex.
a, Example brain slice images (representative of 21 mice) from a mouse transfected with cAMPFIRE-L via in utero electroporation. The sensor-transfected neurons are shown in cyan. b, A post hoc coronal section from an experimental mouse (representative of 7 mice) showing the edge of cranial window (arrowheads), which was marked during perfusion and dissection of the brain. The window was implemented on comparable coordinates for all experimental mice.
Extended Data Figure 8.
Extended Data Figure 8.. Characterizations of cAMPFIRE responses in neurons.
a, Response traces of cAMPFIRE-M in CA1 neurons in cultured hippocampal slices to 0.1 μM norepinephrine in the absence or presence of 1 μM propranolol, followed by wash. n (cells) = 4 for both. Dark lines indicate mean and shaded areas indicate s.e.m. b, Response traces of cAMPFIRE-L and its R279E mutant in CA1 neurons in cultured hippocampal slices to 1 μM norepinephrine. cAMPFIRE-L data are the same as those in Fig. 5b. n (cells) = 5 for R279E mutant. Dark lines indicate mean and shaded areas indicate s.e.m. c, 2pFLIM responses in absolute values of cAMPFIRE-L and cAMPFIRE-M to forskolin and IBMX in different cell types, indicating that different cell types exhibit different baseline and dynamic ranges. From left to right, n (cells) = 21, 10, 12, 18, 16, and 10. Black points indicate mean.
Extended Data Figure 9.
Extended Data Figure 9.. Additional electrophysiological characterizations of cAMPFIREs in CA1 neurons.
a & b, Quantification of the elicited AMPAR and NMDAR currents (in pA) of CA1 neurons transfected with cAMPFIRE-L or cAMPFIRE-M compared to adjacent untransfected control neurons. For both, n = 10 neuronal pairs for cAMPFIRE-L and 16 for cAMPFIRE-M. Blue points and error bars indicate mean and s.e.m., respectively. c & d, example traces (c), and amplitudes (d) of mEPSCs (n = 9 for -L and 7 for -M) of CA1 neurons transfected with cAMPFIRE-L and cAMPFIRE-M compared to adjacent untransfected control neurons. e, Quantification of the paired pulsed ratio (n = 11 for -L and 15 for -M) of CA1 neurons transfected with cAMPFIRE-L and cAMPFIRE-M compared to adjacent untransfected control neurons. n.s.: not significant, paired two-tailed Student’s t-test. Colored points and error bars indicate mean and s.e.m., respectively. For panels d and e from left to right, p = 0.55, 0.87, 0.12, and 0.42, dF = 8, 6, 10 and 14.
Extended Data Figure 10.
Extended Data Figure 10.. cAMPFIREs detect cAMP responses in Drosophila larvae
. a, Schematic showing experimental setup. Larvae were dissected to expose the intact central nervous system (boxed region) and imaged with a water immersion objective. b & c, Average traces (b) and collective responses measured from the gray shaded area in panel b (c) of abdominal leucokinin neuronal somas expressing cAMPFIRE-M following application of forskolin (40 μM) or DMSO-only control. In panel b, Dark lines indicate mean and shaded areas indicate s.e.m. Arrowhead indicates time of bath application. Bars indicate mean. ***: p = 1.1×10⁻⁵, two-tailed Wilcoxon Rank-Sum test. n = 10 larvae per condition. d & e, Average traces (d) and collective responses measured from gray shaded area in panel d (e) of fly larval nociceptive axon terminals in response to bath application of AITC (allyl isothiocyanate; 2.5 mM) followed by forskolin (40 μM) and IBMX (100 μM). AITC is a stimulant for larval nociceptors. Dark lines indicate mean and shaded areas indicate s.e.m. Bars indicate mean. n.s.: not significant (p = 0.49), *: p = 0.049, **: p = 0.0048, two-tailed one-way ANOVA with Tukey’s multiple comparisons. n = 6 larvae per condition.
Fig. 1.
Fig. 1.. Screening of existing cAMP sensors.
a, General schematic of FRET-based and intensity-based cAMP sensors. b, Schematics of the cAMP sensors tested. Epac1CNB and Epac2CNBB: CNB-B domain of Epac1 and Epac2, respectively; CitN and CitC: residue 1–144 and 146–238 of Citrine, respectively; mAN and mAC: residues 1–150 and 151–236 of mApple, respectively; PKA-CAT: PKA catalytic subunit α; RIα91–244, RIα93–218, and RIα219–381: residues 91–244, 93–218, and 219–381, respectively, of PKA regulatory subunit Iα; cp: circularly permutated. c, Representative images of the tested sensors at rest, after stimulation with NE (1 μM), and followed by 25 μM forskolin and 50 μM IBMX (F + I). CFP and YFP ratiometric images are shown as a pseudocolored green (CFP) and magenta (YFP) overlay. To compare across cells, for ratiometric images, the same ratio of intensity setting was used for image display across sensors; whereas intensity images were adjusted according to the brightest state. d & e, Averaged response (ΔR/R0, or ΔF/F0) traces (d) and quantifications at the grayed time window in panel d (e) of each sensor. From left to right, n (cells) = 5, 4, 6, 16, 5, 10, 10, 10. Dark line and shaded area indicate average and s.e.m. respectively. Bars indicate mean.
Fig. 2.
Fig. 2.. Developing cAMPFIREs.
a, Schematic domain organization of Epac2A, Epac1, and Epac-SH187. CNB, cyclic nucleotide binding domain; DEP, Dishevelled, Egl-10, Pleckstrin and domain; REM, Ras-exchange motif; RA, ras-association domain; CDC25-HD, CDC25 homology domain; NPL, nuclear pore localization sequence. b, The crystal structure of Epac2A in the cAMP-unbound conformation (Protein data bank #2byv). c, Representative images of Epac-SH187 and the L777A/K778A mutant in HEK cells. d, Fluorescence intensity along the dashed line in panel c, normalized to cytosolic average. e, Collective tendency of perinuclear localization, as assayed by dividing the peak intensity near nucleus to the respective cytosol intensity. n = 8 for Epac-SH187, and 10 for L777A/K778A. ***: p < 0.001 (5.8×10⁻⁴), dF = 7.1, two-tailed Welch test. f, Representative two-photon images of Epac-SH187 and the L777A/K778A mutant (green) contrast with a red cytosolic marker mRuby3 (magenta) expressed in CA1 neurons of cultured hippocampal slices (representative of 26 and 29 neurons, respectively). g, Table illustrating the mutations in each cAMPFIRE variant as compared to the parental sensor. h, The fold changes in the response of screened variants to 1 μM norepinephrine relative to Epac-SH187. n = 2–20 cells each (see Supplementary Notes 1 for exact numbers). Bars and error bars indicate mean and s.e.m, respectively. ik, Representative ratiometric images (i), response traces normalized to the corresponding responses elicited by forskolin and IBMX (j), and concentration-response curves to norepinephrine fitted by the Hill equation (k) in HEK cells. Hill coefficients = 0.58, 0.99, 0.89, and 0.73, respectively, for Epac-SH187 and cAMPFIRE-L, -M, and -H. n = 4–14 cells for each sensor and concentration data point (see Supplementary Notes 2 for exact numbers). In panel j, dark lines and shaded areas, and in panel k, points and error bars indicate mean and s.e.m respectively. l, Response amplitudes elicited by forskolin and IBMX. DR: dynamic range. From left to right, n (cells) = 52, 45, 41, and 55. Bars represent mean. ***: p < 0.001 (0 for all three comparisons) and *: p < 0.05 (0.03), dF = 3, one-way ANOVA (p = 2×10⁻¹⁴), Tukey-Kramer post-hoc test.
Fig. 3.
Fig. 3.. Characterization of cAMPFIREs in HEK cells and as purified proteins.
a, Response traces of cAMPFIRE-L and its cAMP-binding mutant (R279E) to the indicated stimulus. Dark lines and shaded areas indicate mean and s.e.m, respectively. n (cells) = 8 and 11 for cAMPFIRE-L and R279E, respectively. b, Response traces of cAMPFIRE-M to 0.1 μM norepinephrine followed by wash, in the absence or presence of propranolol. Dark lines and shaded areas indicate mean and s.e.m., respectively. n (cells) = 8 for both. c & d, Representative traces and images (c), and collective results with fitting (d) of the on and off kinetics of cAMPFIRE-L in HEK cells in response to a short pulse (10 s) of norepinephrine puff (gray bar). n = 5–6 for each condition. Inset in panel d shows a representative response trace with fits overlaid on top. e, Emission spectrum of purified cAMPFIRE-L protein in the presence or absence of cAMP (1 mM). Average of 3. Excitation at 430 nm. f, Example kinetic traces of purified cAMPFIRE-L responding to 10 and 40 μM cAMP (inset) and fit of the apparent time constant (τobs) for determining kon and koff. g & h, Concentration-response curves to cAMP and cGMP (g), and cAMP EC50 values (h) of the cAMPFIRE sensors compared to the parental sensor. n = 4 beads each. In panel g, points and error bars indicated mean and s.e.m., respectively. For the fit, Hill coefficients = 0.61, 0.63, 0.67, and 0.64, respectively, for Epac-SH187, and cAMPFIRE-L, -M, and -H. In panel h, boxes indicate 25th and 75th percentile, with black lines indicating median and whiskers indicating total range of data. i, Comparison of response to 10 μM cAMP of cAMPFIRE-L and its R279E mutation normalized to that of cAMPFIRE-L. n = 4 beads each. ***: p < 0.001 (3.1×10⁻⁴), dF = 7.4, two-tailed Welch test.
Fig. 4.
Fig. 4.. Characterization of cAMPFIREs in neurons from brain slices.
A & b, Representative 2pFLIM images (a) and response traces (b) of cAMPFIREs and their parental sensor to the indicated stimuli. N (neurons) = 5, 3, 8, and 5 for Epac-SH187, cAMPFIRE-L, -M, and -H, respectively. Dark lines and shaded areas indicate mean and s.e.m, respectively. Compared to Epac-SH187, p < 0.01 (p = 0.009 and 0.0013, dF = 6 and 11, respectively) for cAMPFIRE-L and -M and p < 0.001 (p = 4.2×10⁻⁴, dF = 8) for cAMPFIRE-H at shaded time points, two-tailed unpaired Student’s t-test. LT: lifetime. c & d, Representative 2pFLIM images (c), and response traces and quantifications (d) of the indicated sensors to the indicated stimulus. From left to right on the lower plot, n (neurons) = 9, 7, 7, 7, 8, and 7. *: p < 0.05 (0.03 and 0.02, respectively), dF = 14 for both, two-tailed unpaired Student’s t-test. Dark lines and shaded area in the upper plot indicate mean and s.e.m., respectively. In lower plot, boxes indicate 25th and 75th percentile, with black lines indicating mean and whiskers indicating total range of data, excluding outliers. e & f, Quantification of the AMPAR/NMDAR current ratio (e; n = 10 for cAMPFIRE-L and 16 for cAMPFIRE-M) and mEPSC frequency (f) of CA1 neurons transfected with cAMPFIRE-L and cAMPFIRE-M compared to adjacent untransfected control neurons. From left to right, n (neurons) = 10, 16, 9 and 7; p = 0.49, 0.28, 0.61, and 0.60; dF = 9, 15, 8, and 6. n.s.: not significant, paired two-tailed Student’s t-test. Colored points and error bars indicate mean and s.e.m., respectively. g, Representative traces (insets) and collective results of remaining sAHP current of CA1 neurons, untransfected (ctrl) or transfected as indicated, in response to 30 nM norepinephrine. The averaged data were presented as mean ± s.e.m. From left to right, n = 8, 7, 8. n.s.: not significant, cf. ctrl; p = 0.69 and 0.80, and dF = 13 and 14 for cAMPFIRE-L and -M, respectively; two-tailed Student’s t-test.
Fig. 5.
Fig. 5.. cAMPFIREs enable longitudinal in vivo imaging.
a, Schematic 2pFLIM imaging in awake mice, and representative images (representative of 14 fields of view from 5 mice). LT: lifetime. Arrowheads: the same cells across images. b, Correlation of cellular basal lifetimes imaged 5–8 days apart. n (cells) = 113. The linear fit (solid line) and its 95% confidence intervals (dashed lines) are shown. c, Basal lifetimes of cAMPFIRE-L and M in vivo and in acute slices. From left to right, n (cells) = 20, 151, 10, and 25. Horizontal lines indicate mean. ***: p < 0.001 (4.6×10⁻⁴ and 3.7×10⁻⁴), two-tailed Welch test, dF = 11.7 and 11.2 for cAMPFIRE-L and -M, respectively. d, Basal lifetimes of somas versus dendrites. n (cells/mice) = 34/9. Black points and error bars indicate mean and s.e.m. respectively. ***: p < 0.001 (3.3×10⁻⁴), dF = 33, paired two-tailed Student’s t-test. e, Representative in vivo images (representative of 3 mice) of cAMPFIRE-L responding to isoflurane administration. fh, Example traces (inset) and correlation (f), and collective amplitudes (g) and percentage responders (h) of the first trial of Epac-SH187 and cAMPFIRE-L in L23 neurons responding to isoflurane. n (cells/mice) = 13/3 for Epac-SH187, and 20/3 for cAMPFIRE-L. Bars and error bars indicate mean and s.e.m., respectively. ***: p < 0.001. For g, p = 8.2×10⁻⁷, dF = 31, two-tailed unpaired Student’s t-test; for h, p = 5.0×10⁻⁹, two-tailed binominal test. i, Soma and dendrite-specific cAMPFIRE-L response to yohimbine (yoh.) and propranolol (prop.). n (cells/mice) = 31/7 for yohimbine, and 32/6 for propranolol. Black points indicate mean. **: p < 0.01, ***: p < 0.001, paired, two-tailed Student’s t-test. For comparison with respective controls, from left to right, p = 0.88, 0.0012, 2.5×10⁻⁴, and 1.1×10⁻⁹; dF = 30, 31, 30, and 31. For comparison between somas and dendrites, p = 4.8×10⁻⁴ (dF = 30) and 1.8×10⁻⁶ (dF = 31) for yohimbine and propranolol, respectively. j & k, Representative images (inset in j), onset time course (j), and lifetime changes in soma and dendrites (k) of morphine administration. Averaged data are presented as mean ± s.e.m. n (cells/mice) = 17/4 for cAMPFIRE-L and 15/2 for R279E. *: p < 0.05, ***: p < 0.001, paired, two-tailed Student’s t-test; from left to right, p = 1.4×10⁻⁴, 0.03 and 0.6, dF = 16, 16, and 14.
Fig. 6.
Fig. 6.. cAMPFIRE-L detects heterogeneous cAMP response to enforced running.
a, Schematic of the enforced running behavioral paradigm. b & c, Representative images (b) and example response traces and their averages (c) of cAMPFIRE-L in positively and negatively responding L23 cells in response to enforced running. Colored lines indicate average response. Black lines indicate running speed. d, Quantification of between-cell and within-cell correlation of cAMPFIRE-L responses to enforced running. n (cells/mice) = 60/7. Dark gray points indicate median and vertical lines indicate 25th and 75th percentile. Shaded area reflects distribution of data. ***: p < 0.001 (3.4×10⁻¹²), dF = 116, Mann Whitney U test. e, Hierarchical clustering of cell-specific responses to 3-min running bouts. f, The average (bold lines) and individual (thin lines) traces and quantifications of response amplitudes from cells within each cluster in panel e. The collective response amplitudes of R279E mutant are also shown. From left to right, n (cells/mice) = 12/6, 10/4, 33/4 and 21/3. Boxes indicate 25th and 75th percentile, middle line indicates median and whiskers indicate range of data excluding outliers. **: p < 0.01 and ***: p < 0.001, dF = 3, one-way ANOVA (p = 1.6×10⁻²²) with Tukey Kramer post-hoc test (p = 0 for the indicated comparisons). g, Representative images, and the average and individual traces (individual traces corresponding to arrowheads in the image) of running induced response in positively and negatively responding cells before and after the administration of yohimbine. h, Changes of enforced running-elicited cAMP responses to intraperitoneal injection of the indicated drugs. Yoh.: yohimbine; and prop.: propranolol. From left to right, p = 0.013, 0.99, 0.0075, and 6.8×10⁻⁴, paired two-tailed t-test, n (cells/mice) = 9/3, 14/3, 7/3, and 6/2, and dF = 8, 13, 6, and 5. Black points indicated mean and error bars indicate s.e.m. *: p < 0.05, ***: p < 0.001.

References

    1. Berman HM et al. The cAMP binding domain: An ancient signaling module. Proc. Natl. Acad. Sci. U. S. A. 102, 45–50 (2005). - PMC - PubMed
    1. Dunn TA & Feller MB Imaging second messenger dynamics in developing neural circuits. Developmental Neurobiology vol. 68 835–844 (2008). - PMC - PubMed
    1. Greengard P The neurobiology of slow synaptic transmission. Science vol. 294 (2001). - PubMed
    1. Beavo JA & Brunton LL Cyclic nucleotide research — still expanding after half a century. Nat. Rev. Mol. Cell Biol. 3, 710–717 (2002). - PubMed
    1. Chen Y et al. Endogenous Gαq-Coupled Neuromodulator Receptors Activate Protein Kinase A. Neuron 96, 1070–1083.e5 (2017). - PMC - PubMed

Publication types

Substances

LinkOut - more resources