. 2022 Nov;25(11):1528-1542.
doi: 10.1038/s41593-022-01180-9. Epub 2022 Oct 27.

CRISPRi screens in human iPSC-derived astrocytes elucidate regulators of distinct inflammatory reactive states

Affiliations

CRISPRi screens in human iPSC-derived astrocytes elucidate regulators of distinct inflammatory reactive states

Kun Leng et al. Nat Neurosci. 2022 Nov.

Abstract

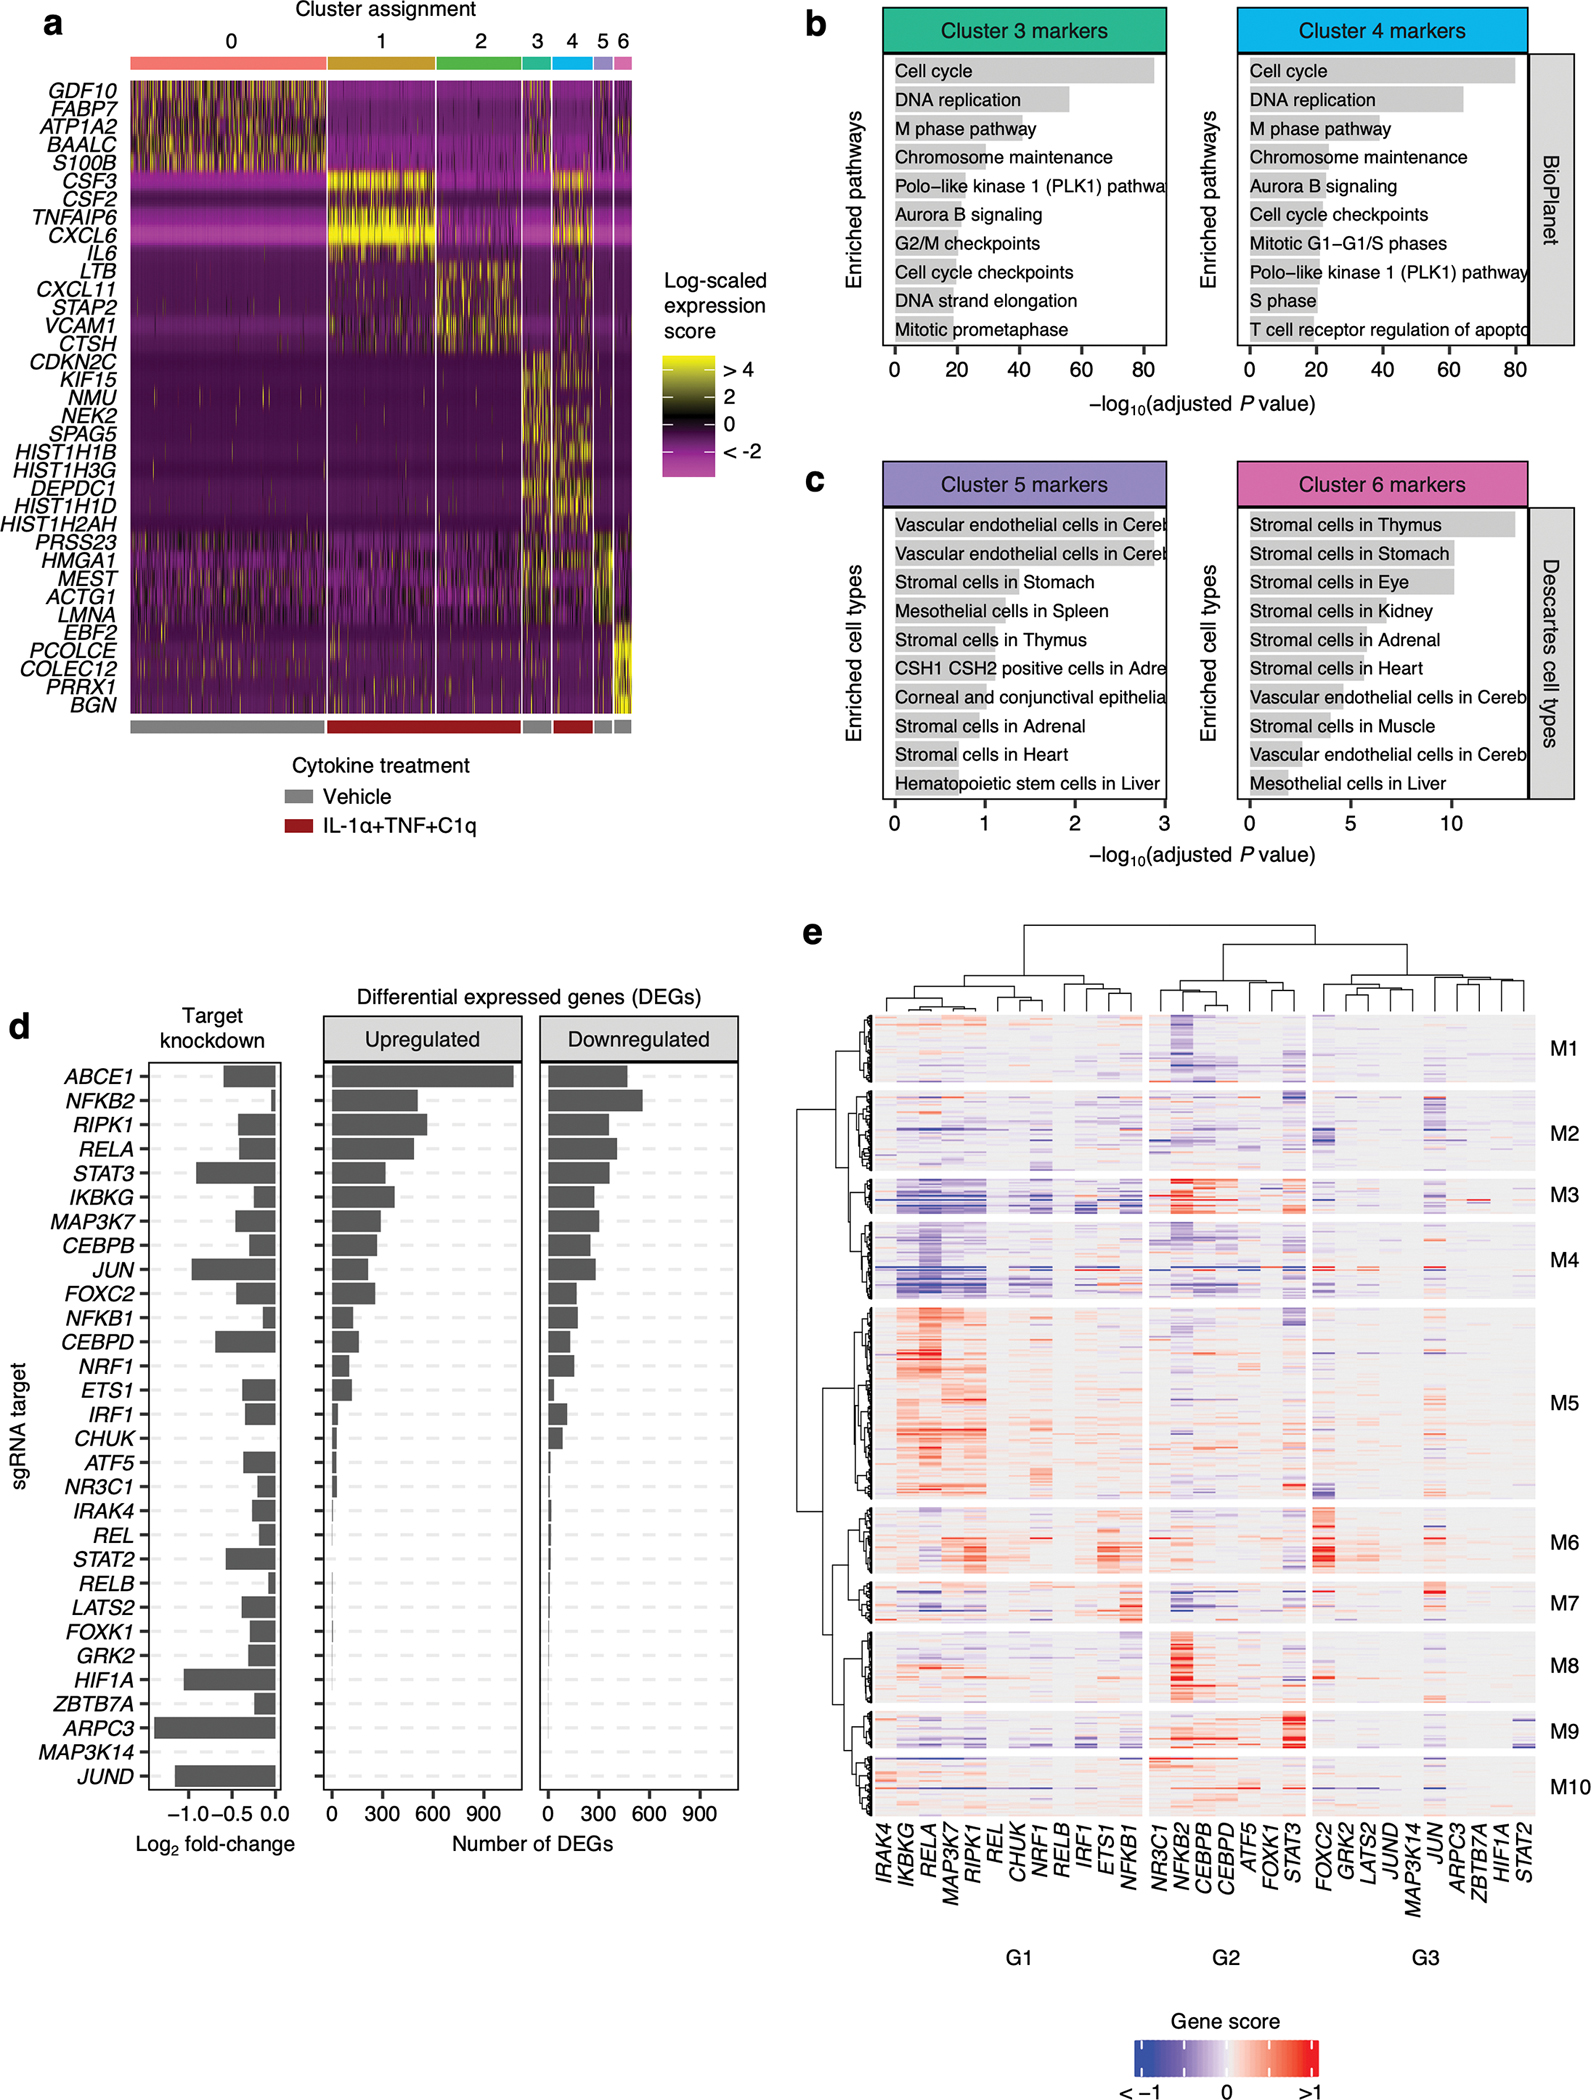
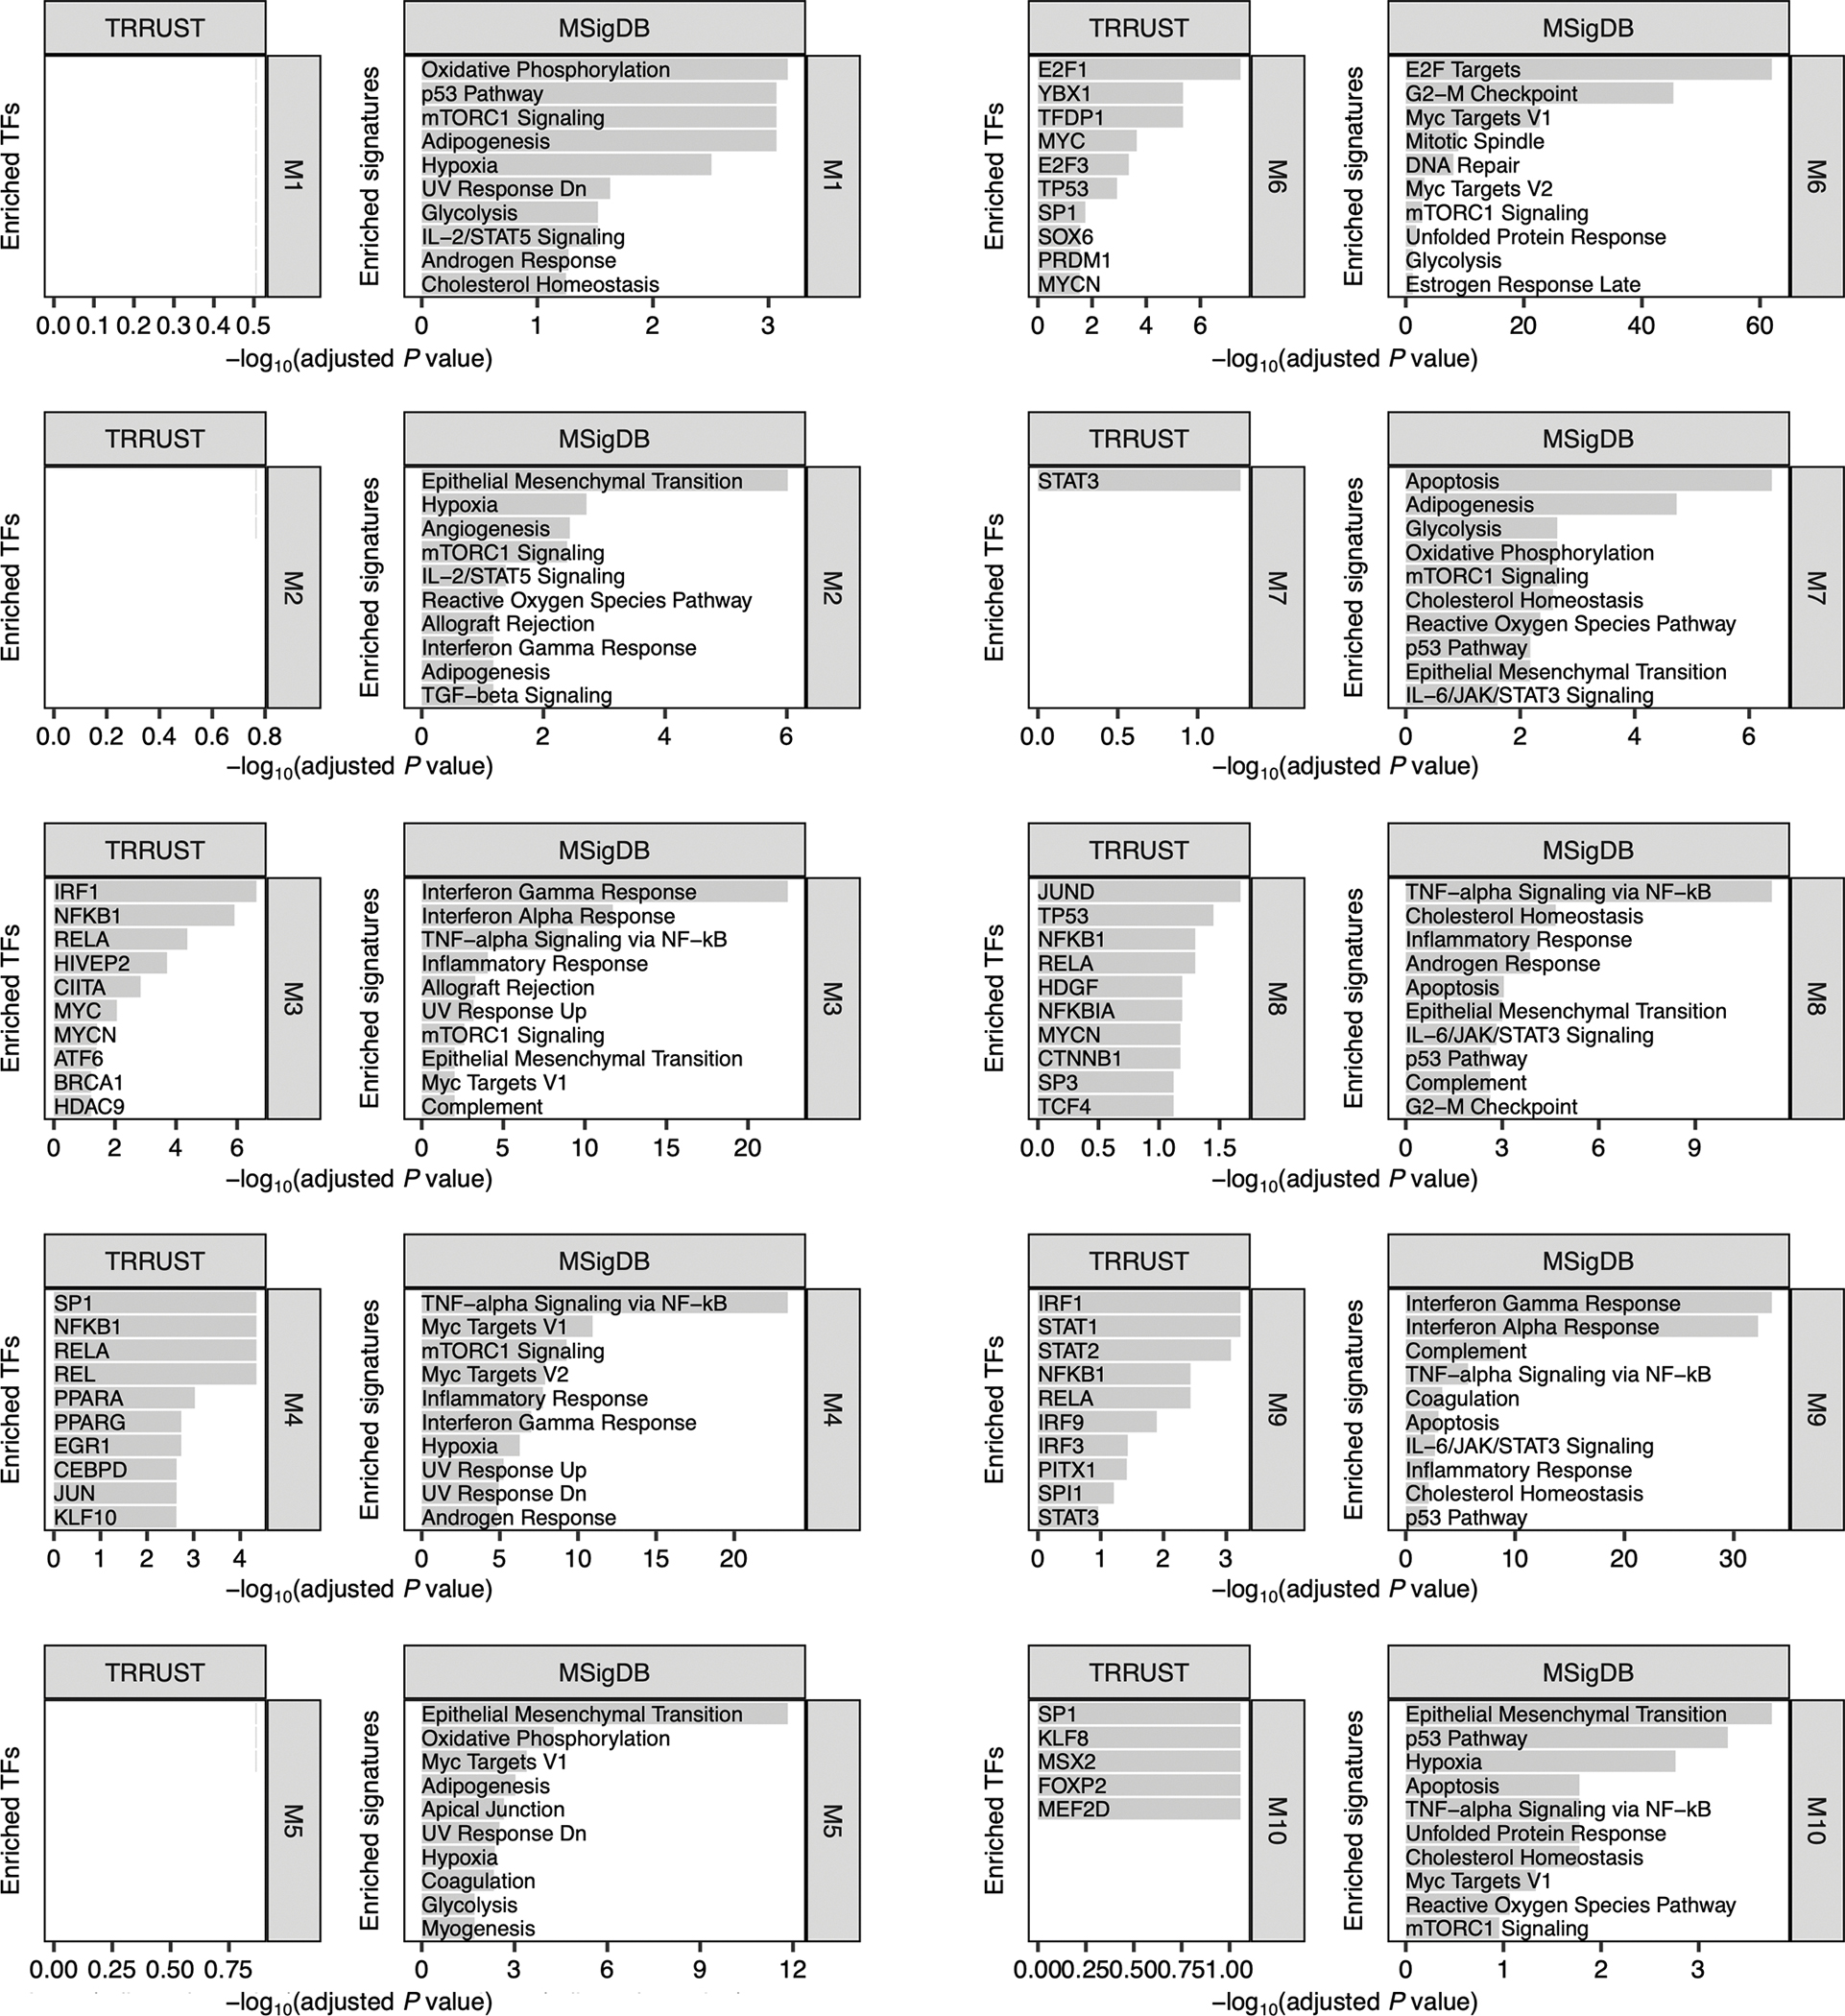
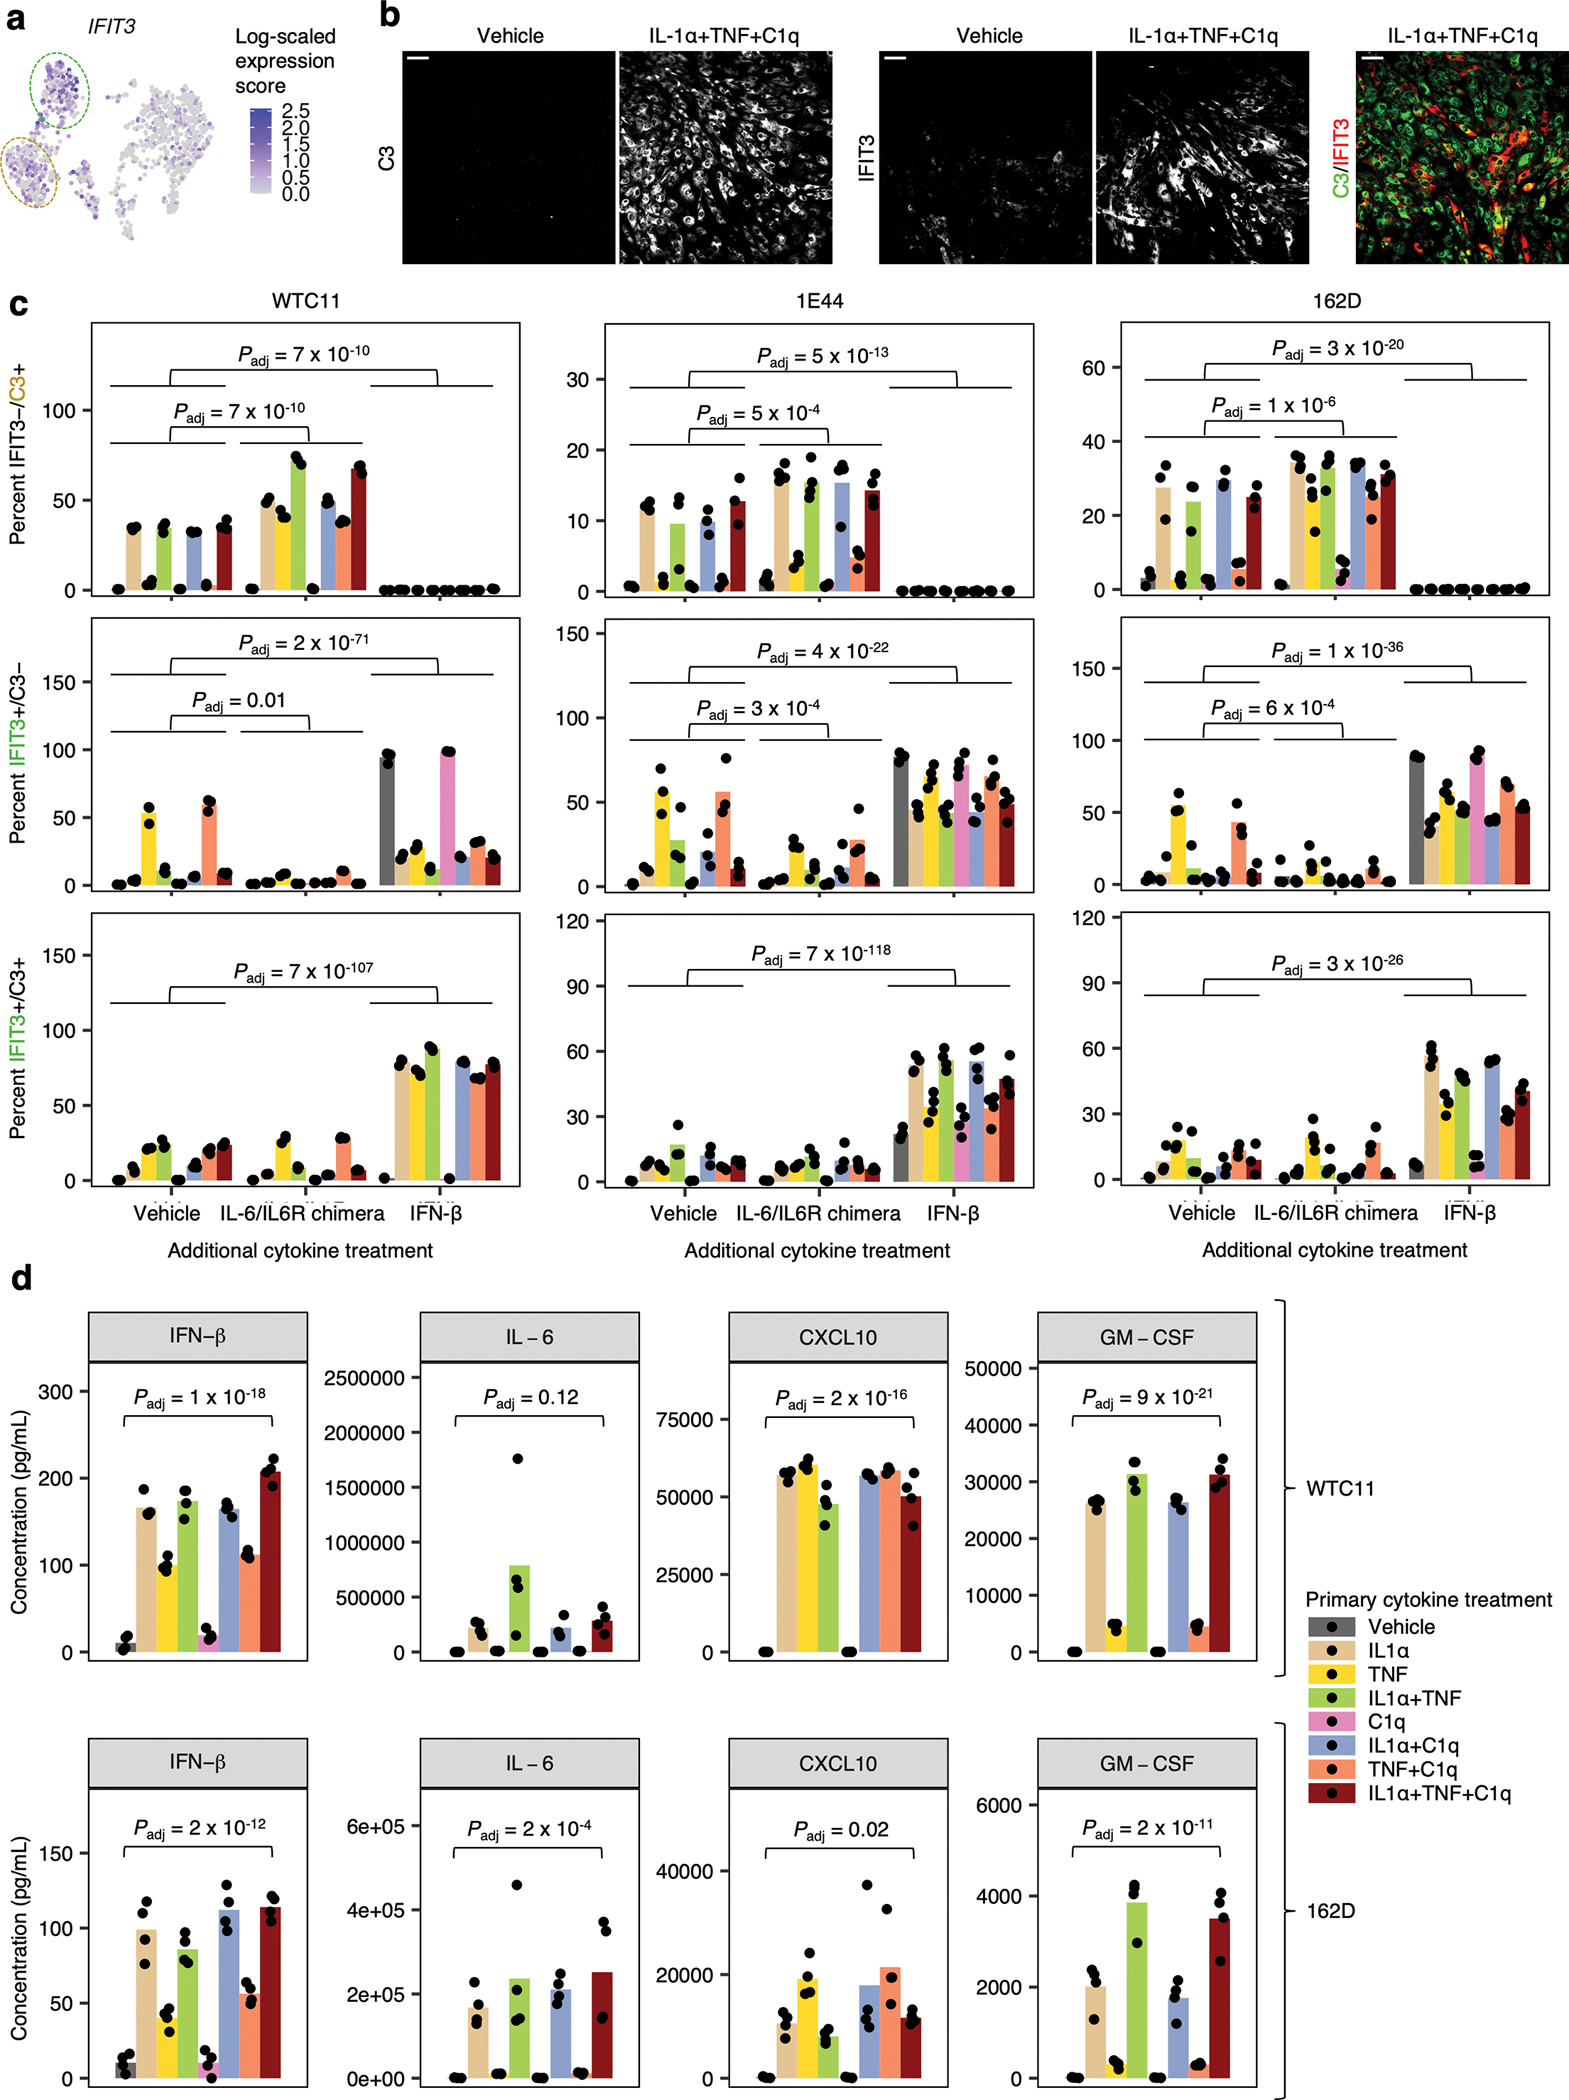
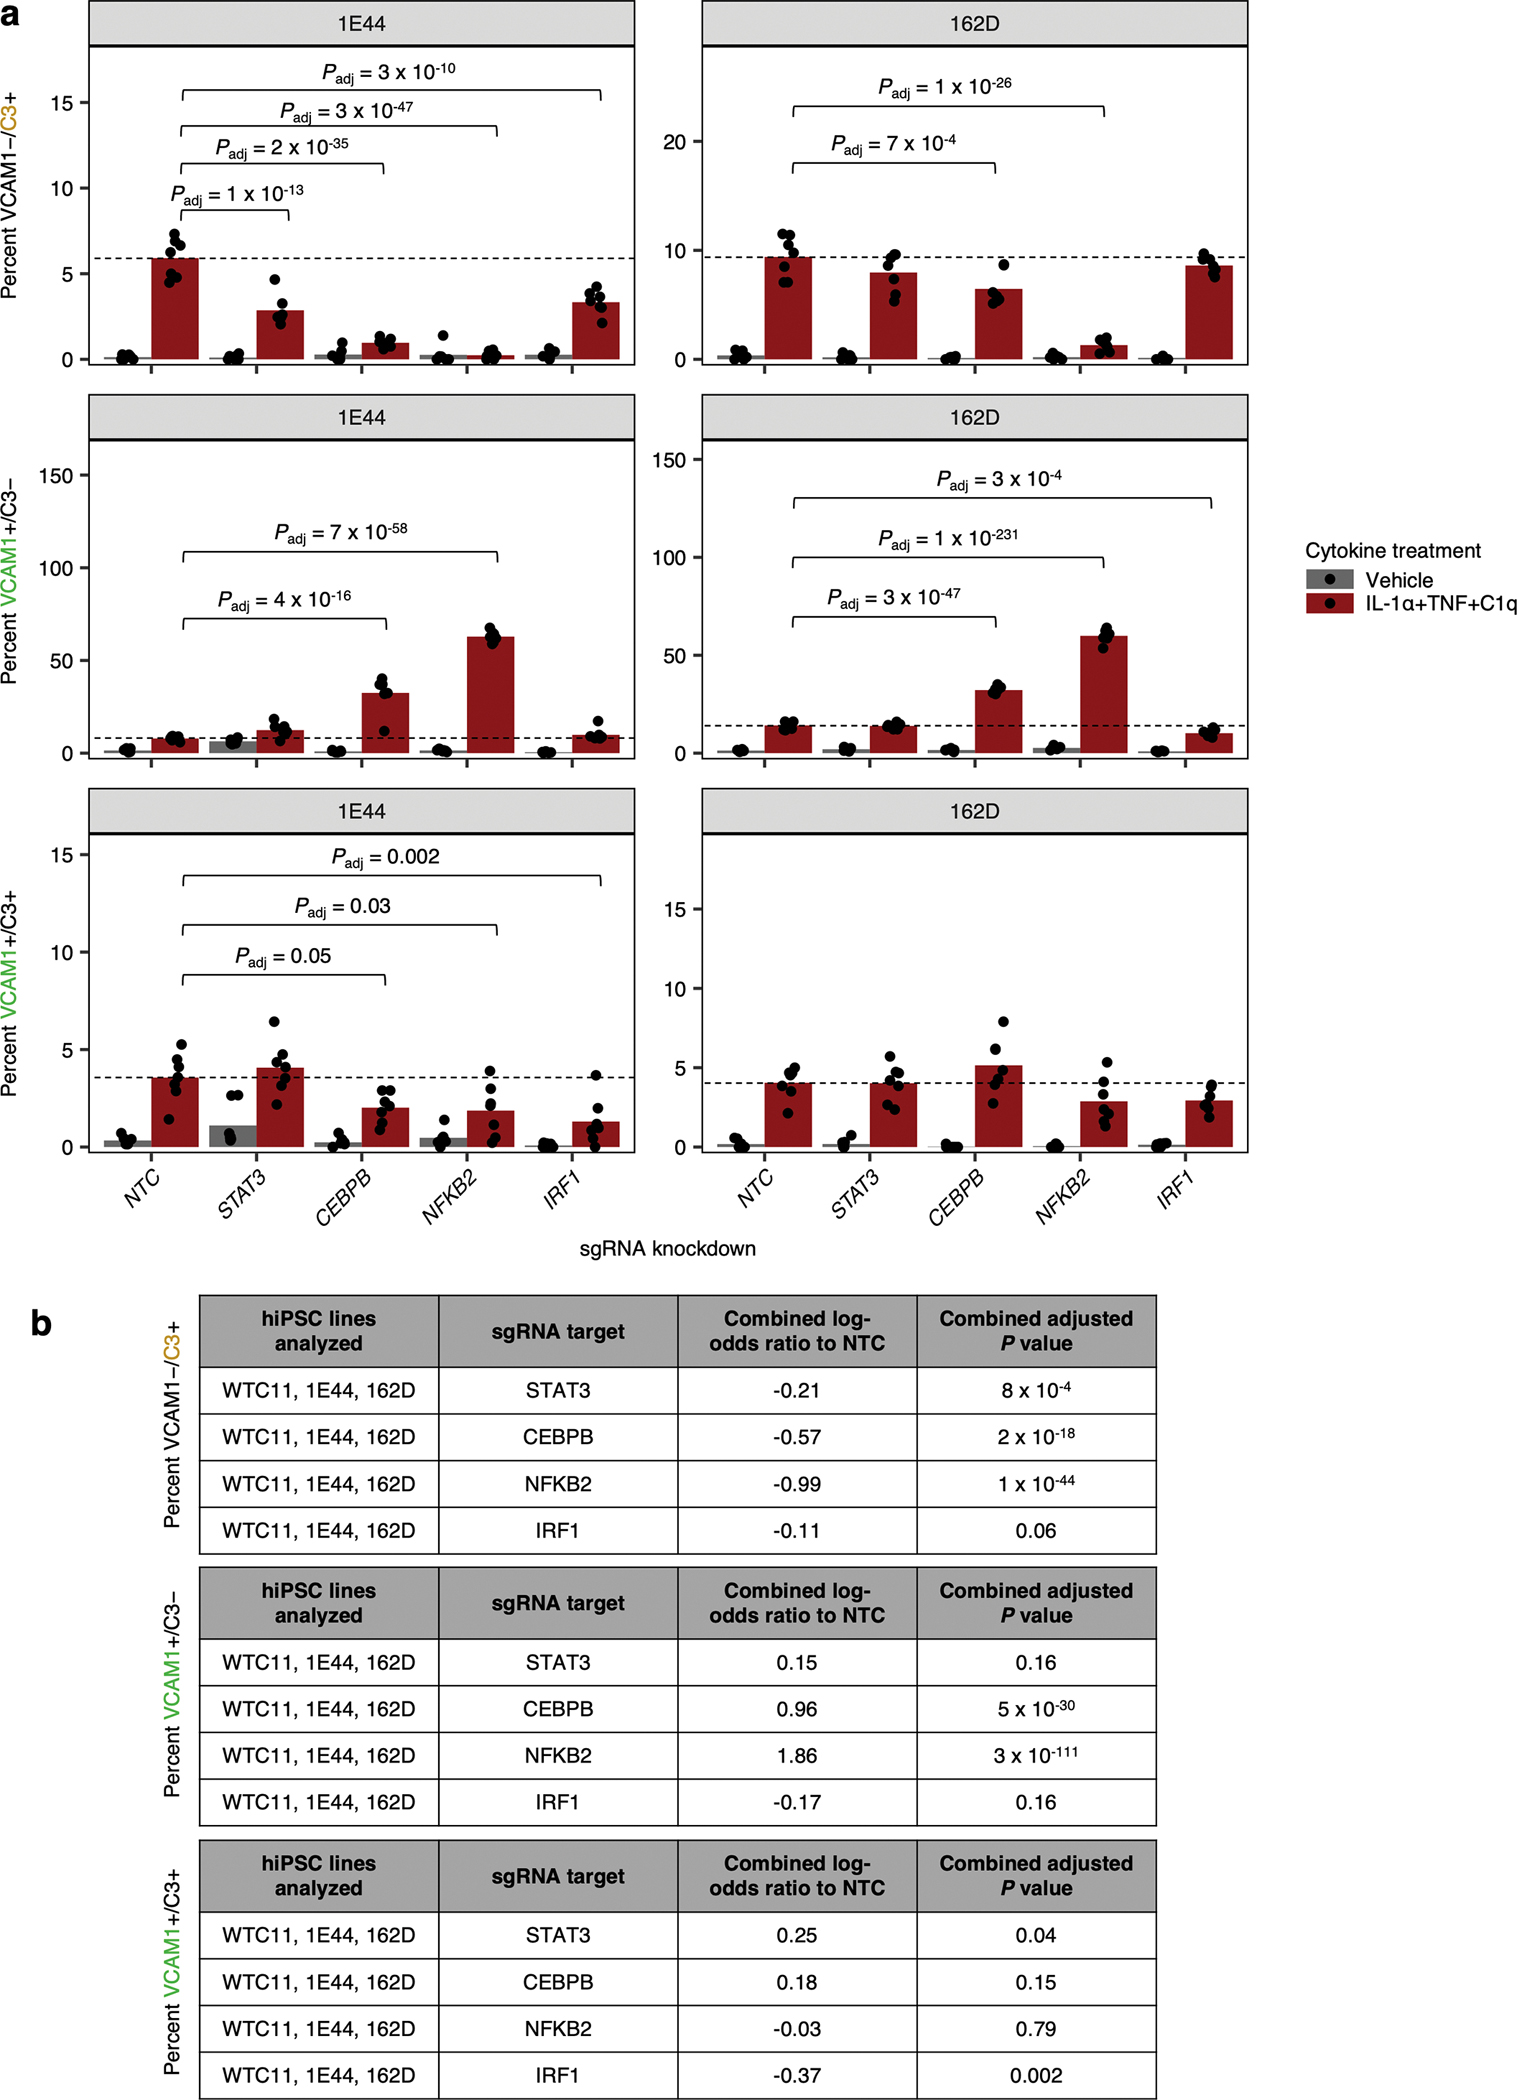
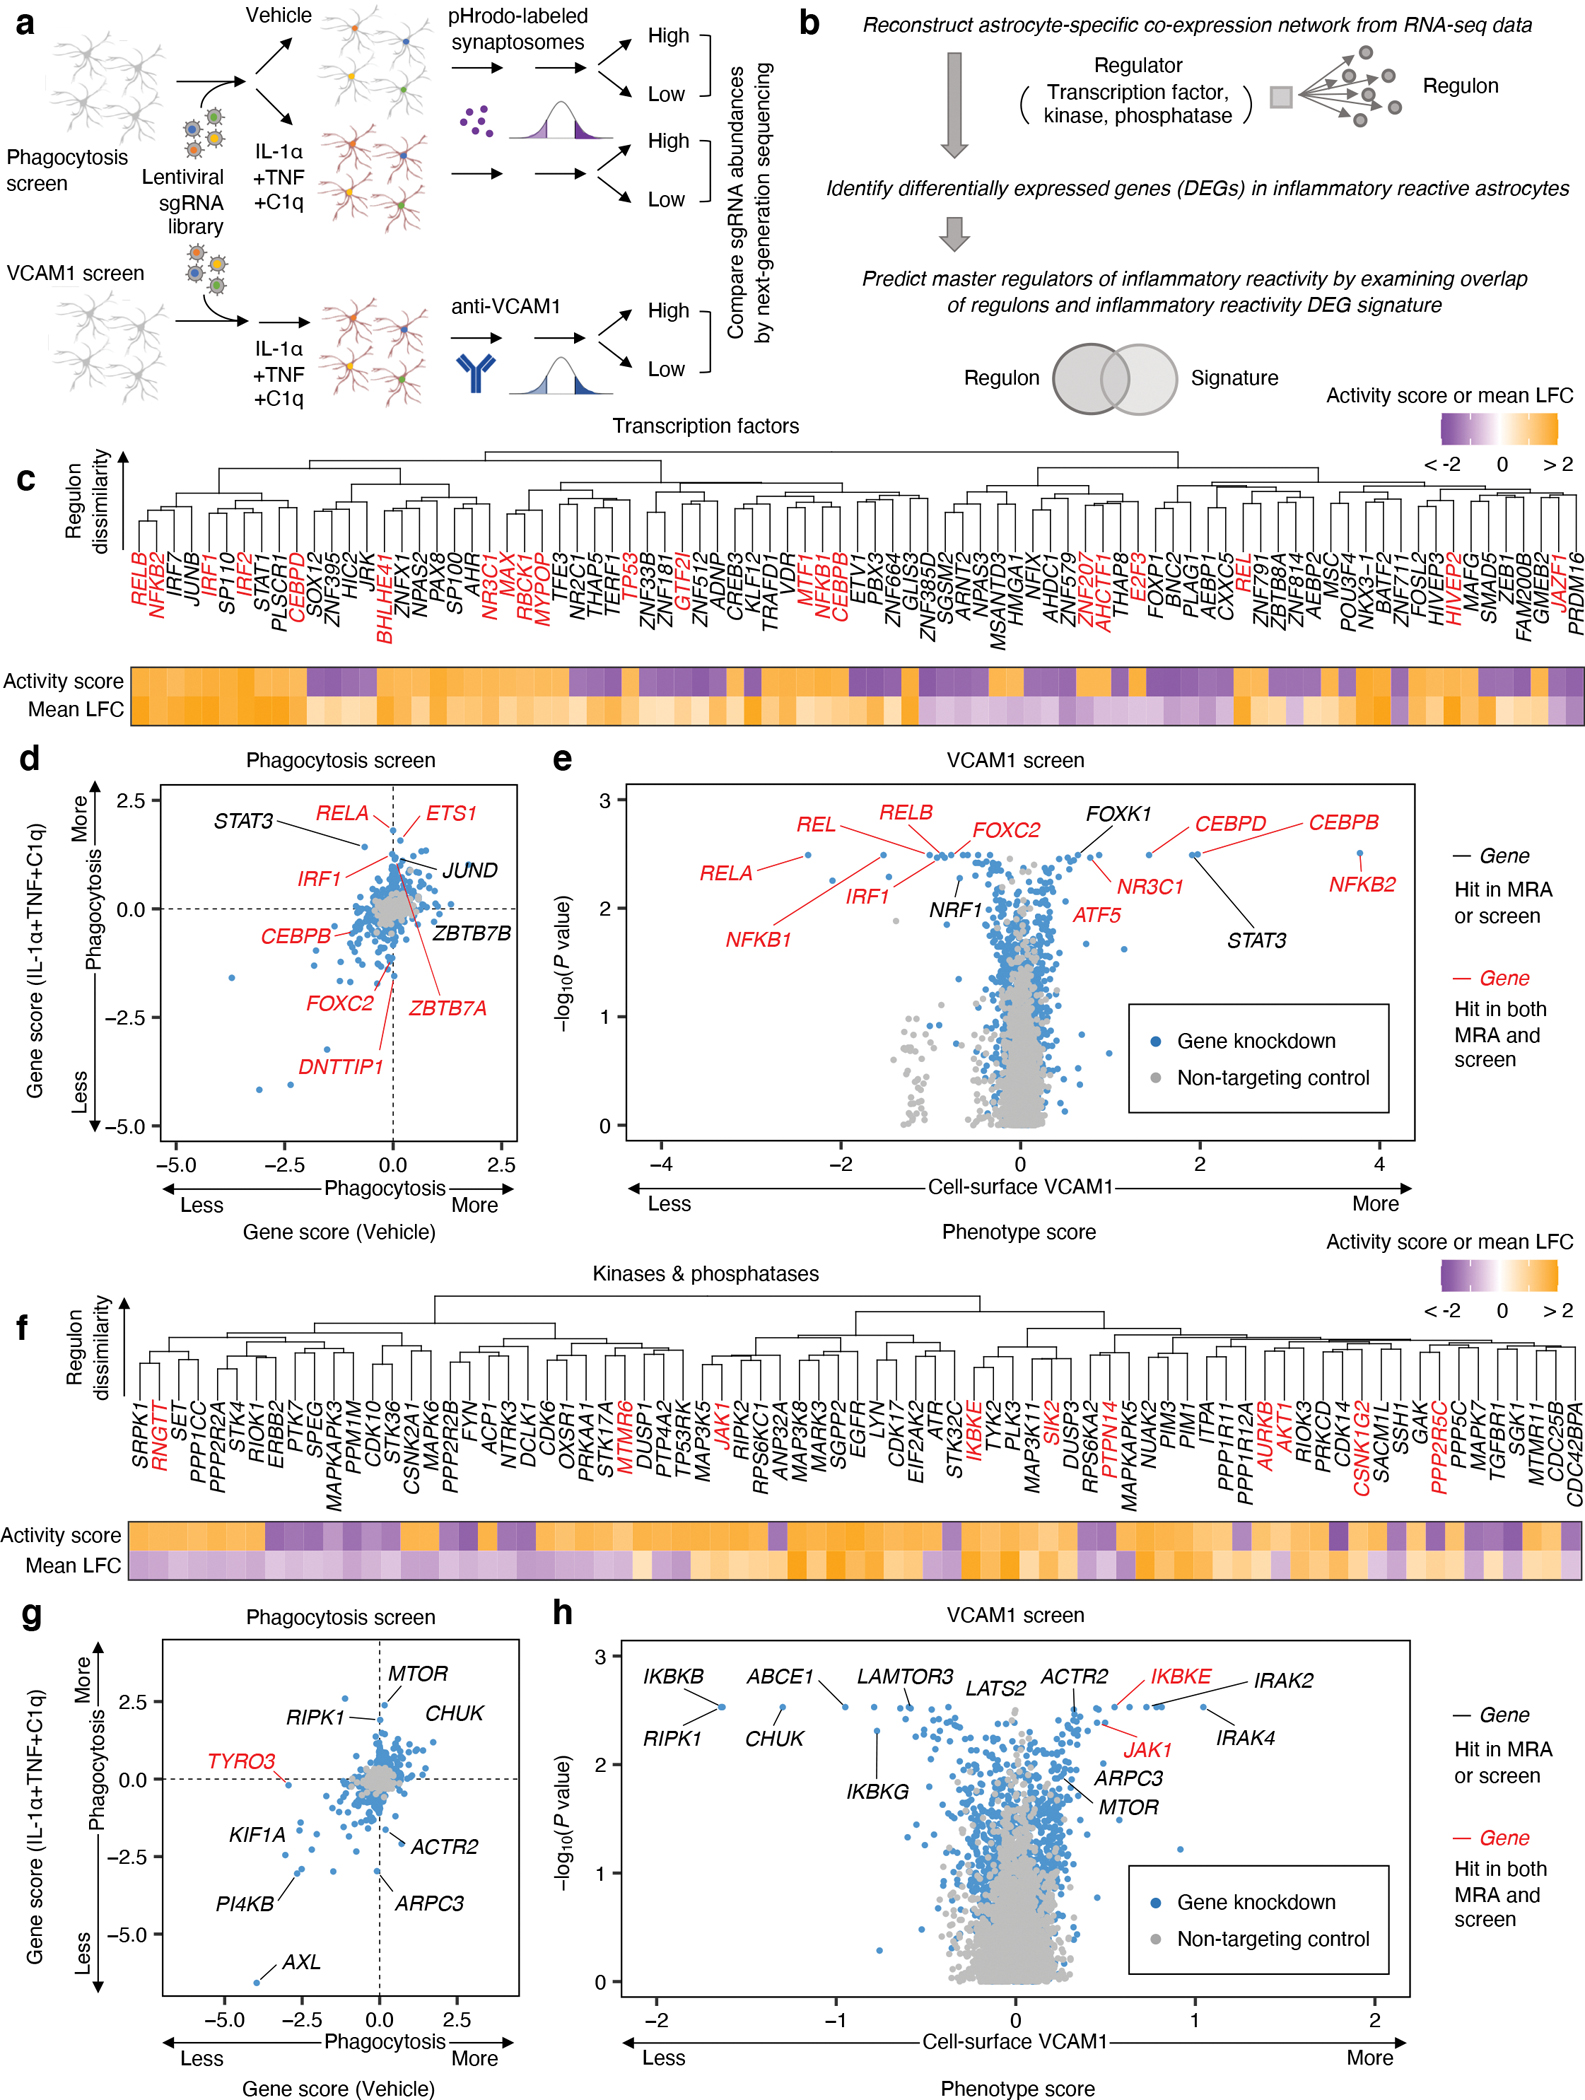
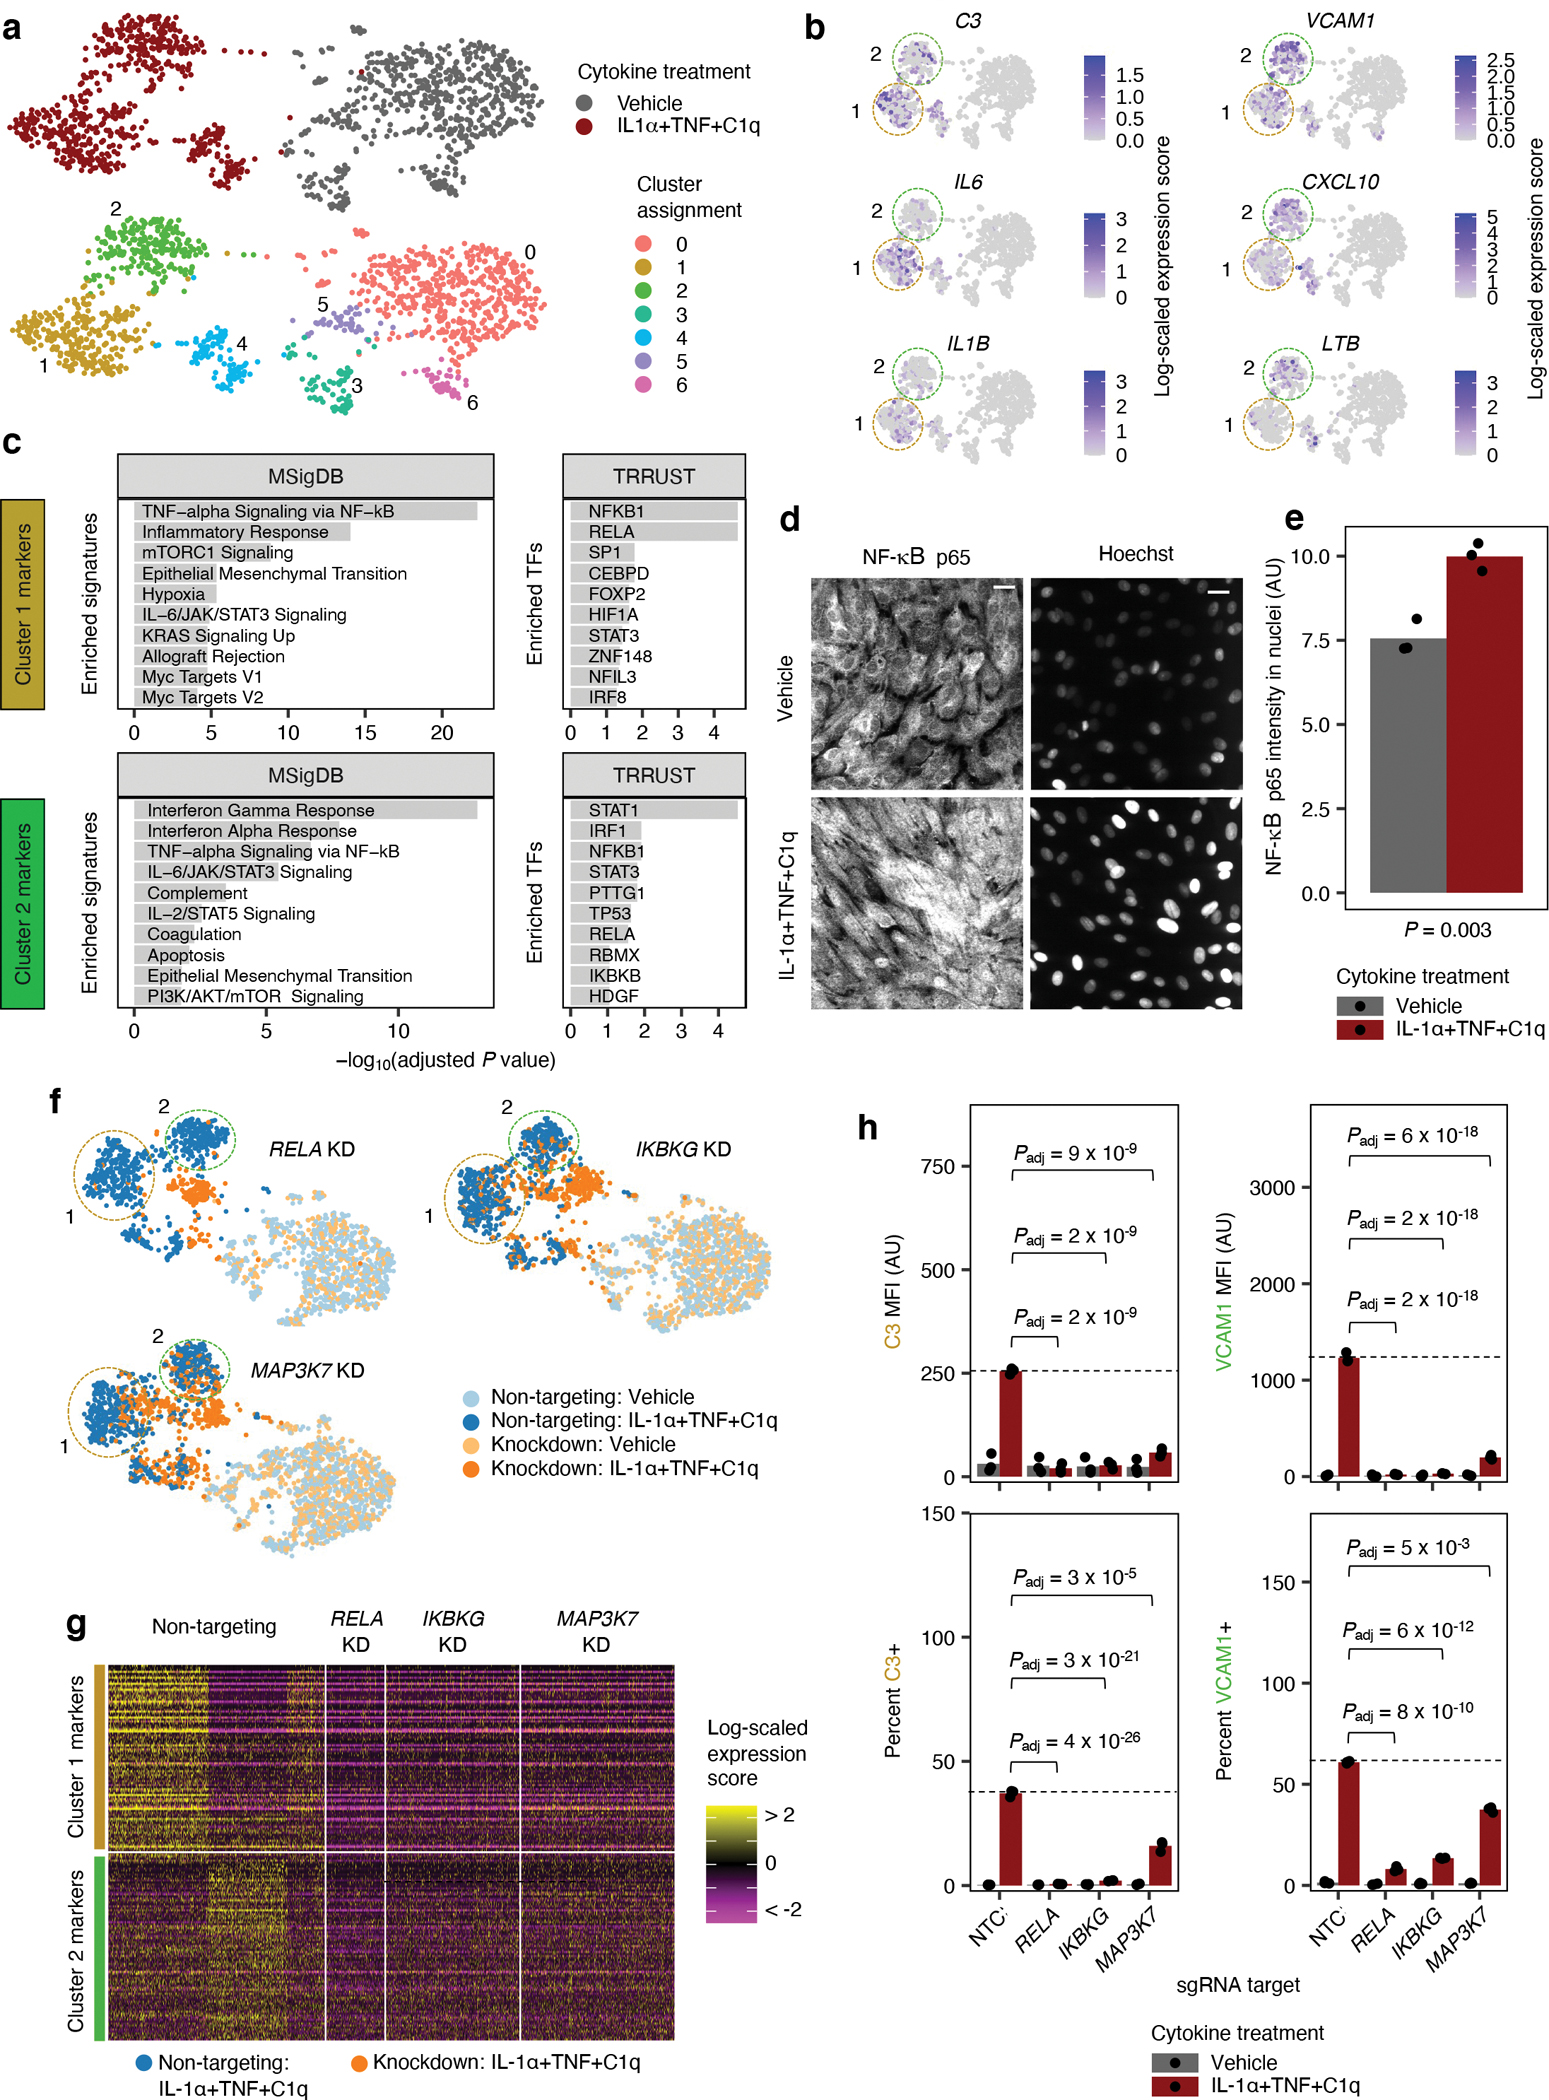
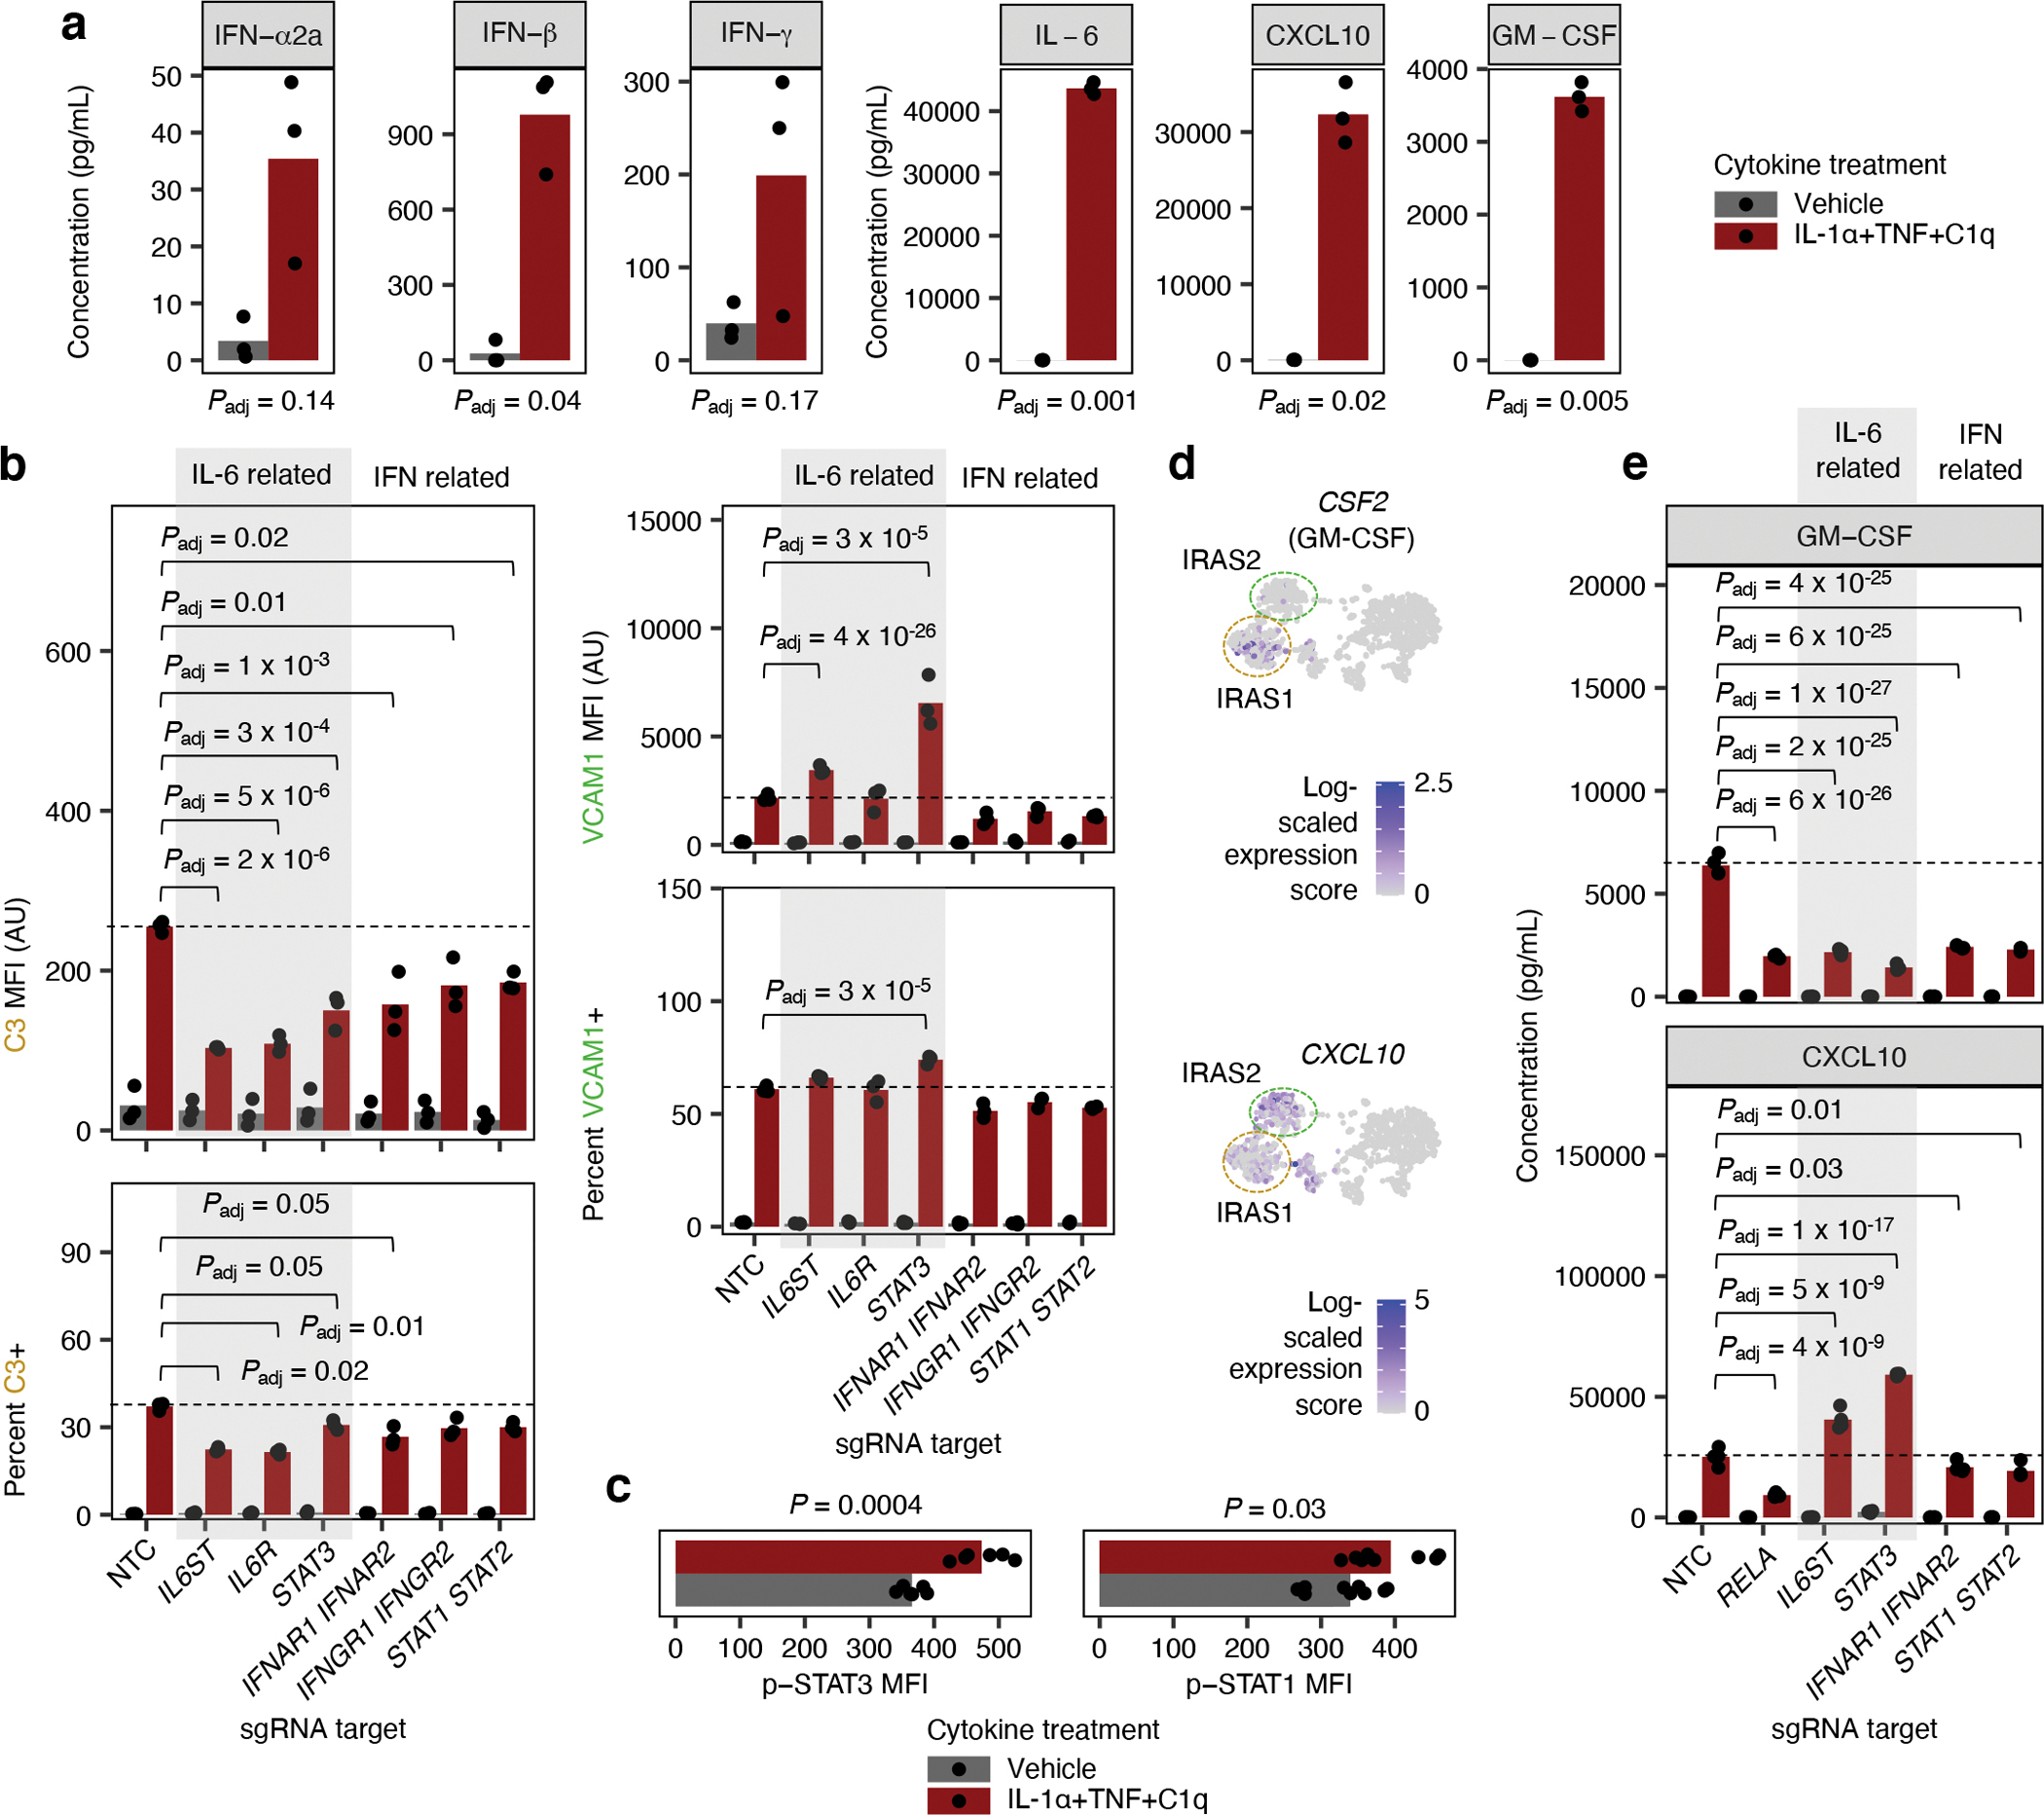
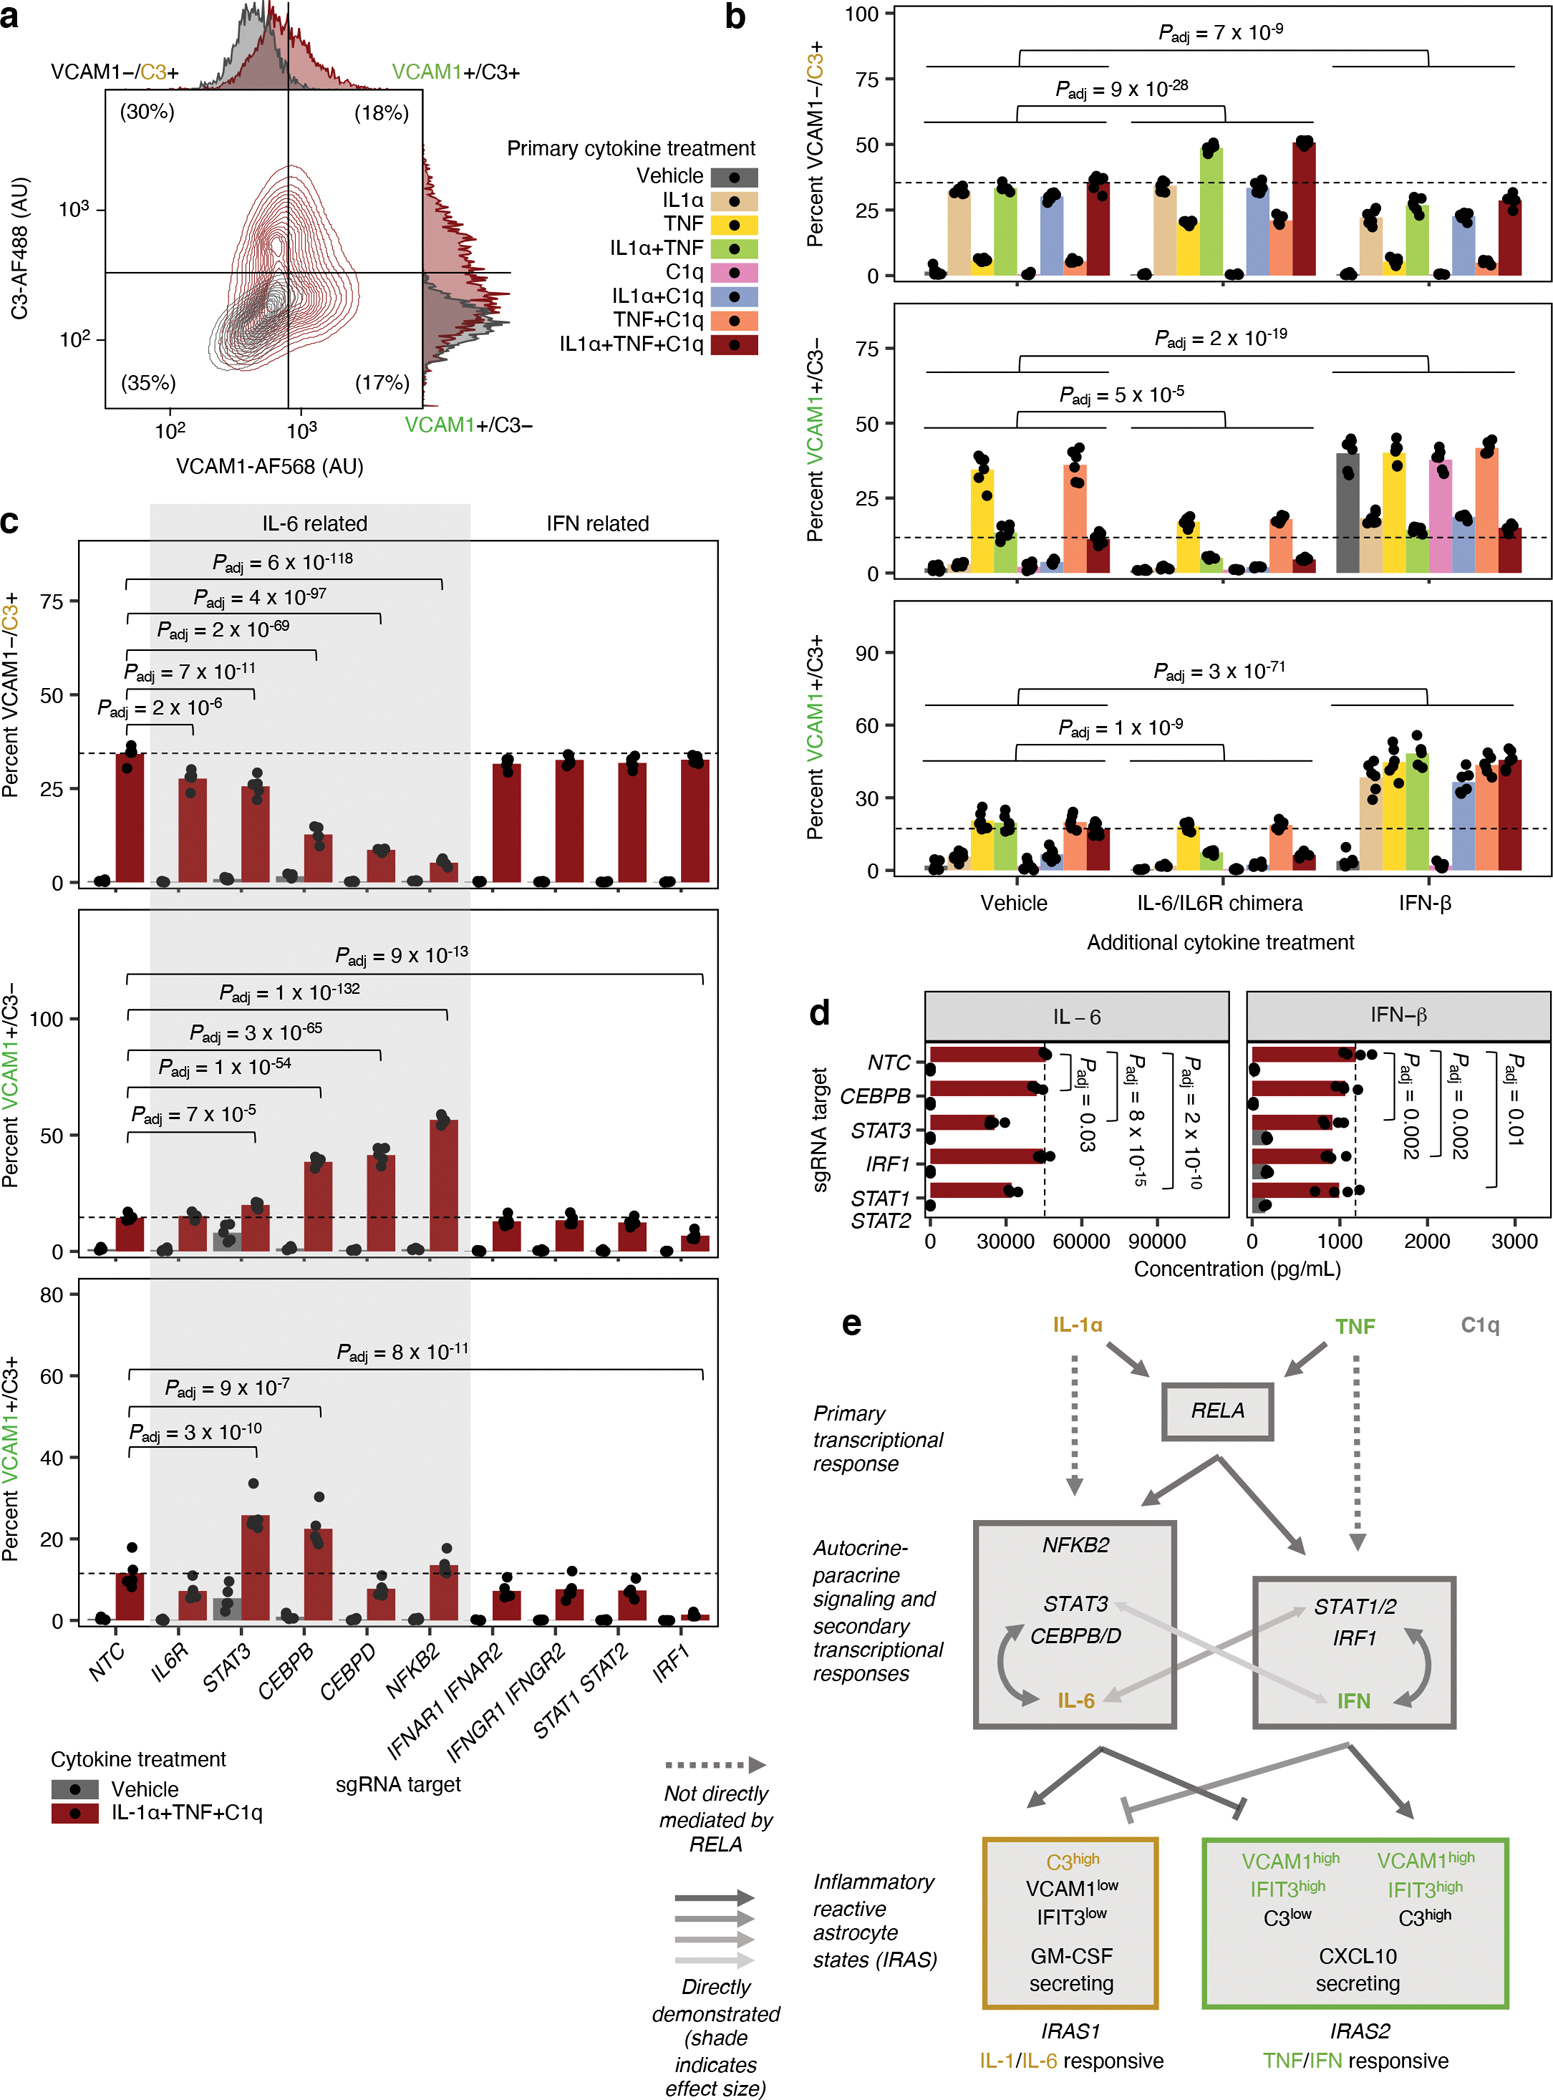
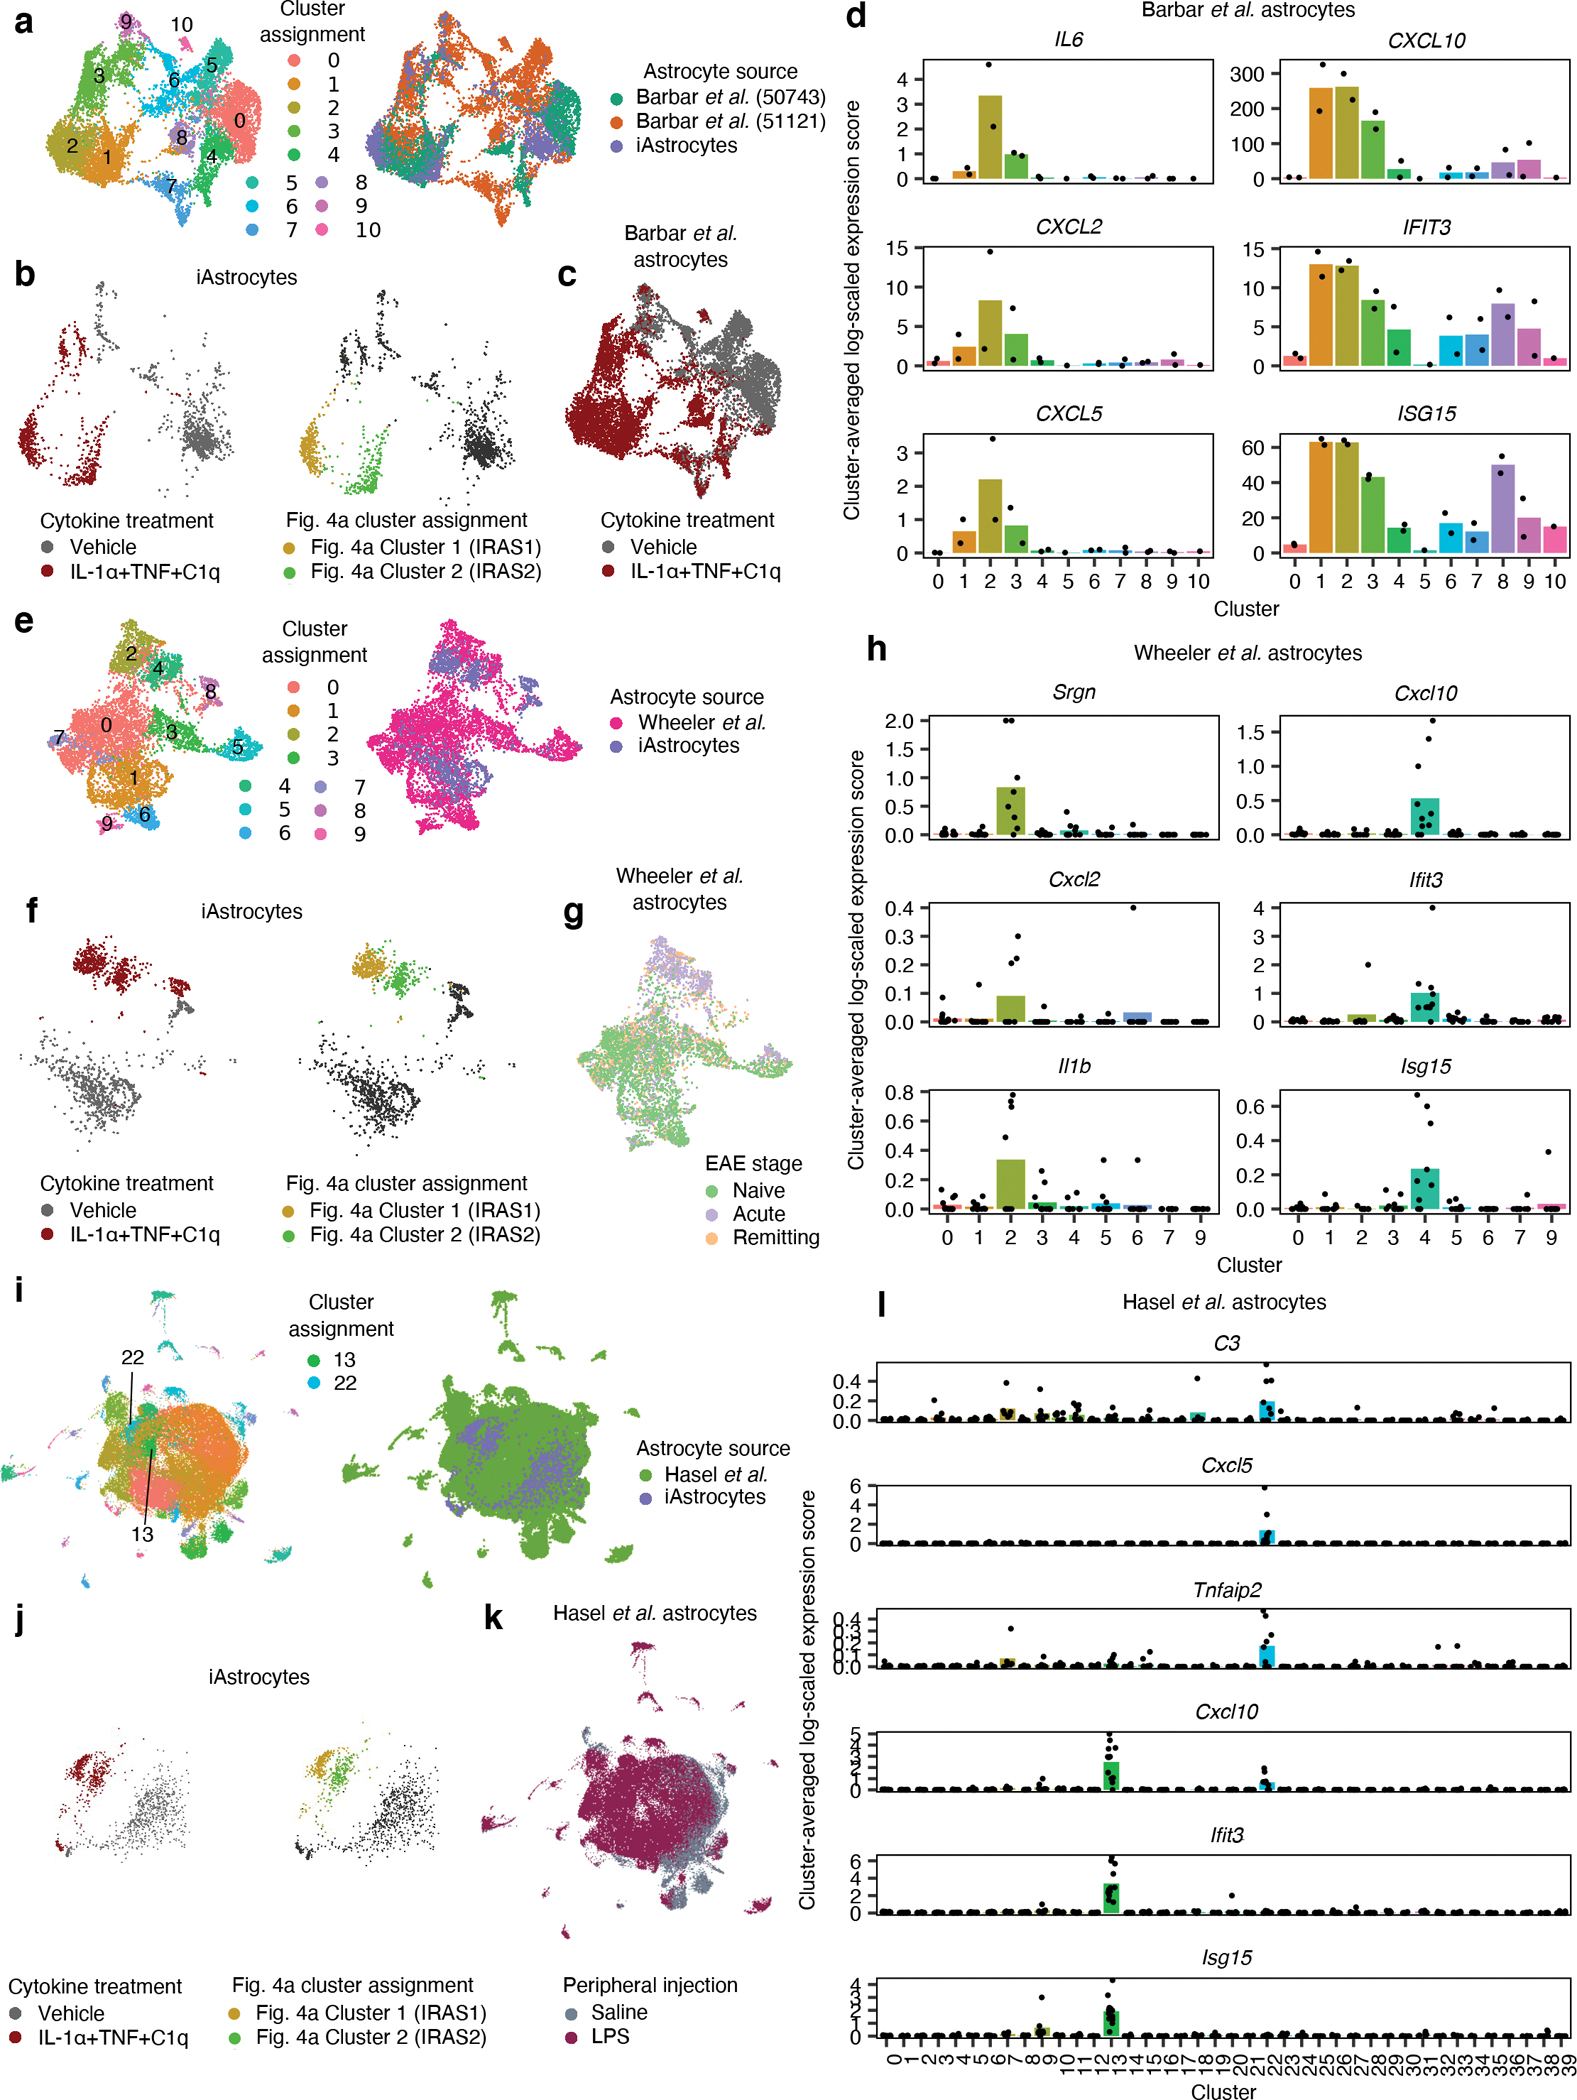
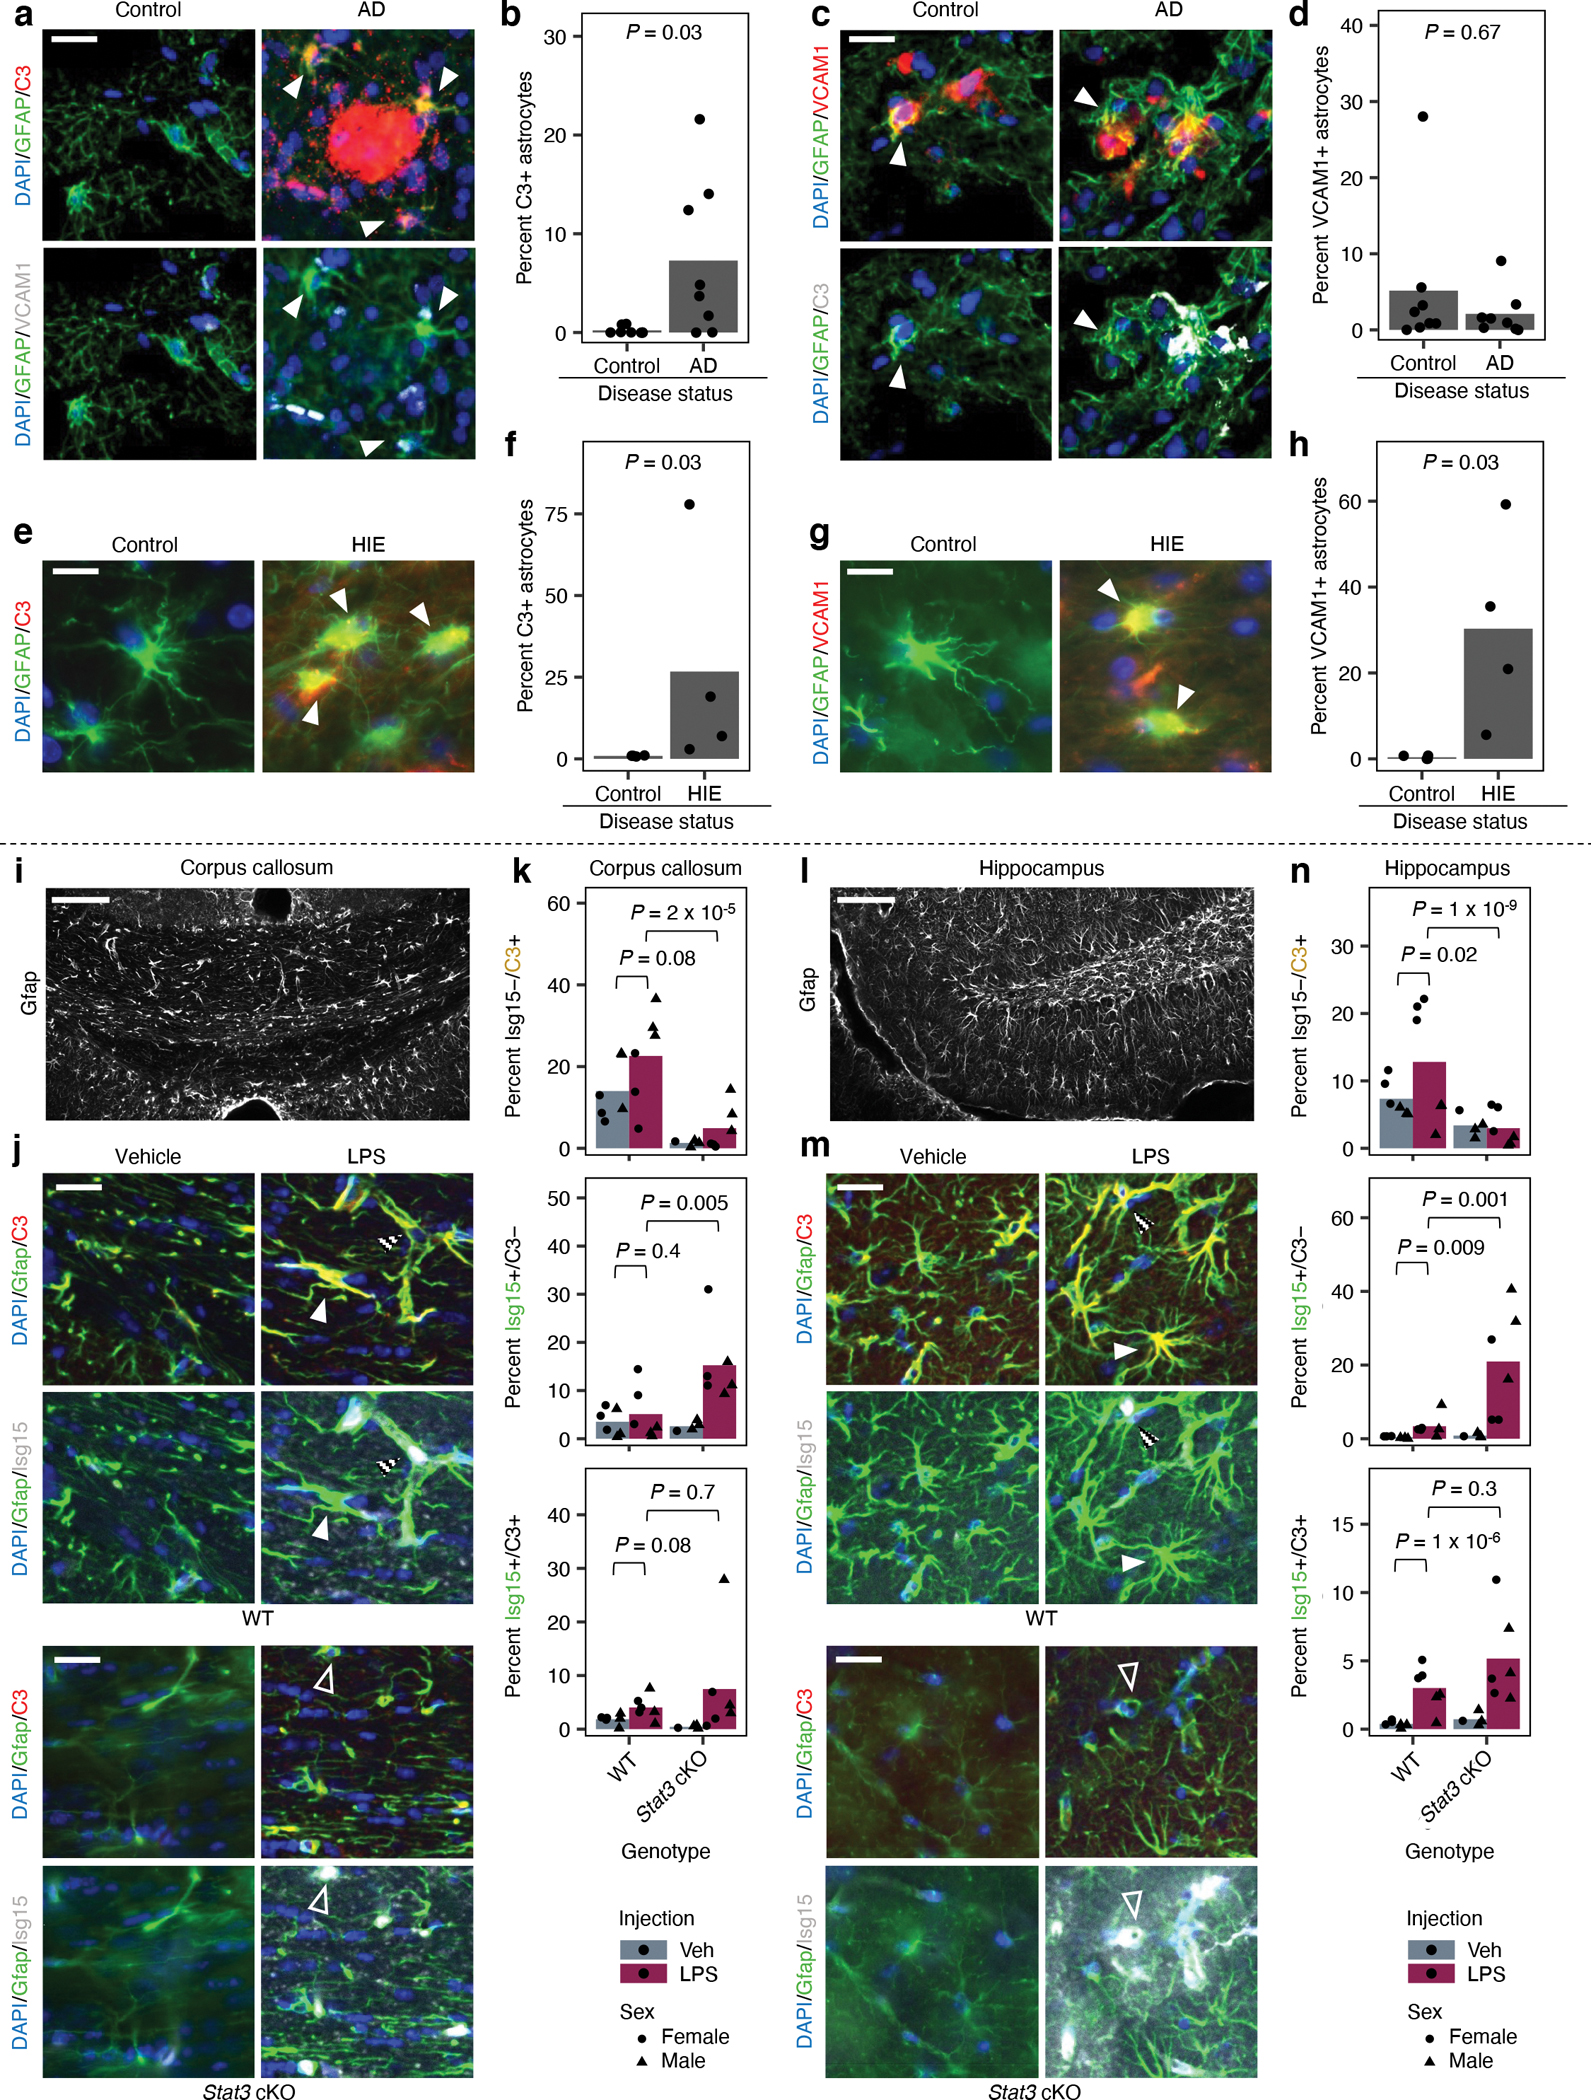
Astrocytes become reactive in response to insults to the central nervous system by adopting context-specific cellular signatures and outputs, but a systematic understanding of the underlying molecular mechanisms is lacking. In this study, we developed CRISPR interference screening in human induced pluripotent stem cell-derived astrocytes coupled to single-cell transcriptomics to systematically interrogate cytokine-induced inflammatory astrocyte reactivity. We found that autocrine-paracrine IL-6 and interferon signaling downstream of canonical NF-κB activation drove two distinct inflammatory reactive signatures, one promoted by STAT3 and the other inhibited by STAT3. These signatures overlapped with those observed in other experimental contexts, including mouse models, and their markers were upregulated in human brains in Alzheimer's disease and hypoxic-ischemic encephalopathy. Furthermore, we validated that markers of these signatures were regulated by STAT3 in vivo using a mouse model of neuroinflammation. These results and the platform that we established have the potential to guide the development of therapeutics to selectively modulate different aspects of inflammatory astrocyte reactivity.


Conflict of interest statement

COMPETING INTERESTS STATEMENT

M. Kampmann is an inventor on US Patent 11,254,933 related to CRISPRi and CRISPRa screening, serves on the Scientific Advisory Boards of Engine Biosciences, Casma Therapeutics, Cajal Neuroscience, and Alector, and is an advisor to Modulo Bio and Recursion Therapeutics. J. TCW co-founded Asmos Therapeutics, LLC, serves on the scientific advisory board of NeuCyte, Inc, and has consulted for FIND Genomics Inc., CareCureSystems Corporation, TheWell Biosciences Inc., and Aleta Neuroscience, LLC. AG serves on the scientific advisory board for Genentech and is a consultant to Muna Therapeutics. None of the other authors declare competing interests.

Figures

Extended Data Fig. 1 |
Extended Data Fig. 1 |. Additional characterization of iAstrocytes.
a, Empirical cumulative distribution functions of the mean expression of genes (averaged across experimental replicates, n = 3 wells) with astrocyte-specific expression (astrocyte fidelity > 40) or without astrocyte specific expression (astrocyte fidelity < 40) in iAstrocytes vs astrocytes generated using the TCW et al. protocol (TCW astrocytes). Genome-wide astrocyte fidelity scores were obtained from Kelley et al. TPM: transcripts per million. b, Relative expression (z-scored) of the top 50 genes with the highest astrocyte fidelity scores from Kelley et al. (organized by hierarchical clustering, see Methods) in iAstrocytes vs. TCW astrocytes (n = 3 experimental replicates corresponding to heatmap rows). Genes with statistically significant differential expression (adjusted P value < 0.1) between iAstrocytes and TCW astrocytes are marked with asterisks; P values were calculated and adjusted for multiple testing (false-discovery rate method) using DESeq2 (two-sided Wald test; see Methods). c, Heatmap of log-scaled transcripts per million (TPM) values of NFIA transcripts in human primary astrocytes from Zhang et al. d, Representative images from immunostaining of GFAP in iAstrocytes cultured alone or with iNeurons (n = 3 wells). In each case, an entire field of view is displayed (left) next to magnified sections (all at same scale) containing representative astrocyte morphologies (right). Scale bars correspond to 60 μm.
Extended Data Fig. 2 |
Extended Data Fig. 2 |. Validation of iAstrocyte differentiation from two additional hiPSC lines.
A, Representative images of immunofluorescence against GFAP, S100β, GLAST, Cx43, glutamine synthetase, or vimentin in iAstrocytes vs. TCW astrocytes derived from TCW-1E44 or 162D hiPSCs (scale bar: 60 μm). b,Quantification of GFAP, S100β, GLAST, Cx43, glutamine synthetase, or vimentin immunofluorescence intensity (n = 3 wells). c, Phagocytosis of pHrodo-labeled rat synaptosomes (median fluorescence intensity measured by flow cytometry) by iAstrocytes derived from TCW-1E44 or 162D hiPSCs in the absence (n = 5 wells) or presence (n = 1 well) of cytochalasin D (cytoD). d, Percent VCAM1+ cells in TCW-1E44 or 162D iAstrocytes treated with vehicle control vs. IL-1α+TNF+C1q (n = 4 wells). e, Percentage of dead cells (measured by TO-PRO-3 permeability) in iNeurons incubated with conditioned media from TCW-1E44 or 162D iAstrocytes treated with vehicle control or IL-1α+TNF+C1q (n = 12 wells). In panels b and c, P values were calculated using the two-sided Student’s t-test. In panels d and e, P values were calculated using the two-sided Mann-Whitney U test.
Extended Data Fig. 3 |
Extended Data Fig. 3 |. iAstrocytes respond to IL-1α+TNF+C1q in a highly similar manner as hiPSC-derived astrocytes generated using different protocols and primary mouse astrocytes.
a, Principal component (PC) analysis plot of the gene expression profiles (top 5000 variable genes) of iAstrocytes vs. astrocytes derived using the protocols from TCW et al. (TCW astrocytes), Li et al. (Li astrocytes), or Krencik et al. (Krencik astrocytes), as well as iPSC-derived neurons (iNeurons) and neural progenitor cells (NPCs), treated with vehicle control or IL-1α+TNF+C1q (n = 3 wells for astrocyte samples, n = 2 wells for iNeuron and NPC samples). b, Number of differential expressed genes (DEGs) induced by IL-1α+TNF+C1q. c, Log2-fold-changes of pan-reactive, A1 reactive, and A2 reactive genes defined in Liddlelow et al. in hiPSC-derived astrocytes from this study. d, Overlap of upregulated and downregulated DEGs induced by IL-1α+TNF+C1q among hiPSC-derived astrocytes from this study. e, Overlap of upregulated and downregulated DEGs induced by IL-1α+TNF+C1q from hiPSC-derived astrocytes from this study compared to DEGs from inflammatory reactive astrocytes in other studies. f-g, Phagocytosis of pHrodo-labeled synaptosomes (f; n = 3 wells for −cytoD, n = 1 well for +cytoD) or induction of cell-surface VCAM1 (g; n = 6 wells) by iAstrocytes compared to Li and Krencik astrocytes. cytoD: cytochalasin D. h-i, Induction of VCAM1 expression by IL-1α+TNF+C1q in primary mouse astrocytes measured by flow cytometry in this study (h; n = 4 wells) or primary mouse astrocytes measured by RNA-seq in Guttenplan et al. and Hasel et al. (i; n = 3 mice). In panel e, P values were calculated using the two-sided Fisher’s exact test and adjusted for multiple testing using the Benjamini-Hochberg method. In panel and i, P values were calculated using the two-sided Student’s t-test. In panels f-h, P values were calculated using beta regression (two-sided Wald test; see Methods).
Extended Data Fig. 4 |
Extended Data Fig. 4 |. sgRNA abundance distribution in CRISPRi screens, comparison of phenotypes from VCAM1 and phagocytosis CRISPRi screens, and validation of selected hits from CRISPRi screens.
a, sgRNA abundance distribution for the CRISPRi screens shown in Fig. 3. b, Gene scores (see Methods) from the phagocytosis vs. VCAM1 CRISPRi screen against transcription factors (left) or the druggable genome (right) in iAstrocytes treated with IL-1α+TNF+C1q. c-d, Phagocytosis of pHrodo-labeled synaptosomes (c) or induction of cell-surface VCAM1 (d) by iAstrocytes transduced with non-targeting sgRNA (NTC) vs. sgRNAs targeting selected hits from the screens shown in Fig. 3, treated with vehicle control or IL-1α+TNF+C1q (n = 6 wells for NTC, n = 3 wells for knockdowns). MFI: median fluorescence intensity measured by flow cytometry. In panels c and d, P values were calculated by linear regression (two-sided Wald test; see Methods) and adjusted for multiple testing (Padj; Holm’s method) per family of tests (all comparisons within a plot).
Extended Data Fig. 5 |
Extended Data Fig. 5 |. Additional analyses of CROP-seq data.
a, Expression levels of the top cluster markers of non-targeting control (NTC) sgRNA-transduced iAstrocytes shown in Fig. 4a. b-c, Cellular pathway (BioPlanet) enrichment analysis of Cluster 3 and 4 markers (b) and cell type marker (Descartes) enrichment analysis of Cluster 5 and 6 markers (c) of NTC sgRNA-transduced iAstrocytes shown in Fig. 4a. P values were calculated using the two-sided Fisher’s exact test and corrected for multiple testing using the Benjamini-Hochberg method. d, The degree of regulator knockdown (left) or the number of differentially expressed genes (DEGs) whose differential expression induced IL-1α+TNF+C1q is significantly altered by regulator knockdown. e, Hierarchical clustering of the P-value-weighted log-fold-changes (gene score) of the union of knockdown-associated DEGs from panel d; DEGs associated with ABCE1 knockdown were excluded due to a significant number of DEGs also being caused by ABCE1 knockdown in vehicle control-treated iAstrocytes.
Extended Data Fig. 6 |
Extended Data Fig. 6 |. Enrichment analysis of CROP-seq knockdown-associated gene modules.
Cellular pathway (MSigDB) and upstream transcription factor (TRRUST) enrichment analysis of gene modules from Extended Data Fig. 4e; TF – transcription factor. P values were calculated using the two-sided Fisher’s exact test and adjusted for multiple testing using the Benjamini-Hochberg method.
Extended Data Fig. 7 |
Extended Data Fig. 7 |. C3 and IFIT3 expression and cytokine production in iAstrocytes derived from multiple hiPSC lines.
a, Transcript levels of IFIT3 overlaid onto the UMAP embedding from Fig. 3a. b, Representative immunofluorescence images of C3 and IFIT3 staining (scale bar: 60 μm). c, Percent IFIT3−/C3+, IFIT3+/C3−, or IFIT3+/C3+ cells measured by immunofluorescence in iAstrocytes derived from multiple hiPSC lines (WTC11, TCW-1E44, 162D) treated with vehicle control vs. all possible combinations of IL-1α, TNF, and C1q, in the absence (n = 3 wells per condition) or presence of additional IL-6/IL6R chimera (25 ng/mL) or IFN-β (5 ng/mL) added concurrently (n = 4 wells per condition). D, Concentration of IFN-β, IL-6, CXCL10, or GM-CSF in conditioned media from iAstrocytes derived from multiple hiPSC lines (WTC11, 162D) treated with vehicle control vs. all possible combinations of IL-1α, TNF, and C1q (n = 4 wells). For panels c a, P values were calculated using beta regression (two-sided Wald test; see Methods). For panel d, P values were calculated using linear regression (two-sided Wald test; see Methods). P values were adjusted for multiple testing (Padj; Holm’s method) per family of tests (all comparisons within a plot).
Extended Data Fig. 8 |
Extended Data Fig. 8 |. Validation of STAT3, CEBPB, NFKB2, and IRF1 knockdown in iAstrocytes derived from multiple hiPSC lines.
a, Percent VCAM1−/C3+, VCAM1+/C3−, or VCAM1+/C3+ cells measured by flow cytometry)in iAstrocytes derived from multiple hiPSC lines (TCW-1E44 and 162D) transduced with non-targeting sgRNA (NTC) or sgRNAs targeting STAT3, CEBPB, NFKB2, or IRF1 (n = 6 wells). b, Combined statistical analysis of the effect of STAT3, CEBPB, NFKB2, or IRF1 knockdown compared to NTC in IL-1α+TNF+C1q-treated iAstrocytes derived from multiple hiPSC lines (WTC11, TCW-1E44, 162D). For panels a and b, P values were calculated using beta regression (two-sided Wald test; see Methods) and adjusted for multiple testing (Padj; Holm’s method) per family of tests (all comparisons within a plot or table).
Extended Data Fig. 9 |
Extended Data Fig. 9 |. Effect of small molecule modulators of STAT3 or STAT1/2 activity.
a, Representative immunofluorescence images of phospho-STAT3 (Y705) staining in vehicle control vs. IL-1α+TNF+C1q-treated iAstrocytes. Scale bar corresponds to 20 μm. b, Phospo-STAT3 (Y705) levels measured by flow cytometry in iAstrocytes treated with vehicle control vs. IL-1α+TNF+C1q in the presence of increasing doses of napabucasin (n = 6 wells for 0 μM napabucasin, n = 3 for napabucasin > 0 μM). MFI: median fluorescence intensity. c, Percent VCAM1−/C3+, VCAM1+/C3−, or VCAM1+/C3+ cells measured by flow cytometry)in iAstrocytes treated with vehicle control vs. IL-1α+TNF+C1q in the presence of increasing doses of napabucasin (n = 6 wells for 0 μM napabucasin, n = 3 for napabucasin > 0 μM). d, Percent VCAM1−/C3+, VCAM1+/C3−, or VCAM1+/C3+ cells measured by flow cytometry in iAstrocytes treated with vehicle control vs. IL-1α+TNF+C1q, with or without concurrent RGFP966 treatment (n = 6 wells). In panels b-d, P values were calculated using linear regression for MFI values or beta regression (two-sided Wald test; see Methods) for percentages and adjusted for multiple testing (Padj; Holm’s method) per family of tests (all comparisons within a plot).
Extended Data Fig. 10 |
Extended Data Fig. 10 |. Overlap analysis of IRAS1 and IRAS2 markers with external datasets.
a-c, Overlap analysis (Fisher’s exact test; see Methods) of differentially expressed genes (DEGs) between IRAS1 vs. IRAS2 with DEGs between IRAS1- and IRAS2-co-clustering astrocytes from Barbar et al. (a), Wheeler et al. (b), or Hasel et al. (c). d, Overlap analysis of DEGs between IRAS1 vs. IRAS2 with DEGs between astrocytes from Stat3 astrocyte-specific conditional knockout (cKO) mice vs. wild-type (WT) mice subject to spinal cord injury (SCI) from Anderson et al.. e-g, Module expression score (see Methods) of IRAS1 or IRAS2 markers overlaid onto the UMAP embedding of Barbar et al. (e), Wheeler et al. (f), or Hasel et al. (g) astrocytes from Fig. 7d, h, and l, respectively. h, Module expression score of upregulated vs. downregulated DEGs between astrocytes from Stat3 cKO SCI vs. WT SCI mice from Anderson et al. overlaid onto the UMAP embedding of iAstrocytes from Fig. 4a. i, Cellular pathway (MSigDB) and upstream transcription factor (TRRUST) enrichment analysis of upregulated vs. downregulated DEGs between astrocytes from Stat3 cKO SCI vs. WT SCI mice from Anderson et al.. For panels a-d and i, P values were calculated using the two-sided Fisher’s exact test and corrected for multiple testing using the Benjamini-Hochberg method.
Fig. 1 |
Fig. 1 |. iPSC-derived astrocytes (iAstrocytes) perform canonical astrocyte functions and recapitulate key aspects of inflammatory reactivity.
a, Representative immunofluorescence images of astrocyte markers in iAstrocytes (“iAstro”) vs. hiPSC-derived astrocytes generated using the protocol from TCW et al. (“TCW”). Scale bar: 60 μm. b, Quantification of data in a; data points represent fields of view collected over two replicates. c, Glutamate uptake (n = 4 wells). d, Phagocytosis of pHrodo-labeled rat synaptosomes (median pHrodo fluorescence by flow cytometry) with (n = 1 well) or without (n = 3 wells) cytochalasin D (cytoD). e, Barrier integrity of brain endothelial-like cells cultured alone (n = 6 wells) or with iAstrocytes (n = 5 wells); lines – group means, shaded bands around lines – 95% confidence intervals. f,g, Neuronal calcium activity traces of GCaMP iNeurons co-cultured with iAstrocytes treated with vehicle or IL-1α+TNF+C1q; traces from individual neurons are overlaid. h, Synchrony between neuronal calcium activity traces in iNeuron mono-cultures or iNeuron + iAstrocyte co-cultures treated with vehicle or IL-1α+TNF+C1q (n = 8 wells). i, Experiments assessing inflammatory reactivity. j, Phagocytosis of pHrodo-labeled rat synaptosomes by iAstrocytes treated with vehicle or IL-1α+TNF+C1q with (n = 1 well) or without (n = 3 wells) cytoD. k, Percentage of dead cells (TO-PRO-3 permeability) for iNeurons incubated with unconditioned astrocyte media with or without IL-1α+TNF+C1q (n = 14 or 16 wells, respectively) or astrocyte media conditioned by iAstrocytes treated with vehicle or IL-1α+TNF+C1q (n = 23 or 24 wells, respectively). l, Log-scaled fold change vs. average expression of differentially expressed genes (RNA-seq) induced by IL-1α+TNF+C1q in iAstrocytes (n = 3 wells). m, Representative histogram of cell-surface VCAM1 levels (flow cytometry) in iAstrocytes treated with vehicle or IL-1α+TNF+C1q. n, Percent of VCAM1+ iAstrocytes after treatment with vehicle or IL-1α+TNF+C1q (n = 4 wells). In panels c, h, k, and n, P values were calculated using the two-sided Mann-Whitney U test. In panels d and j, P values were calculated using the two-sided Student’s t-test. In panel l, P values were calculated and adjusted for multiple testing (Benjamini-Hochberg method) using DESeq2 (two-sided Wald test; see Methods).
Fig. 2 |
Fig. 2 |. CRISPR interference (CRISPRi) platform in iAstrocytes.
a, Schematic of CRISPRi machinery cassette integrated into the CLYBL safe-harbor locus. b, Workflow schematic of experiments involving lentiviral sgRNA transduction of iAstrocytes for CRISPRi knockdown. c, Cell-surface TFRC levels (measured by flow cytometry using an anti-TFRC antibody or isotype control; MFI: median fluorescence intensity) in iAstrocytes transduced with a non-targeting control (NTC) sgRNA or a sgRNA targeting TFRC, treated with vehicle control or IL-1α+TNF+C1q (n = 4 wells for anti-TFRC, n = 2 wells for isotype control).
Fig. 3 |
Fig. 3 |. CRISPRi screening and master regulator analysis uncover regulators of inflammatory reactivity.
a, Workflow schematic of synaptosome phagocytosis and cell-surface VCAM1 CRISPRi screens (n = 2 independent screens). b, Workflow schematic of bioinformatic master regulator analysis (MRA). c, f, Clustering of transcription factors (c) or kinases and phosphatases (f) predicted to regulate inflammatory reactivity based on regulon overlap (see Methods); the activity score and regulon mean log-fold-change (LFC) associated with each predicted regulator (see Methods) are shown below the dendrogram. d, g, Scatterplot of gene scores (see Methods) of transcription factors (d) or the druggable genome (g) from synaptosome phagocytosis screens on iAstrocytes treated with vehicle control vs. IL-1α+TNF+C1q. e, h, Volcano plot of phenotype scores and associated log-scaled P values (see Methods) of transcription factors (e) or the druggable genome (h) from cell-surface VCAM1 screens on iAstrocytes treated with IL-1α+TNF+C1q. P values in panels e and h were calculated using the two-sided Mann-Whitney U test (see Methods).
Fig. 4 |
Fig. 4 |. CROP-seq of iAstrocytes reveals two distinct inflammatory reactive signatures dependent on the canonical NF-kB pathway.
a, Uniform manifold approximation projection (UMAP) of single-cell transcriptomes of iAstrocytes transduced with a non-targeting control (NTC) sgRNA treated with vehicle control or IL-1α+TNF+C1q, colored by cytokine treatment or cluster assignment. b, Visualization of transcript levels of selected Cluster 1 and Cluster 2 markers in the iAstrocytes shown in panel a, overlaid onto the same UMAP embedding. c, Cellular pathway (MSigDB) and upstream transcription factor (TRRUST) enrichment analysis of Cluster 1 and Cluster 2 markers; TF – transcription factor. d, Aligned UMAP embedding (see Methods) of NTC sgRNA transduced iAstrocytes with iAstrocytes transduced with sgRNAs knocking down RELA, IKBKG, or MAP3K7. e, Heatmap of Cluster 1 and Cluster 2 marker transcript levels in IL-1α+TNF+C1q-treated NTC sgRNA iAstrocytes compared to IL-1α+TNF+C1q-treated RELA, IKBKG, or MAP3K7 sgRNA iAstrocytes. f, VCAM1/C3 levels (MFI: median fluorescence intensity) or percent positive cells measured by flow cytometry in NTC, RELA, IKBKG, or MAP3K7 sgRNA iAstrocytes treated with vehicle control or IL-1α+TNF+C1q (n = 3 wells). g, Representative images of NF-κB p65 immunostaining or Hoechst counterstain in iAstrocytes treated with vehicle control or IL-1α+TNF+C1q. Scale bar: 60 μm. h, Quantification of NF-κB p65 nuclear localization (integrated fluorescence intensity masked to Hoechst; n = 3 wells). In panel c, the adjusted P values were derived from Enrichr. In panel f, P values were calculated using linear regression for MFI values or beta regression for percentages (two-sided Wald test; see Methods) and adjusted for multiple testing (Padj; Holm’s method) per family of tests (all comparisons made within a plot). In panel c, P values were calculated using the two-sided Fisher’s exact test and adjusted for multiple testing using the Benjamini-Hochberg method. In panel h, the P value was calculated using the two-sided student’s t-test. In panels b and d, NTC sgRNA astrocytes in Cluster 1 or Cluster 2 are circled by colored dotted lines.
Fig. 5 |
Fig. 5 |. IL-6 and interferons act in an autocrine-paracrine manner downstream of IL-1α+TNF+C1q.
a, Cytokine concentrations in conditioned media (measured by multi-spot electrochemiluminescence) from iAstrocytes treated with vehicle control or IL-1α+TNF+C1q (n = 3 wells). b, VCAM1/C3 levels (MFI: median fluorescence intensity) or percent positive cells measured by flow cytometry from NTC sgRNA iAstrocytes compared to iAstrocytes transduced with sgRNAs knocking down genes or gene pairs involved in IL-6 or interferon (IFN) signaling as indicated (n = 3 wells). c, Levels of phosphorylated STAT3 (Y705; p-STAT3) or phosphorylated STAT1 (Y701; p-STAT1) measured by flow cytometry in iAstrocytes treated with vehicle control or IL-1α+TNF+C1q (n = 6 wells for p-STAT3 and n = 9 wells for p-STAT1). d, Transcript levels of CSF2 and GM-CSF overlaid onto the UMAP embedding from Fig. 3a. e, Concentration of GM-CSF or CXCL10 in conditioned media from iAstrocytes transduced with sgRNAs knocking down genes or gene pairs involved in IL-6 or IFN signaling as indicated (n = 4 wells). In panels a and c, P values were calculated using the two-sided Student’s t-test. In panels b and e, P values were calculated using linear regression for MFI values or beta regression for percentages (two-sided Wald test; see Methods), and only comparisons with statistically significant differences are marked. Where appropriate, P values were adjusted for multiple testing (Padj; Holm’s method) per family of tests (all comparisons made within a plot).
Fig. 6 |
Fig. 6 |. Differential regulation of distinct inflammatory reactive signatures by cytokines and cellular factors.
a, Representative contour plot of VCAM1 and C3 levels measured by flow cytometry in iAstrocytes treated with vehicle control or IL-1α+TNF+C1q. b, Percent VCAM1−/C3+, VCAM1+/C3−, or VCAM1+/C3+ cells measured by flow cytometry in iAstrocytes treated with vehicle control vs. all possible combinations of IL-1α, TNF, and C1q, in the absence or presence of additional IL-6/IL6R chimera (25 ng/mL) or IFN-β (5 ng/mL) added concurrently (n = 6 wells). c, Percent VCAM1−/C3+, VCAM1+/C3−, or VCAM1+/C3+ cells measured by flow cytometry in NTC sgRNA iAstrocytes compared to iAstrocytes transduced with sgRNAs knocking down genes involved in IL-6 or IFN signaling (n = 5 wells). d, IL-6 or IFN-β concentration in conditioned media (measured by multi-spot electrochemiluminescence) from NTC iAstrocytes vs. iAstrocytes with knockdown of CEBPB, STAT3, IRF1, or STAT1/2 treated with vehicle control or IL-1α+TNF+C1q (n = 4 wells). e, Model of transcription factors and signaling pathways controlling inflammatory reactivity induced by IL-1α+TNF+C1q. In panels b, c, and d, P values were calculated using linear regression for MFI values or beta regression for percentages (two-sided Wald test; see Methods), and only comparisons with statistically significant differences are marked. Where appropriate, P values were adjusted for multiple testing (Padj; Holm’s method) per family of tests (all comparisons made within a plot).
Fig. 7 |
Fig. 7 |. Integration of iAstrocyte single-cell data with published single-cell datasets shows overlap of inflammatory reactive signatures across species in diverse disease contexts.
a, UMAP of integrated analysis (see Methods) of NTC sgRNA iAstrocytes with astrocytes from Barbar et al., colored by cluster assignment or astrocyte source. b-c, The same UMAP embedding as in a, showing only iAstrocytes colored by cytokine treatment or Fig. 4a cluster assignment (b) or Barbar et al. astrocytes colored by cytokine treatment (c). d, Cluster-averaged expression levels of selected cluster markers in Barbar et al. astrocytes (n = 2 cell lines). e, UMAP of integrated analysis of NTC sgRNA iAstrocytes with astrocytes from Wheeler et al., colored by cluster assignment or astrocyte source. f-g, The same UMAP embedding as in e, showing only iAstrocytes colored by cytokine treatment or Fig. 4a cluster assignment (f) or astrocytes from Wheeler et al. colored by EAE stage (g). h, Cluster-averaged expression levels of selected cluster markers in Wheeler et al. astrocytes (n = 8 mice). i, UMAP of integrated analysis of NTC sgRNA iAstrocytes with astrocytes from Hasel et al., colored by cluster assignment or astrocyte source. j-k, The same UMAP embedding as in i, showing only iAstrocytes colored by cytokine treatment or Fig. 4a cluster assignment (j) or astrocytes from Hasel et al. colored by LPS treatment (k). l, Cluster-averaged expression levels of selected cluster markers in Hasel et al. astrocytes (n = 12 mice).
Fig. 8 |
Fig. 8 |. Markers of distinct inflammatory reactive signatures are upregulated in astrocytes in human Alzheimer’s disease (AD) and hypoxic-ischemic encephalopathy (HIE) and are regulated by Stat3 in a mouse model of neuroinflammation.
a-h, Post-mortem human brain sections. a,c, Representative immunofluorescence images of C3+ (a) or VCAM1+ (c) astrocytes (marked by arrowheads) in an AD case compared to an age-matched control. Staining for VCAM1 and C3 was performed simultaneously (the same image is shown twice with different marker combinations). Scale bars correspond to 20 μm. b,d, Quantification of the percentage of C3+ (b) or VCAM1+ (d) astrocytes in AD cases (n = 8 individuals) vs. age-matched controls (n = 8 individuals). e,g, Representative immunofluorescence images of C3+ (e) or VCAM1+ (g) astrocytes (marked by arrowheads) in a HIE case compared to an age-matched control. Staining for VCAM1 or C3 was performed separately. Scale bars correspond to 10 μm. f,h, Quantification of the percentage of C3+ (f) or VCAM1+ (h) astrocytes in HIE cases (n = 4 individuals) vs. age-matched controls (n = 4 individuals). i-n, Brain sections from mice injected with vehicle or LPS. i,l, Representative immunofluorescence images of GFAP in the corpus callosum (i) or hippocampus (l). Scale bars correspond to 100 μm. j,m, Representative images of C3, Isg15, and Gfap staining in the corpus callosum (j) or hippocampus (m) in wild-type (WT; n = 6 for untreated or LPS-treated) or Stat3 astrocyte-specific conditional knockout (Stat3-cKO; n = 4 for untreated or 6 for LPS-treated) mice. Staining for C3 and Isg15 was performed simultaneously (the same image is shown twice with different marker combinations). Representative Isg15−/C3+ (solid arrowheads), Isg15+/C3− (empty arrowheads), and Isg15+/C3+ astrocytes (striped arrowheads) are labeled. k,n, Quantification of the percentage of Isg15−/C3+, Isg15+/C3−, and Isg15+/C3+ astrocytes in the corpus callosum (k) or hippocampus (n). P values were calculated using the two-sided Mann-Whitney U test in b, d, f, and h and beta regression (two-sided Wald test; see Methods) in k and n. For beta regression in k and n, sex was included as a covariate.

References

    1. Escartin C, et al. Reactive astrocyte nomenclature, definitions, and future directions. Nat Neurosci 24, 312–325 (2021). - PMC - PubMed
    1. Sofroniew MV & Vinters HV Astrocytes: biology and pathology. Acta Neuropathol 119, 7–35 (2010). - PMC - PubMed
    1. Burda JE, et al. Divergent transcriptional regulation of astrocyte reactivity across disorders. Nature 606, 557–564 (2022). - PMC - PubMed
    1. Wang Q, Tang XN & Yenari MA The inflammatory response in stroke. J Neuroimmunol 184, 53–68 (2007). - PMC - PubMed
    1. Hausmann ON Post-traumatic inflammation following spinal cord injury. Spinal Cord 41, 369–378 (2003). - PubMed

METHODS-ONLY REFERENCES

    1. Miyaoka Y, et al. Isolation of single-base genome-edited human iPS cells without antibiotic selection. Nat Methods 11, 291–293 (2014). - PMC - PubMed
    1. TCW J, et al. Cholesterol and matrisome pathways dysregulated in human APOE ε4 glia. bioRxiv, 713362 (2019).
    1. Krencik R, et al. Dysregulation of astrocyte extracellular signaling in Costello syndrome. Sci Transl Med 7, 286ra266 (2015). - PMC - PubMed
    1. Tian R, et al. CRISPR Interference-Based Platform for Multimodal Genetic Screens in Human iPSC-Derived Neurons. Neuron 104, 239–255 e212 (2019). - PMC - PubMed
    1. Li XL, et al. Highly efficient genome editing via CRISPR-Cas9 in human pluripotent stem cells is achieved by transient BCL-XL overexpression. Nucleic Acids Res 46, 10195–10215 (2018). - PMC - PubMed

Publication types