. 2022 Nov;25(11):1569-1581.
doi: 10.1038/s41593-022-01186-3. Epub 2022 Oct 27.

Mapping neurotransmitter systems to the structural and functional organization of the human neocortex

Affiliations

Mapping neurotransmitter systems to the structural and functional organization of the human neocortex

Justine Y Hansen et al. Nat Neurosci. 2022 Nov.

Abstract

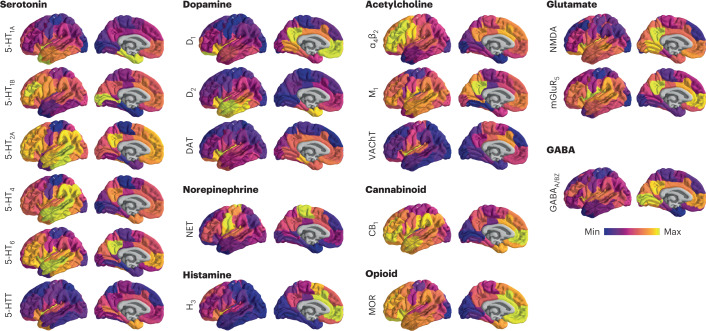
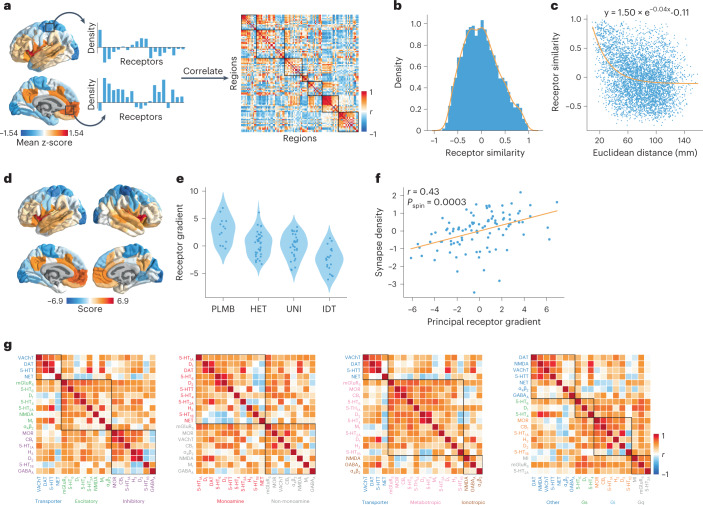
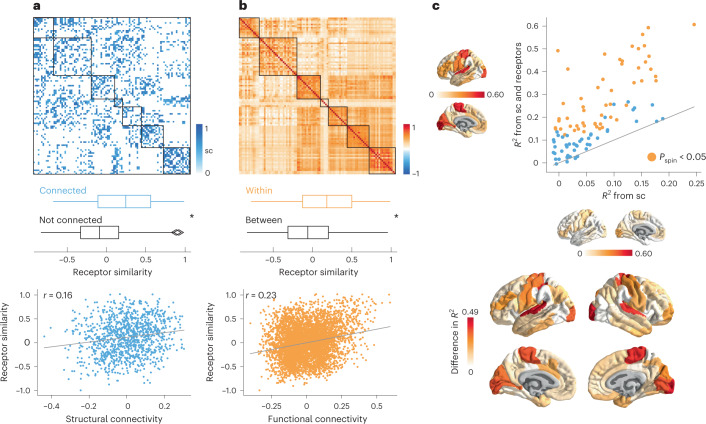
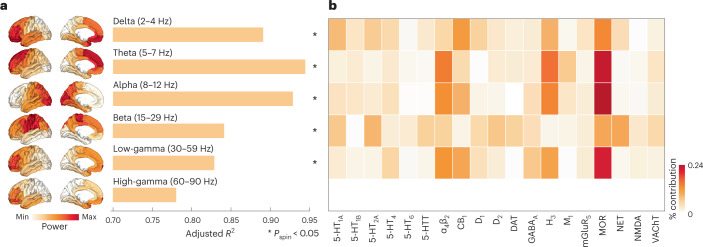
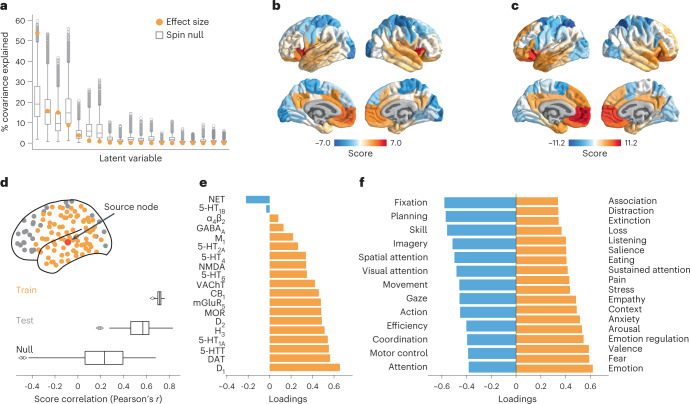
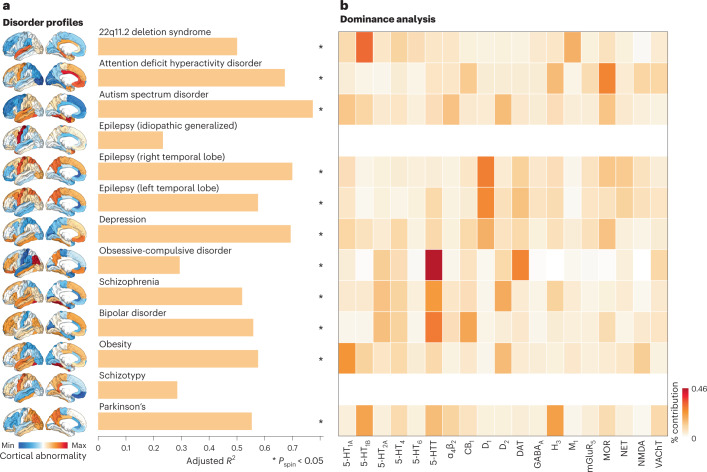
Neurotransmitter receptors support the propagation of signals in the human brain. How receptor systems are situated within macro-scale neuroanatomy and how they shape emergent function remain poorly understood, and there exists no comprehensive atlas of receptors. Here we collate positron emission tomography data from more than 1,200 healthy individuals to construct a whole-brain three-dimensional normative atlas of 19 receptors and transporters across nine different neurotransmitter systems. We found that receptor profiles align with structural connectivity and mediate function, including neurophysiological oscillatory dynamics and resting-state hemodynamic functional connectivity. Using the Neurosynth cognitive atlas, we uncovered a topographic gradient of overlapping receptor distributions that separates extrinsic and intrinsic psychological processes. Finally, we found both expected and novel associations between receptor distributions and cortical abnormality patterns across 13 disorders. We replicated all findings in an independently collected autoradiography dataset. This work demonstrates how chemoarchitecture shapes brain structure and function, providing a new direction for studying multi-scale brain organization.


Conflict of interest statement

J.M.D. is currently an employee of, and has financial interest in, Biogen, Inc. However, the work contributing to this manuscript is in no way related to his employment at Biogen. R.D.M. is currently employed by Octave Bioscience. However, the work contributing to this manuscript is in no way related to his employment at Octave Bioscience. The remaining authors declare no competing interests.

Figures

Fig. 1
Fig. 1. PET images of neurotransmitter receptors and transporters.
PET tracer images were collated and averaged to produce mean receptor distribution maps of 19 different neurotransmitter receptors and transporters across nine different neurotransmitter systems and a combined total of more than 1,200 healthy participants.
Fig. 2
Fig. 2. Constructing a cortical neurotransmitter receptor and transporter atlas.
PET maps for 19 different neurotransmitter receptors and transporters were z-scored and collated into a single neurotransmitter receptor atlas. a, For each pair of brain regions, the receptor density profiles are correlated (Pearsonʼs r) to construct the receptor similarity matrix (ordered according to the Yeo–Krienen intrinsic networks: frontoparietal, default mode, dorsal attention, limbic, ventral attention, somatomotor and visual). b, Receptor similarity is approximately normally distributed. c, Receptor similarity decays exponentially with the Euclidean distance between centroid coordinates of brain regions. d, The first principal component of receptor density. e, The first principal gradient of receptor density stratified by classes of laminar differentiation reveals a gradient from idiotypic regions to paralimbic regions (one-way ANOVA F = 15.82, P = 1.95 × 10−8; PLMB, paralimbic; HET, heteromodal; UNI, unimodal; IDT, idiotypic). f, The principal receptor gradient is significantly correlated with synapse density (measured using the synaptic vesicle glycoprotein 2A-binding [11C]-UCBJ PET tracer; Pearsonʼs r(98) = 0.44, Pspin = 0.0003, CI = [0.26, 0.58], two-tailed). g, Pearsonʼs correlations between pairs of receptor/transporter distributions are shown stratified by excitatory versus inhibitory, monoamine versus non-monoamine, ionotropic versus metabotropic and Gs-coupled versus Gi-coupled versus Gq-coupled metabotropic receptors.
Fig. 3
Fig. 3. Receptor distributions reflect structural and functional organization.
a, Top: group consensus weighted structural connectivity matrix. Middle: Receptor similarity is significantly greater between regions that are physically connected, against distance- and edge length-preserving null structural connectivity matrices (P = 0.0001, two-tailed Nconnected = 1,136 edges, Nnotconnected = 3,814 edges). Bottom: Receptor similarity is significantly positively correlated with structural connectivity, after distance regression (Pearsonʼs r(1134) = 0.16, P = 1.6 × 10−8, CI = [0.11, 0.23], two-sided). b, Top: group-average functional connectivity matrix. Middle: Receptor similarity is significantly greater within regions in the same functional network (Pspin = 0.001, two-tailed, Nwithin = 762 edges, Nbetween = 4,188 edges). Bottom: Receptor similarity is positively correlated with functional connectivity (Pearsonʼs r(4948) = 0.23, P = 7.1 × 10−61, CI = [0.20, 0.26], two-sided). c, Regional structure–function coupling was computed as the fit (Radj2) between communicability of the weighted structural connectome and functional connectivity. Top: Structure–function coupling at each brain region is plotted when receptor similarity is excluded (x-axis) and included (y-axis) in the model. Yellow points indicate brain regions where receptor information significantly augments structure–function coupling (Pspin < 0.05, FDR-corrected, one-sided). Bottom: the difference in adjusted R2 when receptor similarity is and is not included in the regression model. Asterisks in a and b denote significance. Box plots in a and b represent the 1st, 2nd (median) and 3rd quartiles; whiskers represent the non-outlier endpoints of the distribution; and diamonds represent outliers. Connectomes in a and b are ordered according to the Yeo–Krienen intrinsic networks (order: frontoparietal, default mode, dorsal attention, limbic, ventral attention, somatomotor and visual). sc, structural connectivity.
Fig. 4
Fig. 4. Receptor profiles shape oscillatory neural dynamics.
We fit a multi-linear regression model that predicts MEG-derived power distributions from receptor distributions. a, Receptor distributions closely correspond to all six MEG-derived power bands (0.78Radj2(80)0.94). The significance of each model is assessed against a spatial permutation-preserving null model and corrected for multiple comparisons (FDR correction). Asterisks denote significant models (FDR-corrected Pspin < 0.05, one-tailed). Delta Radj2(80)=0.89, Pspin = 0.03; theta Radj2(80)=0.94, Pspin = 0.0006; alpha Radj2(80)=0.93, Pspin = 0.0006; beta Radj2(80)=0.84, Pspin = 0.008; low-gamma Radj2(80)=0.83, Pspin = 0.04; and high-gamma Radj2(80)=0.78, Pspin = 0.16. b, Dominance analysis distributes the fit of the model across input variables such that the contribution of each variable can be assessed and compared to other input variables. The percent contribution of each input variable is defined as the variableʼs dominance normalized by the total fit (Radj2) of the model. Note that dominance analysis is not applied to the input variables of non-significant models (that is, high-gamma).
Fig. 5
Fig. 5. Mapping receptors to cognitive function.
a, Using PLS analysis, we found a significant latent variable that accounts for 54% of the covariation between receptor distributions and Neurosynth-derived cognitive functional activation (Pspin = 0.010, 10,000 repetitions, one-sided). b,c, This latent variable represents a pattern of co-activation between receptors (‘receptor scores’) and cognitive terms (‘cognitive scores’). d, The PLS model was cross-validated using a method that stratifies the training set (yellow points) and test set (gray points) based on the distance between each node to a source node (red point), and the procedure is repeated such that each brain region is assigned as the source node once (100 repetitions). The significance of the mean out-of-sample test set correlation was assessed against a null distribution of mean correlation constructed by rotating the receptor density matrix before the PLS analysis (see Methods for details). e, Receptor loadings are computed as the correlation (Pearsonʼs r) between each receptorʼs distribution across the cortex and the PLS-derived scores and can be interpreted as the contribution of each receptor to the latent variable. f, Similarly, cognitive loadings are computed as the correlation (Pearsonʼs r) between each termʼs functional activation across brain regions and the PLS-derived scores and can be interpreted as the cognitive processes that contribute most to the latent variable. Here, only the 25% most positively and negatively loaded cognitive processes are shown. For all stable cognitive loadings, see Supplementary Fig. 6, and, for all 123 cognitive processes included in the analysis, see Supplementary Table 2. Bounds of the box plots in a and d represent the 1st (25%) and 3rd (75%) quartiles; the center line represents the median; whiskers represent the non-outlier minima and maxima of the distribution; and open circles represent outliers.
Fig. 6
Fig. 6. Mapping receptors to disease vulnerability.
Using a multi-linear model, neurotransmitter receptor/transporter distributions were fit to patterns of cortical abnormality for 13 neurological, psychiatric and neurodevelopmental disorders, collected by the ENIGMA consortium. a, The significance of each model is assessed using a spatial autocorrelation-preserving null model and is corrected for multiple comparisons (FDR). Asterisks denote significant models (FDR-corrected Pspin < 0.05, one-sided). 22q11.2 deletion Radj2(48)=0.50, Pspin = 0.02; ADHD Radj2(48)=0.67, Pspin = 0.02; autism Radj2(48)=0.77, Pspin = 0.02; epilepsy (IGE) Radj2(48)=0.23, Pspin = 0.17; epilepsy (right) Radj2(48)=0.70, Pspin = 0.02; epilepsy (left) Radj2(48)=0.58, Pspin = 0.02; depression Radj2(48)=0.69, Pspin = 0.01; OCD Radj2(48)=0.29, Pspin = 0.02; schizophrenia Radj2(48)=0.52, Pspin = 0.02; BD Radj2(48)=0.56, Pspin = 0.01; obesity Radj2(48)=0.58, Pspin = 0.02; schizotypy Radj2(48)=0.29, Pspin = 0.32; and PD Radj2(48)=0.55, Pspin = 0.02. b, Dominance analysis distributes the fit of the model across input variables such that the contribution of each variable can be assessed and compared to other input variables. The percent contribution of each input variable is defined as the variableʼs dominance normalized by the total fit (Radj2) of the model. Note that dominance analysis is not applied to the input variables of non-significant models (that is, IGE and schizotypy) and that this analysis is conducted using the Desikan–Killiany atlas because this is the only representation of ENIGMA datasets.

References

    1. Shine JM. Neuromodulatory influences on integration and segregation in the brain. Trends Cogn. Sci. 2019;23:572–583. - PubMed
    1. Sporns O, Betzel RF. Modular brain networks. Annu. Rev. Psychol. 2016;67:613–640. - PMC - PubMed
    1. Van den Heuvel MP, Bullmore ET, Sporns O. Comparative connectomics. Trends Cogn. Sci. 2016;20:345–361. - PubMed
    1. Zilles K, Bacha-Trams M, Palomero-Gallagher N, Amunts K, Friederici AD. Common molecular basis of the sentence comprehension network revealed by neurotransmitter receptor fingerprints. Cortex. 2015;63:79–89. - PMC - PubMed
    1. Kringelbach ML, et al. Dynamic coupling of whole-brain neuronal and neurotransmitter systems. Proc. Natl Acad. Sci. USA. 2020;117:9566–9576. - PMC - PubMed

Publication types

Substances