. 2022 Nov;25(11):1420-1433.
doi: 10.1038/s41593-022-01185-4. Epub 2022 Oct 27.

Age-related Huntington's disease progression modeled in directly reprogrammed patient-derived striatal neurons highlights impaired autophagy

Affiliations

Age-related Huntington's disease progression modeled in directly reprogrammed patient-derived striatal neurons highlights impaired autophagy

Young Mi Oh et al. Nat Neurosci. 2022 Nov.

Abstract

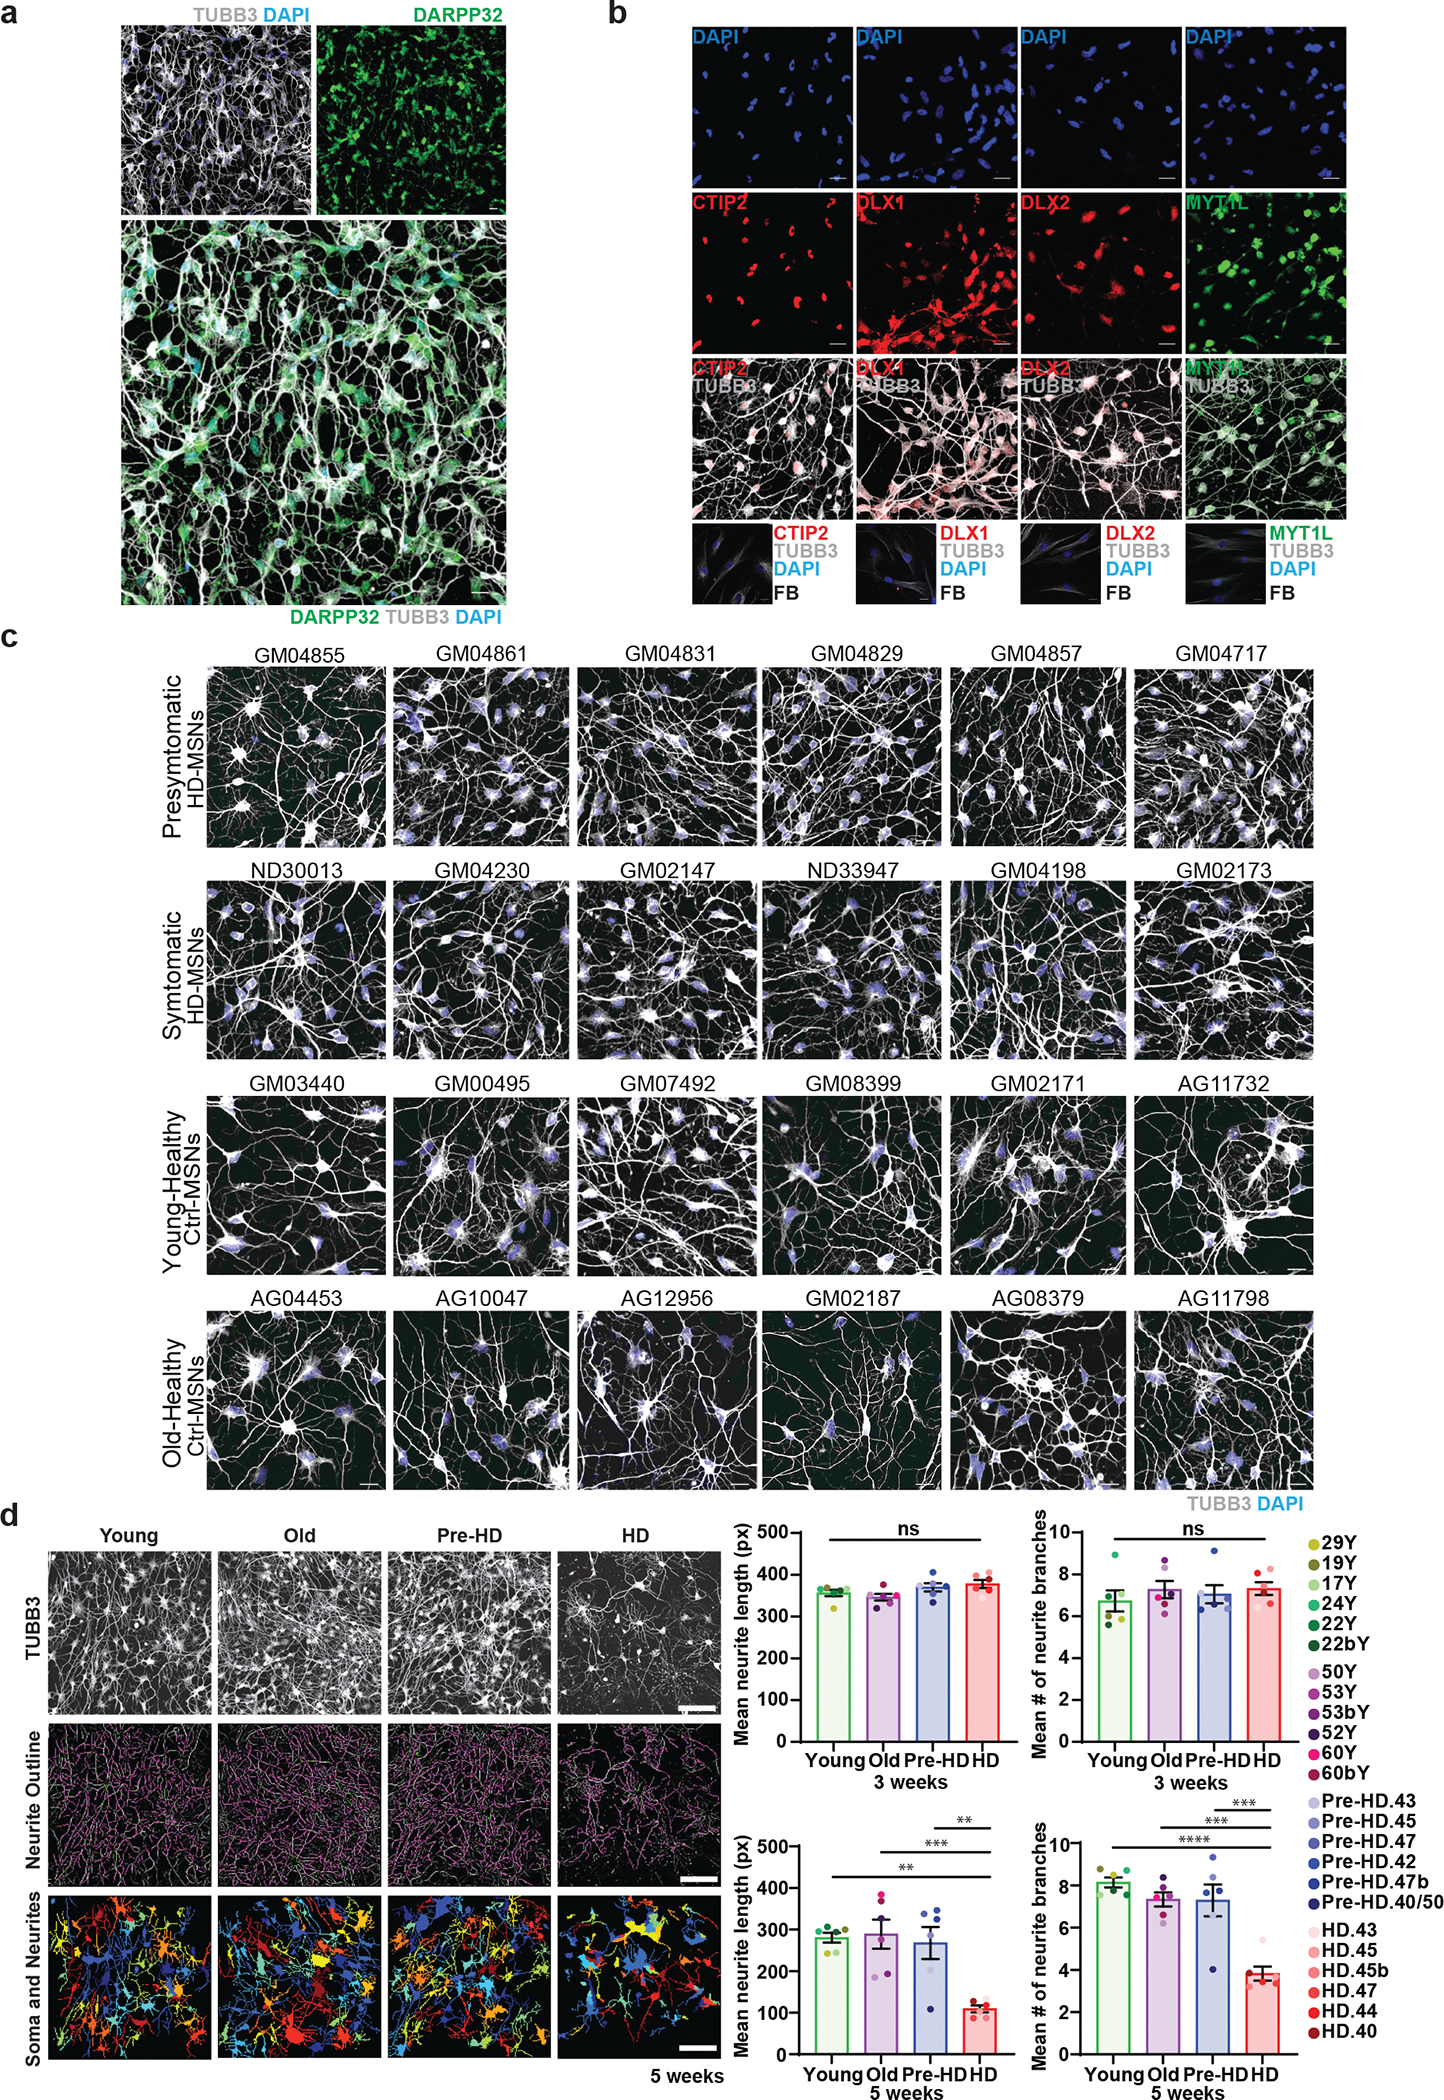
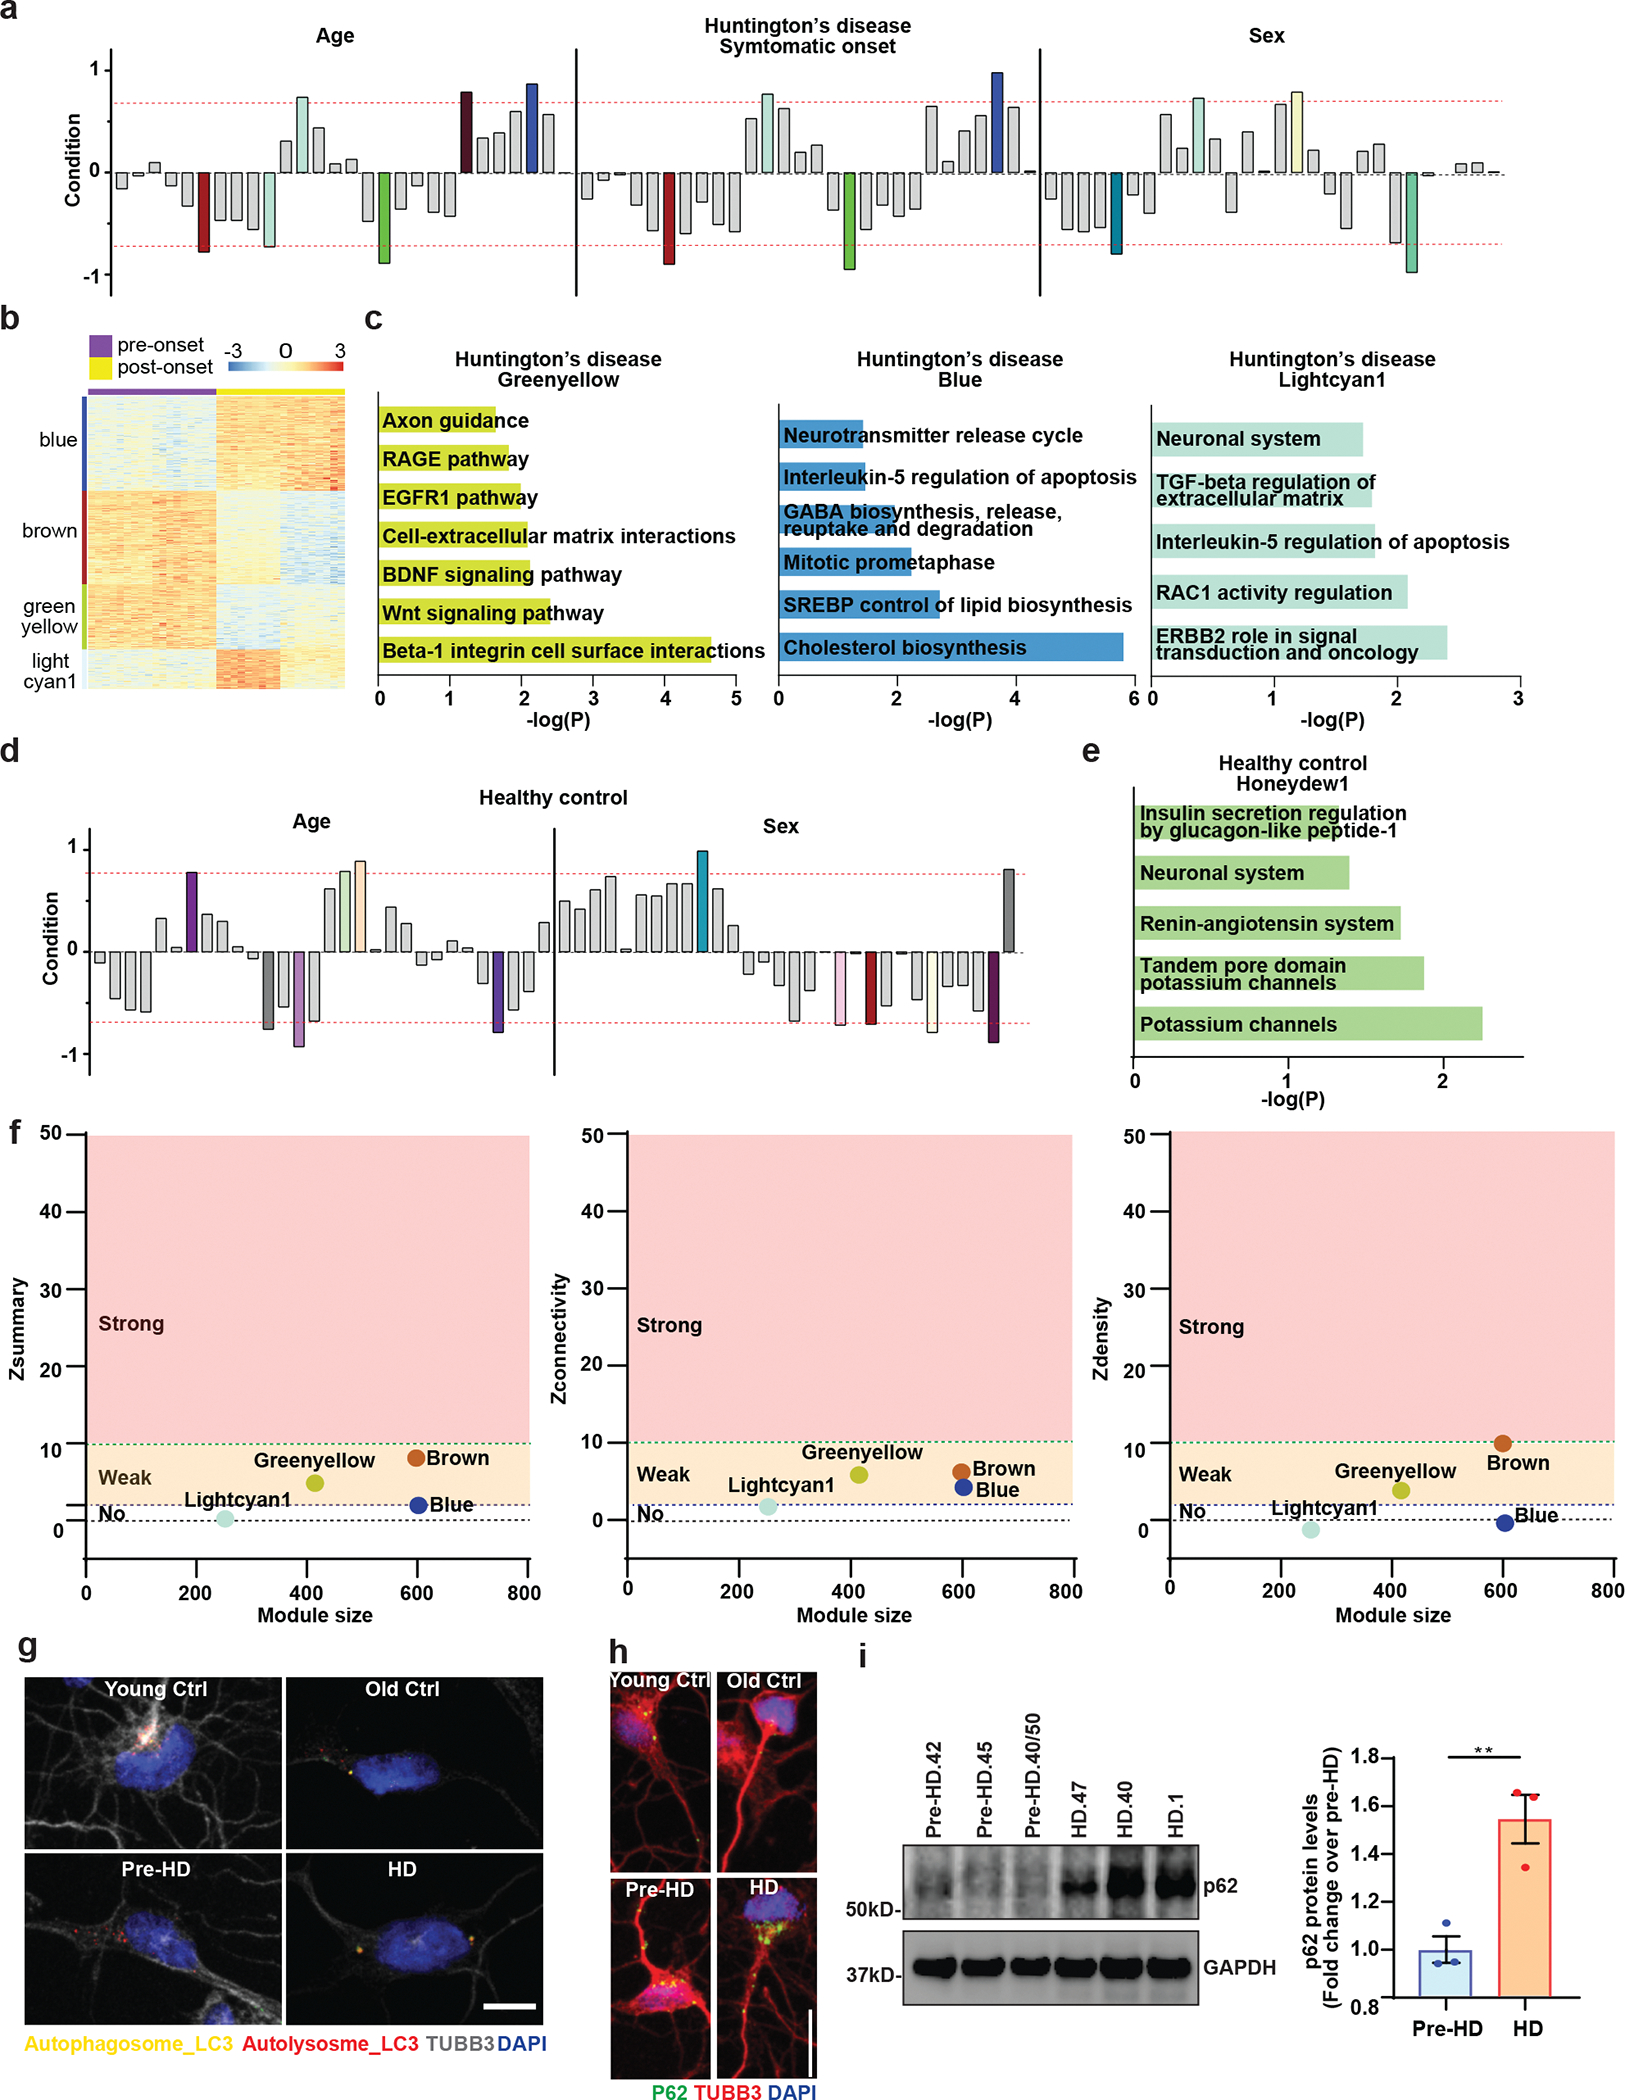
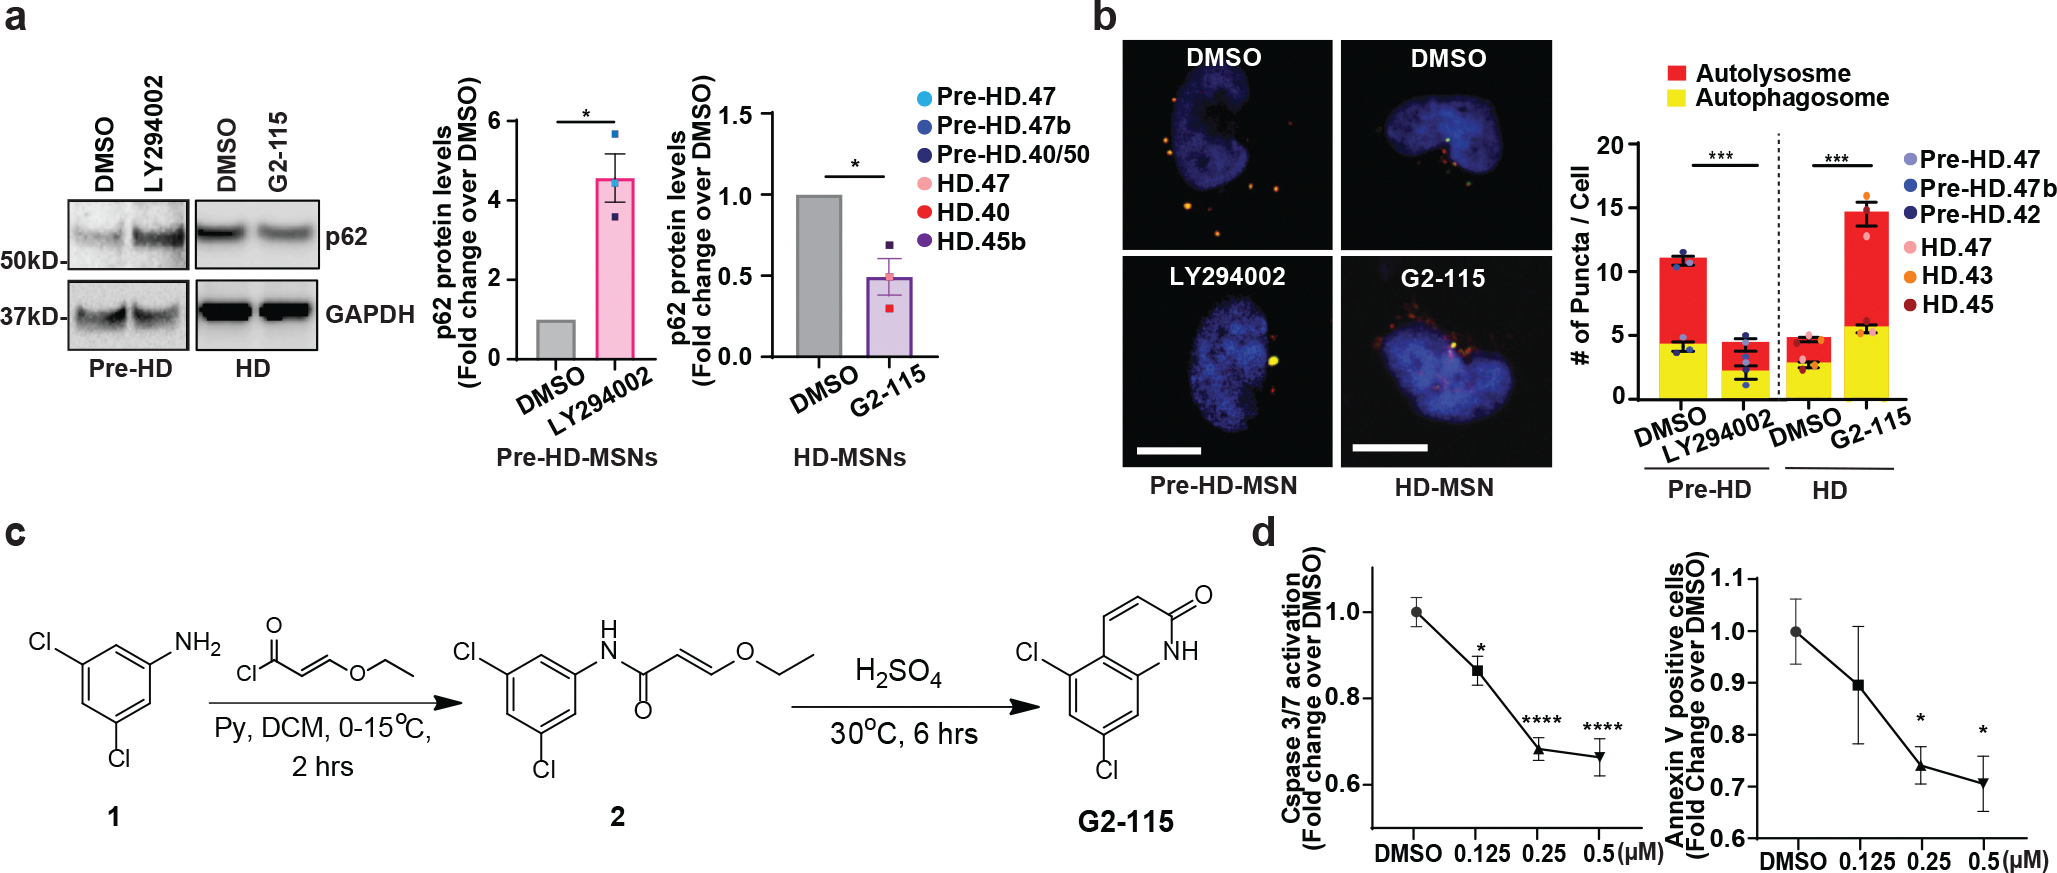
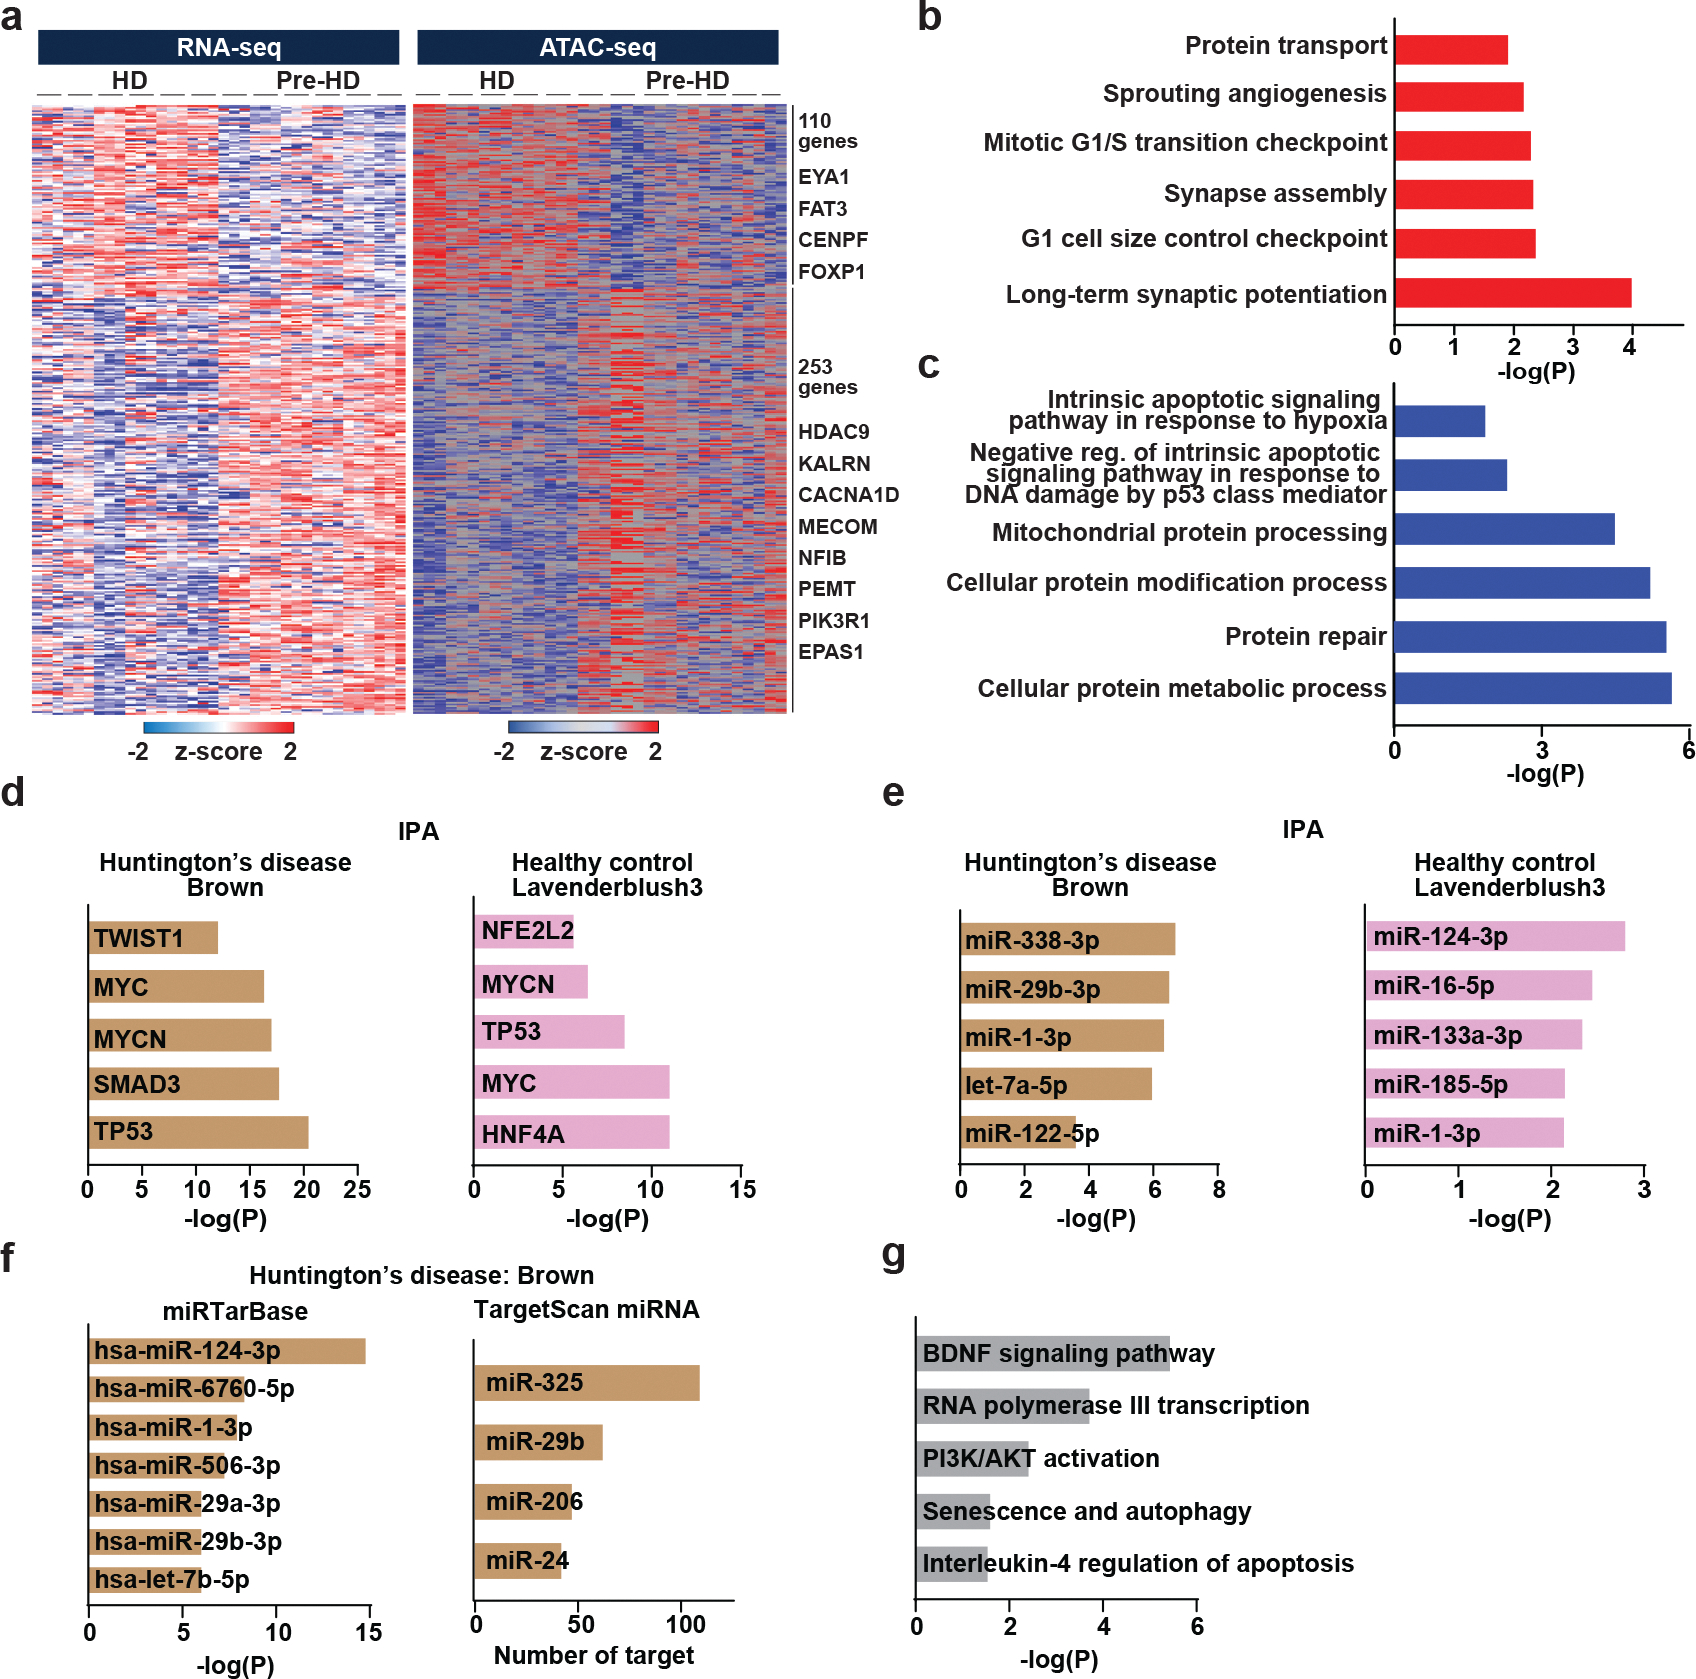
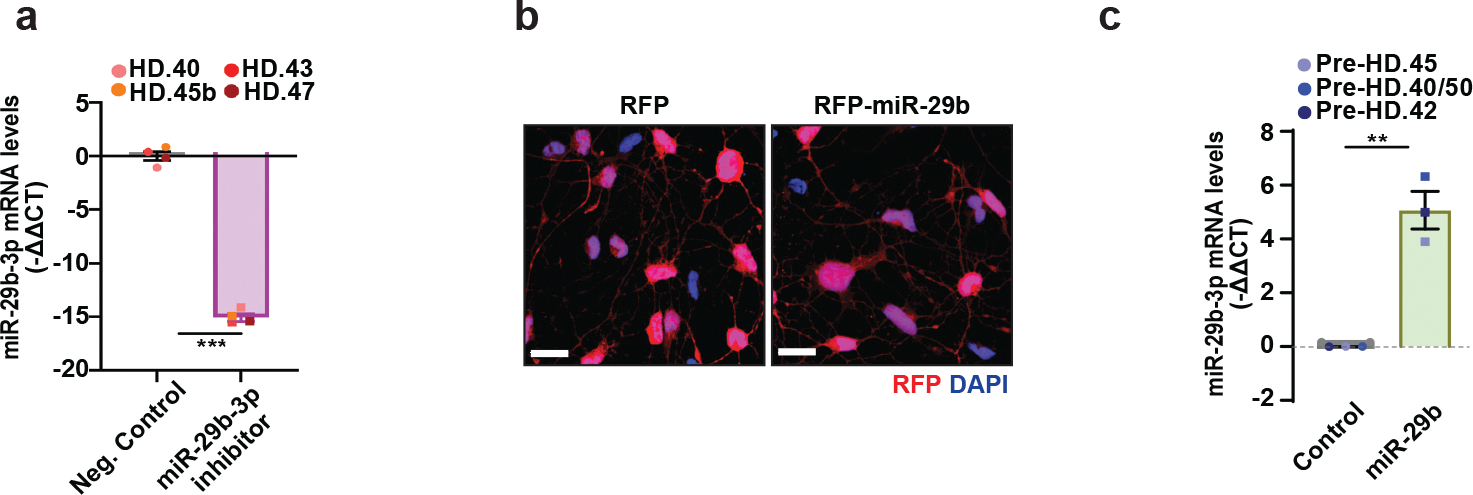
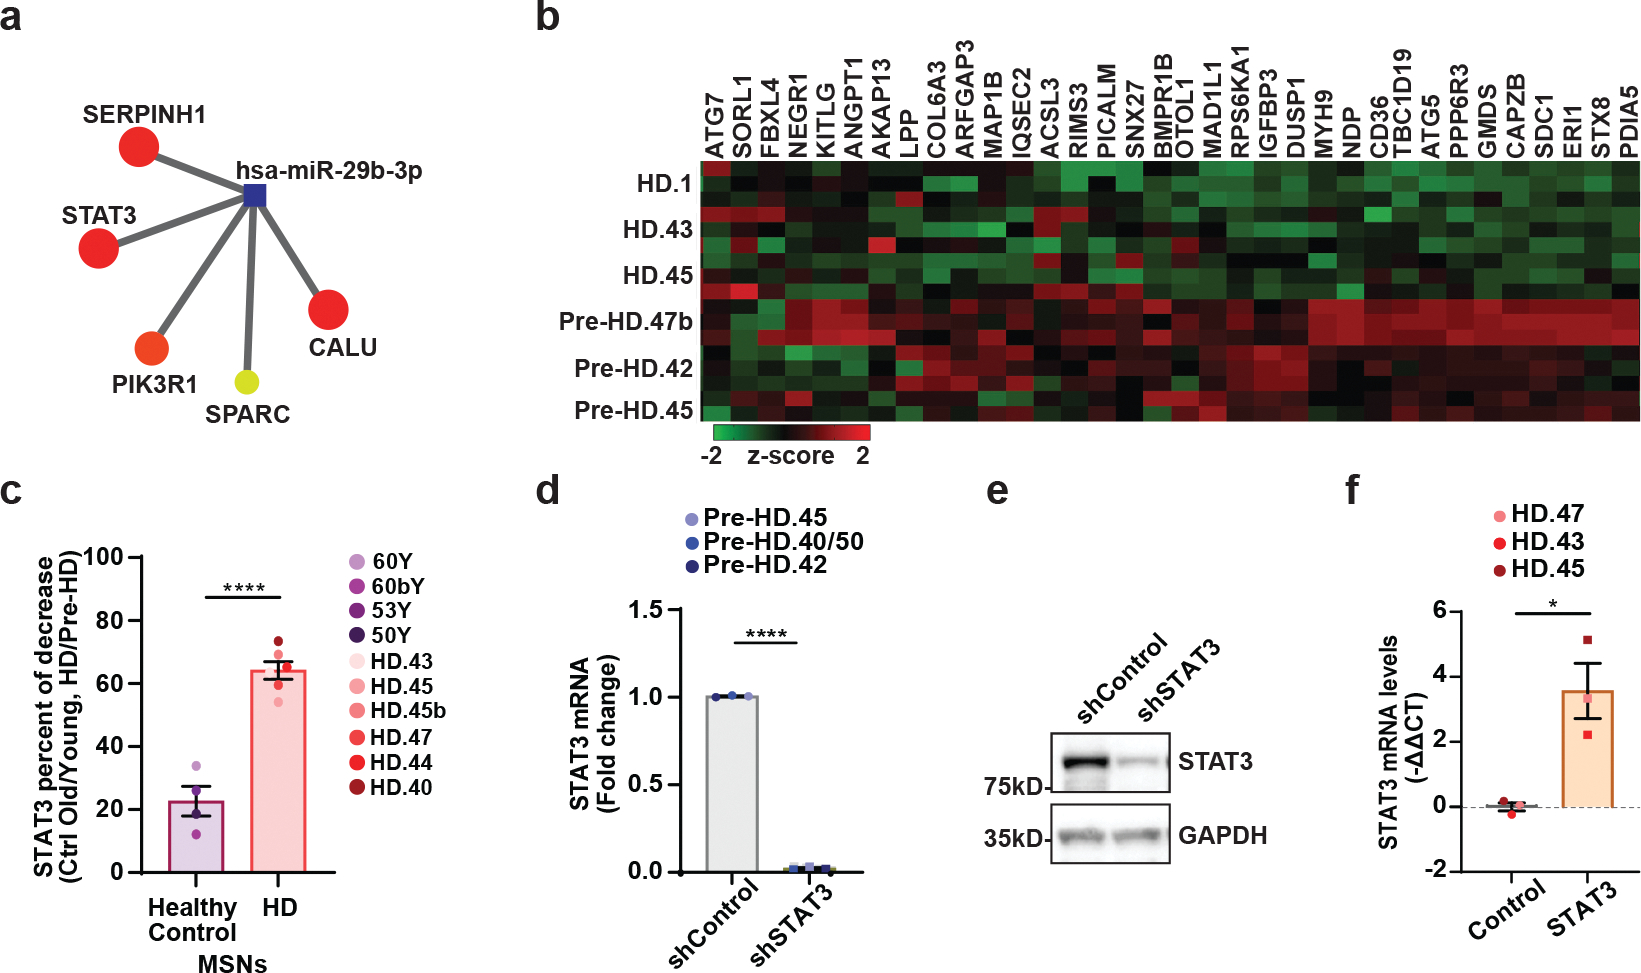
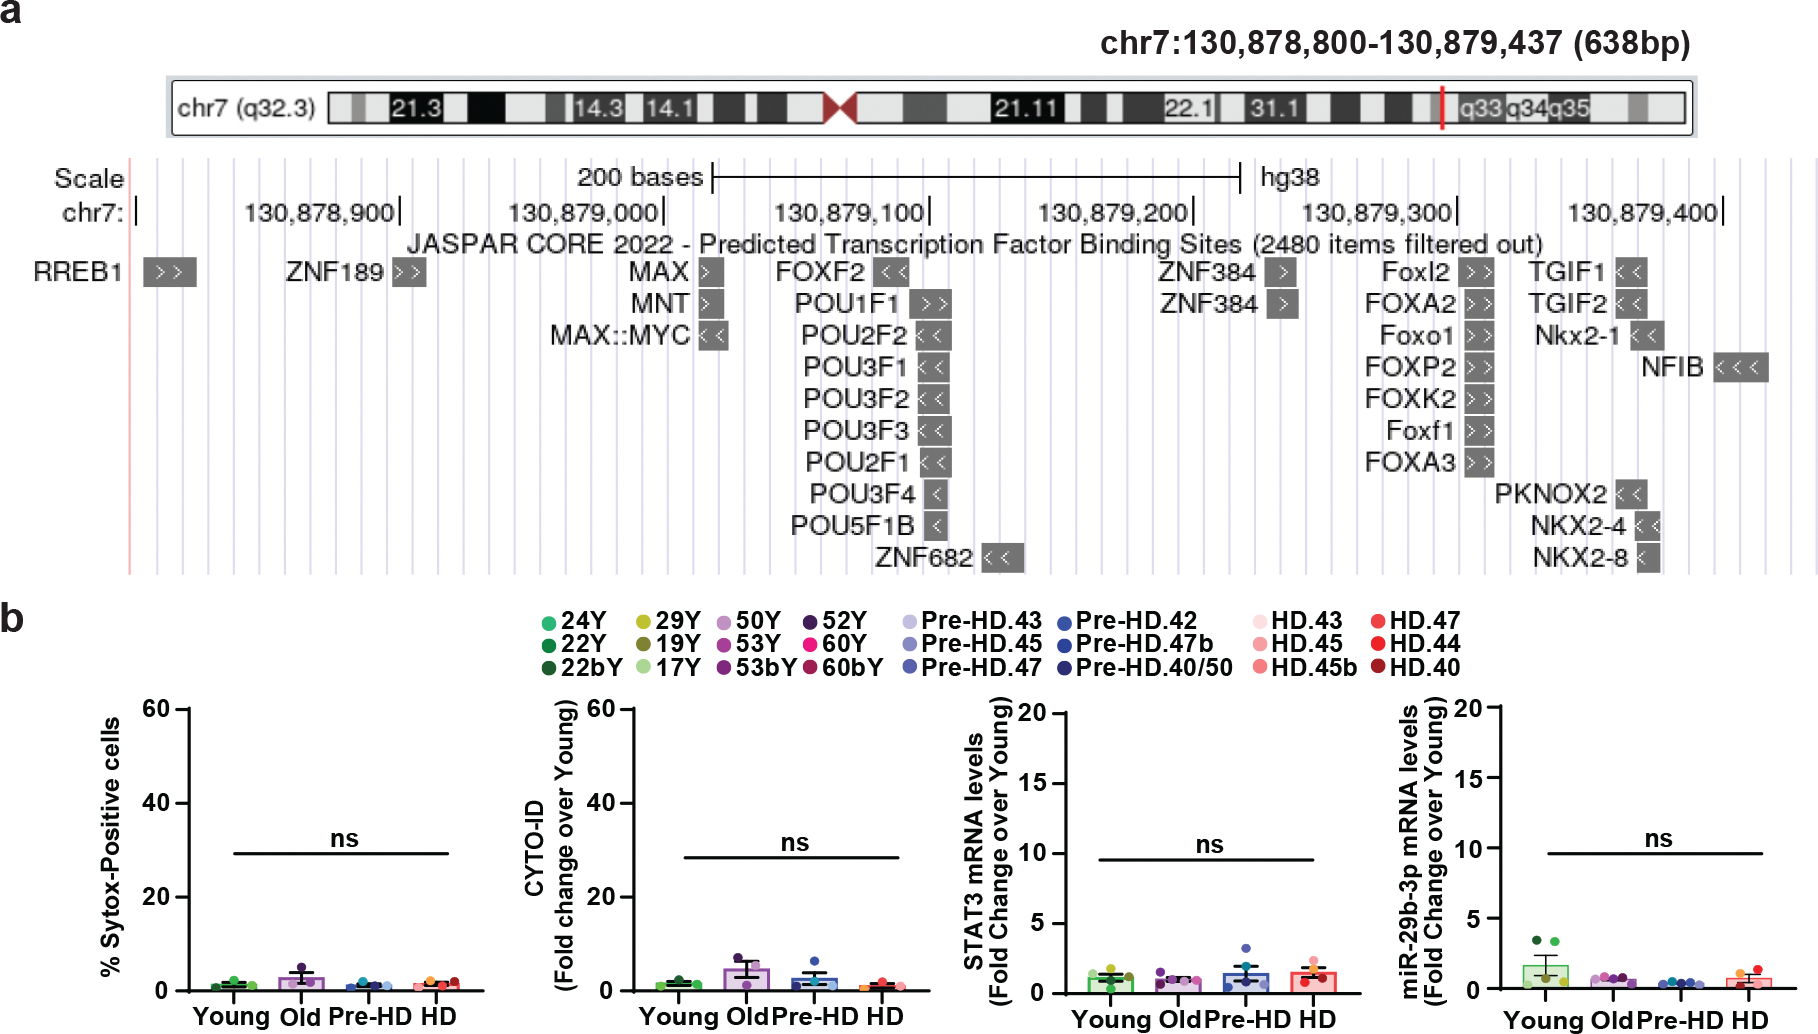
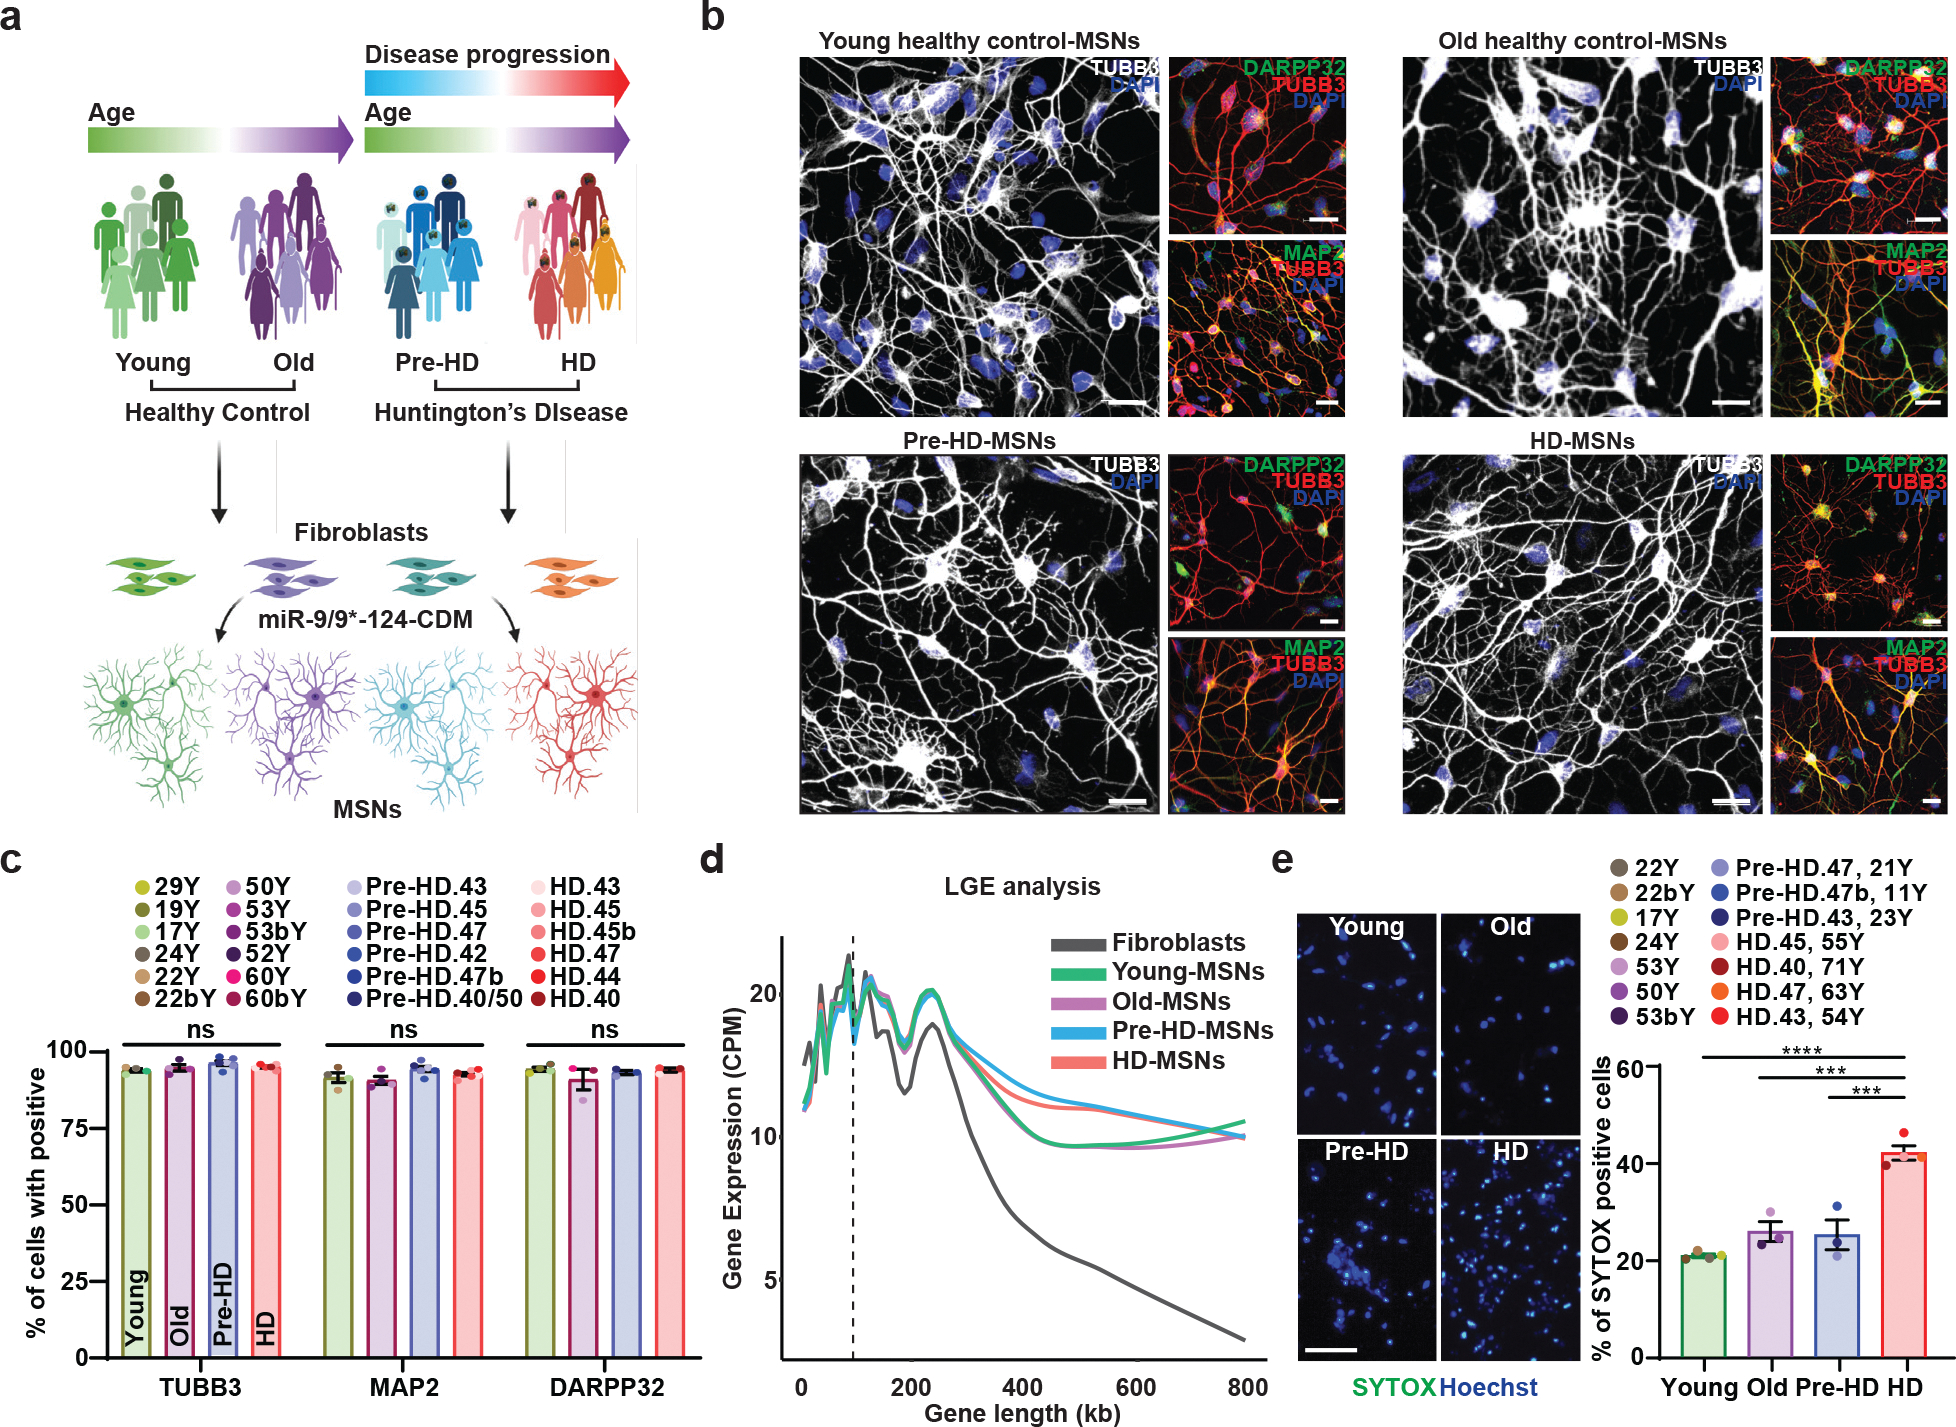
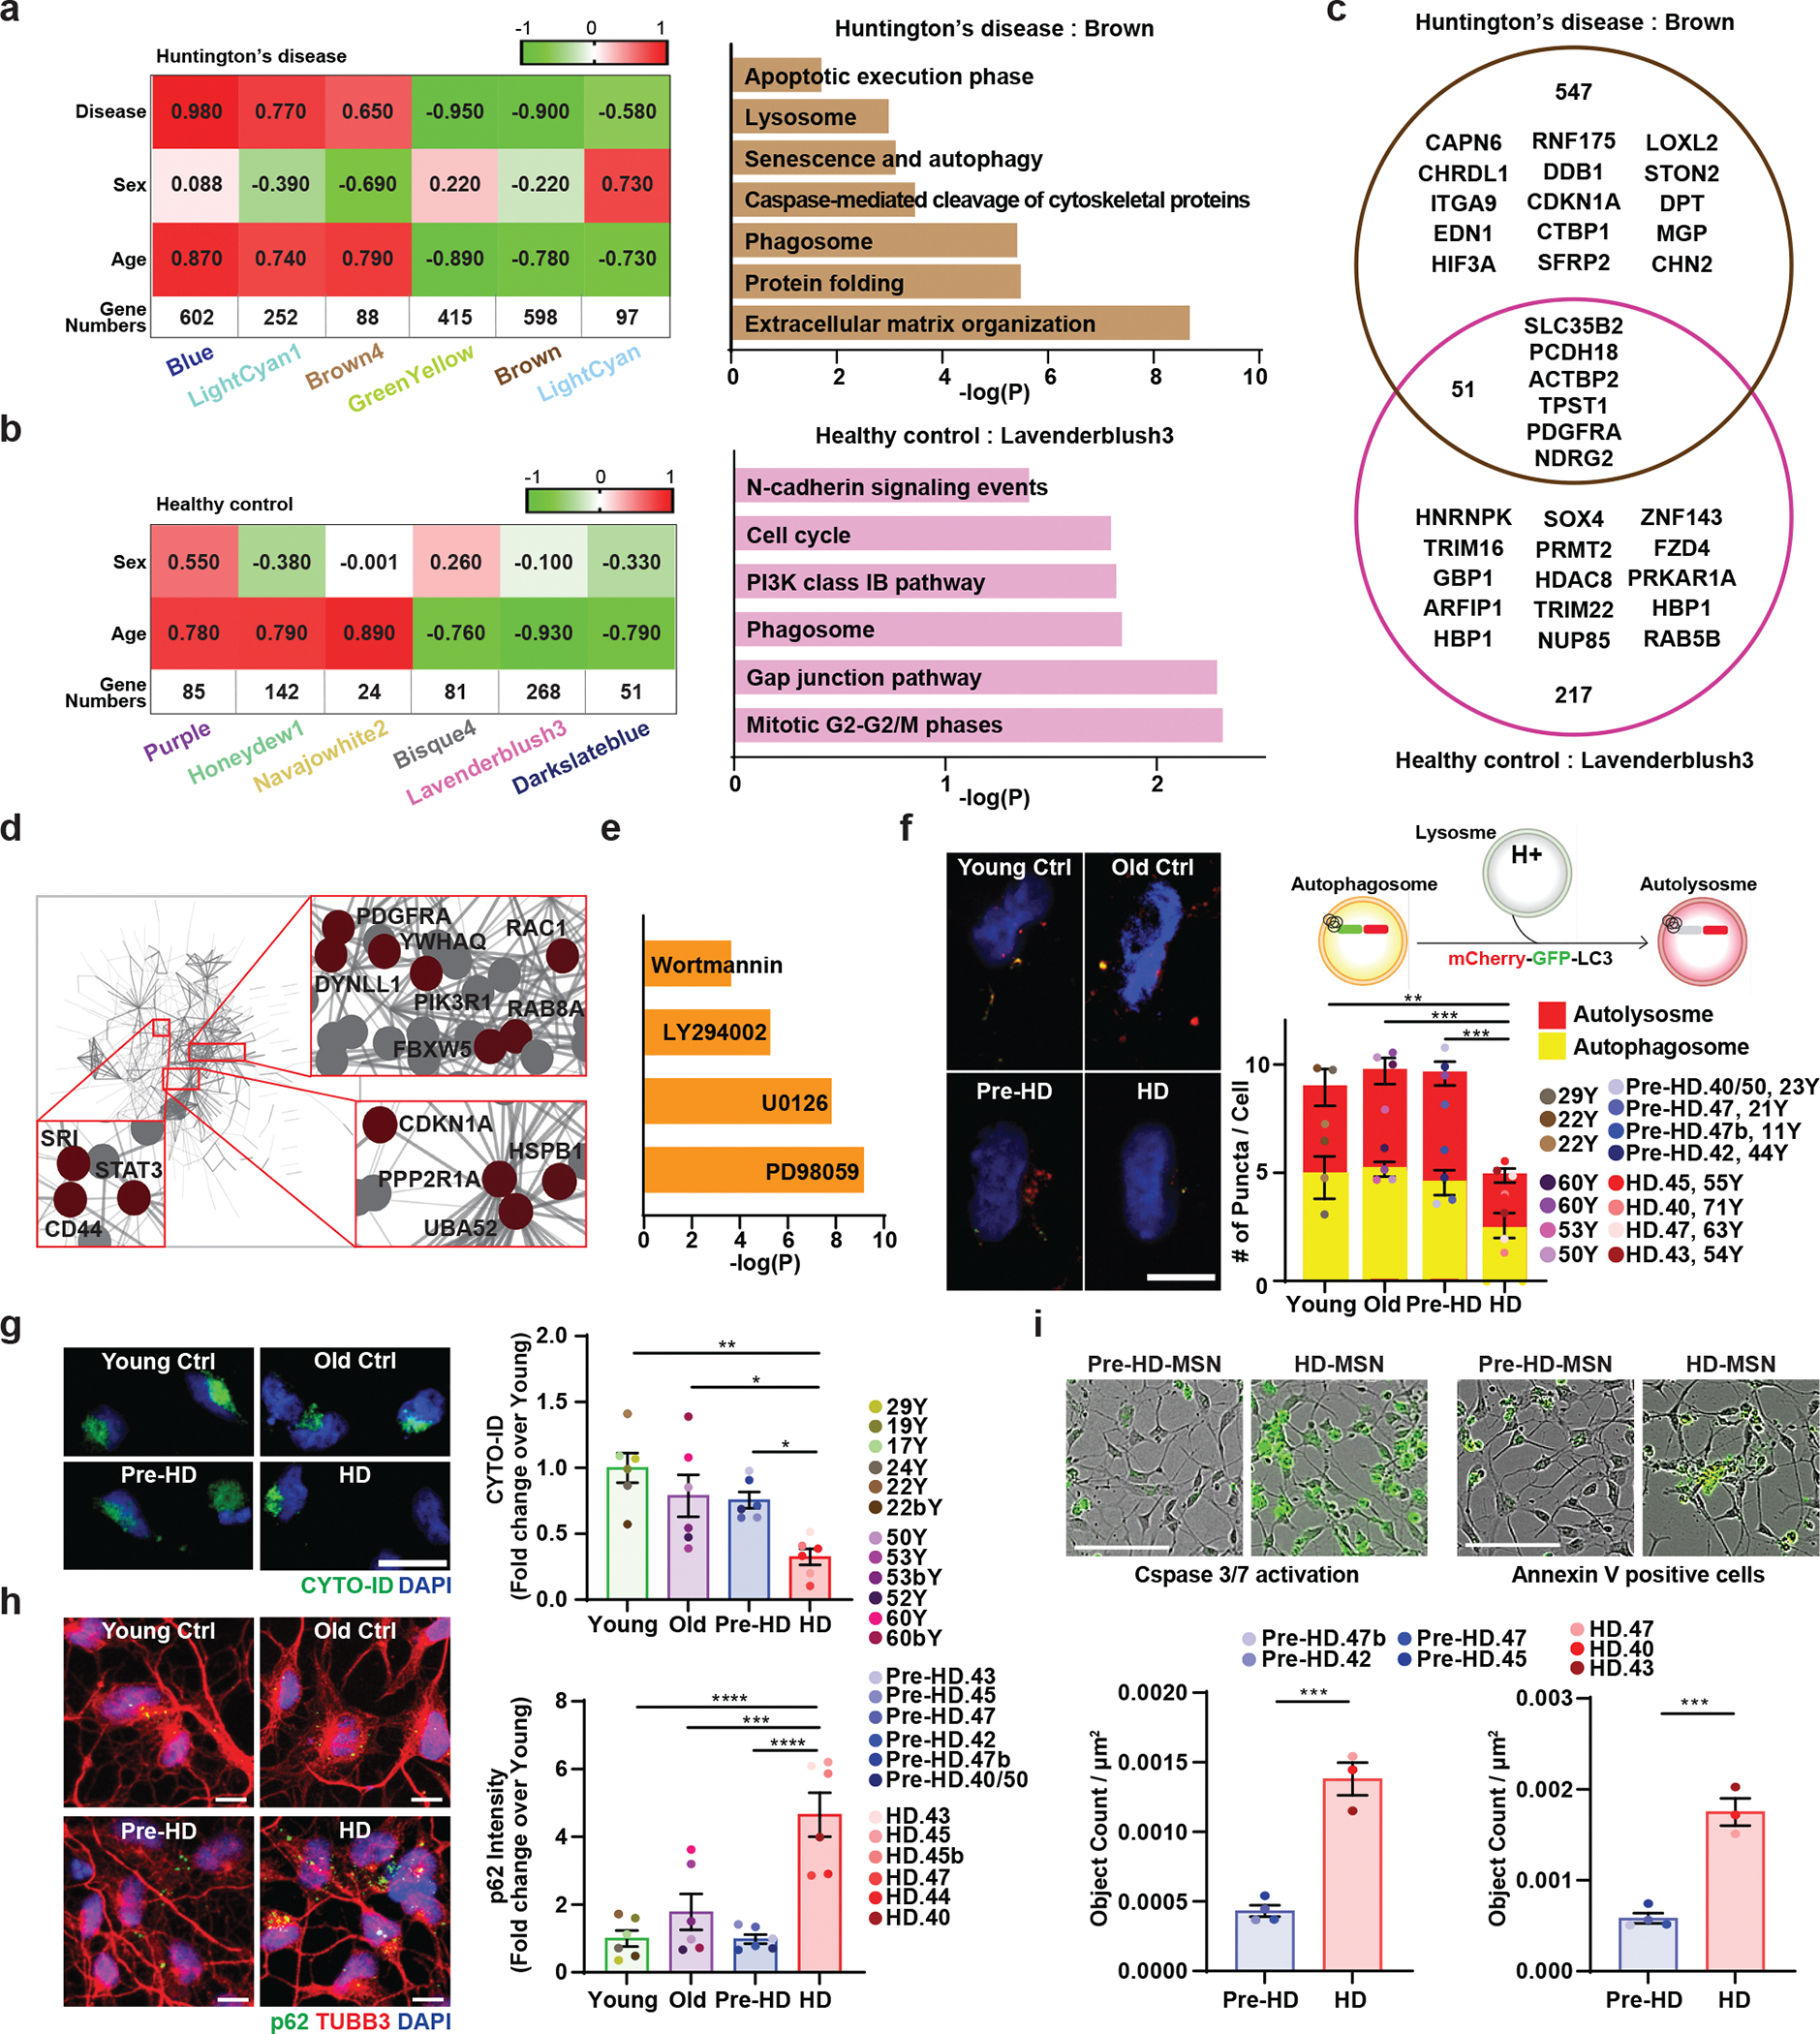
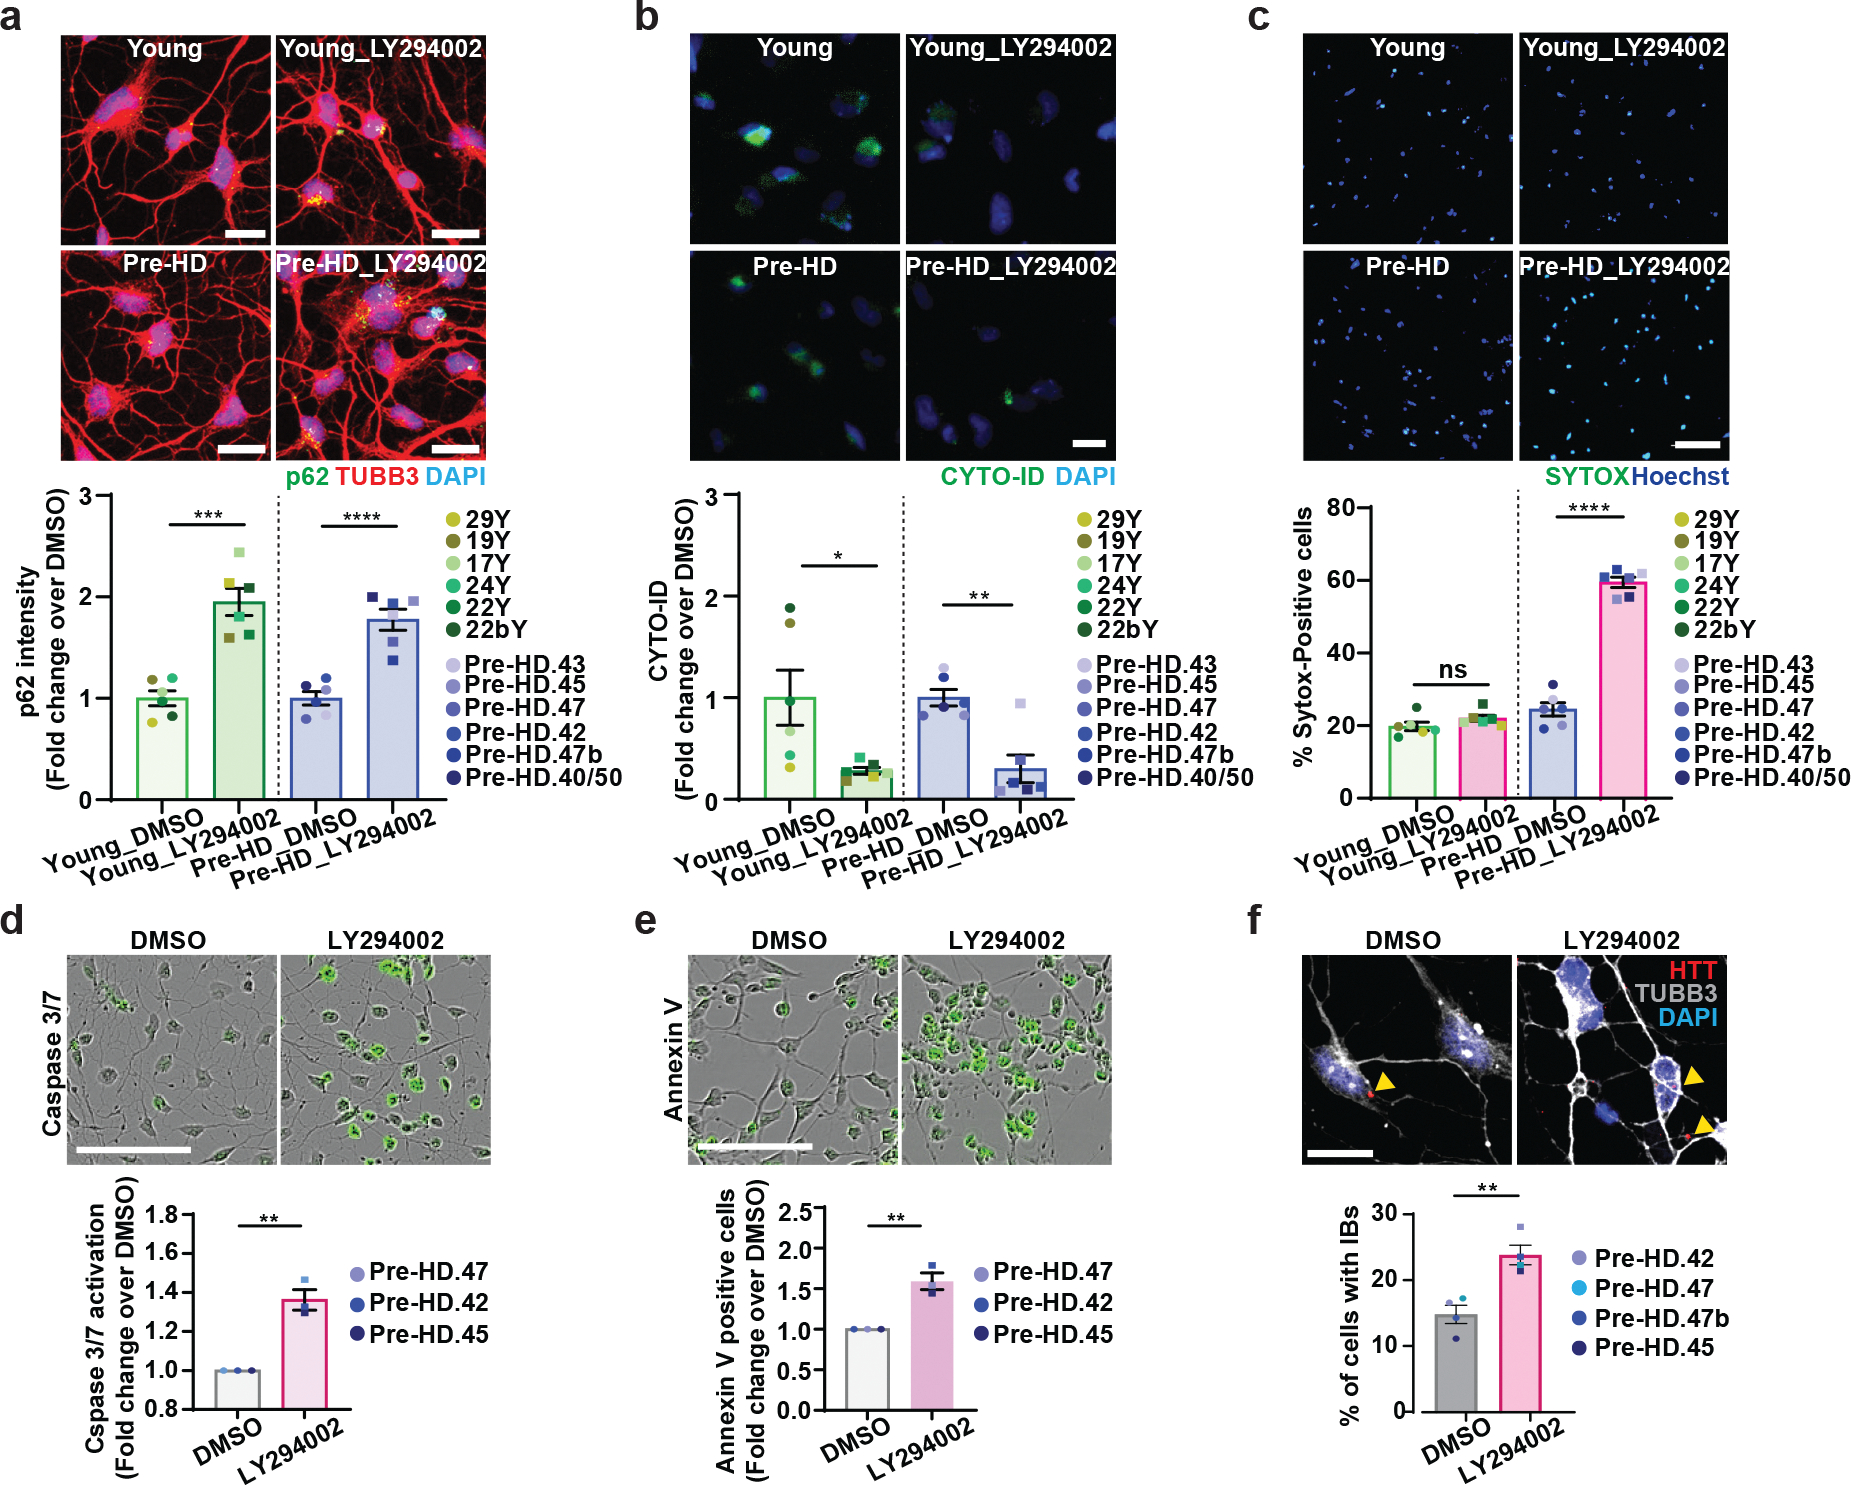
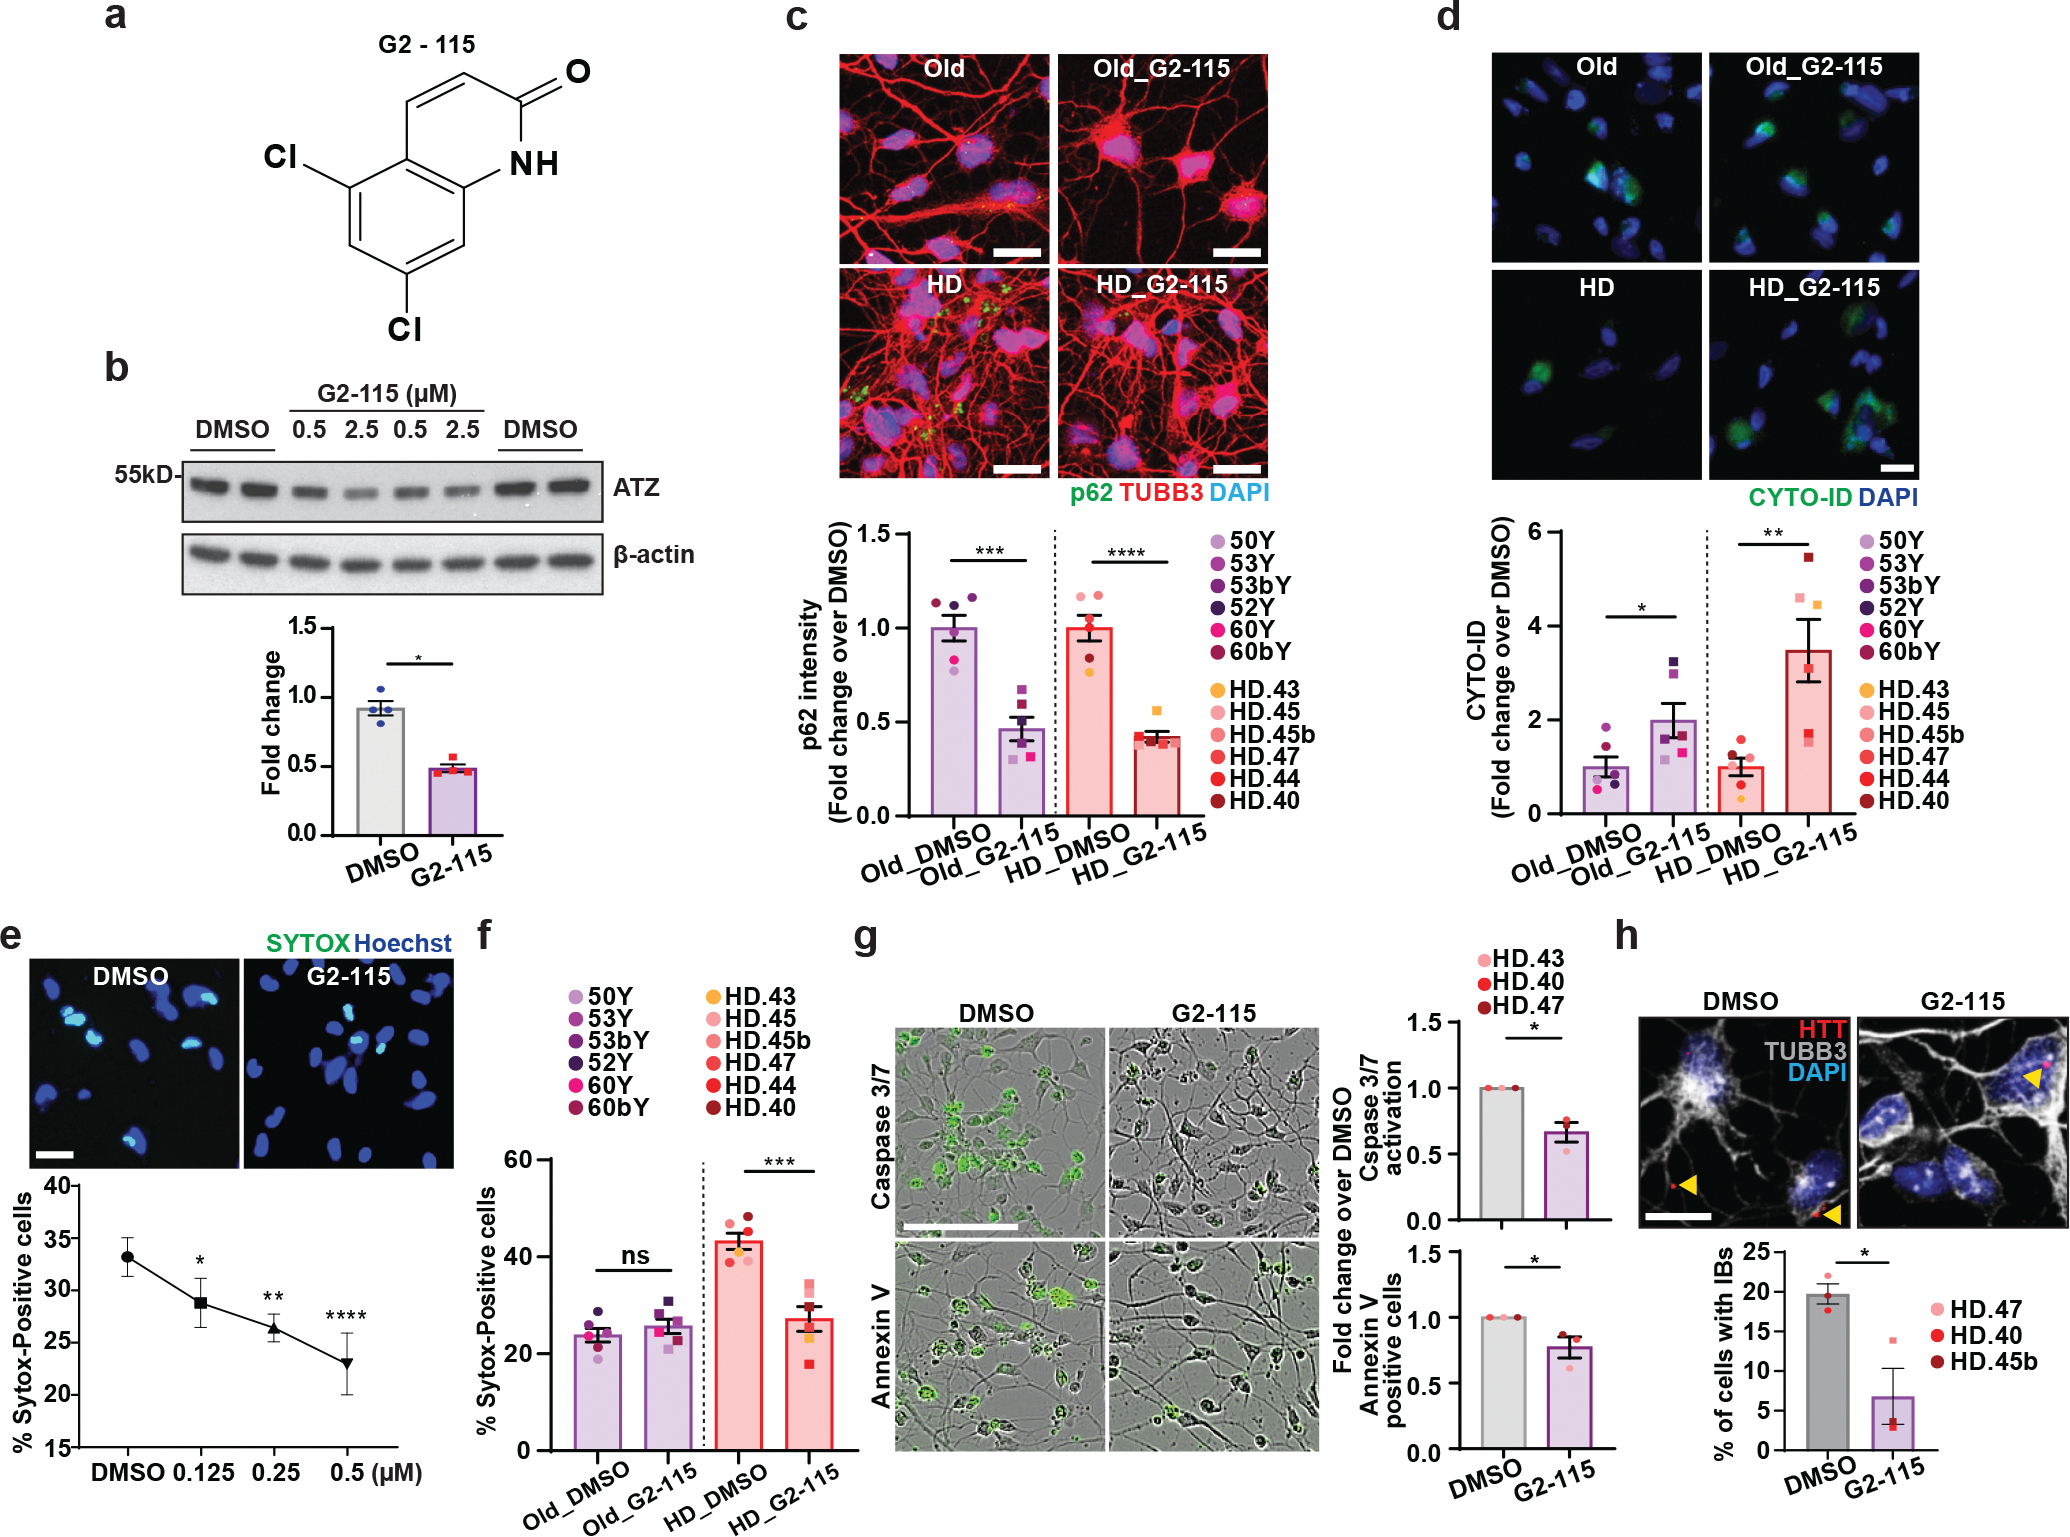
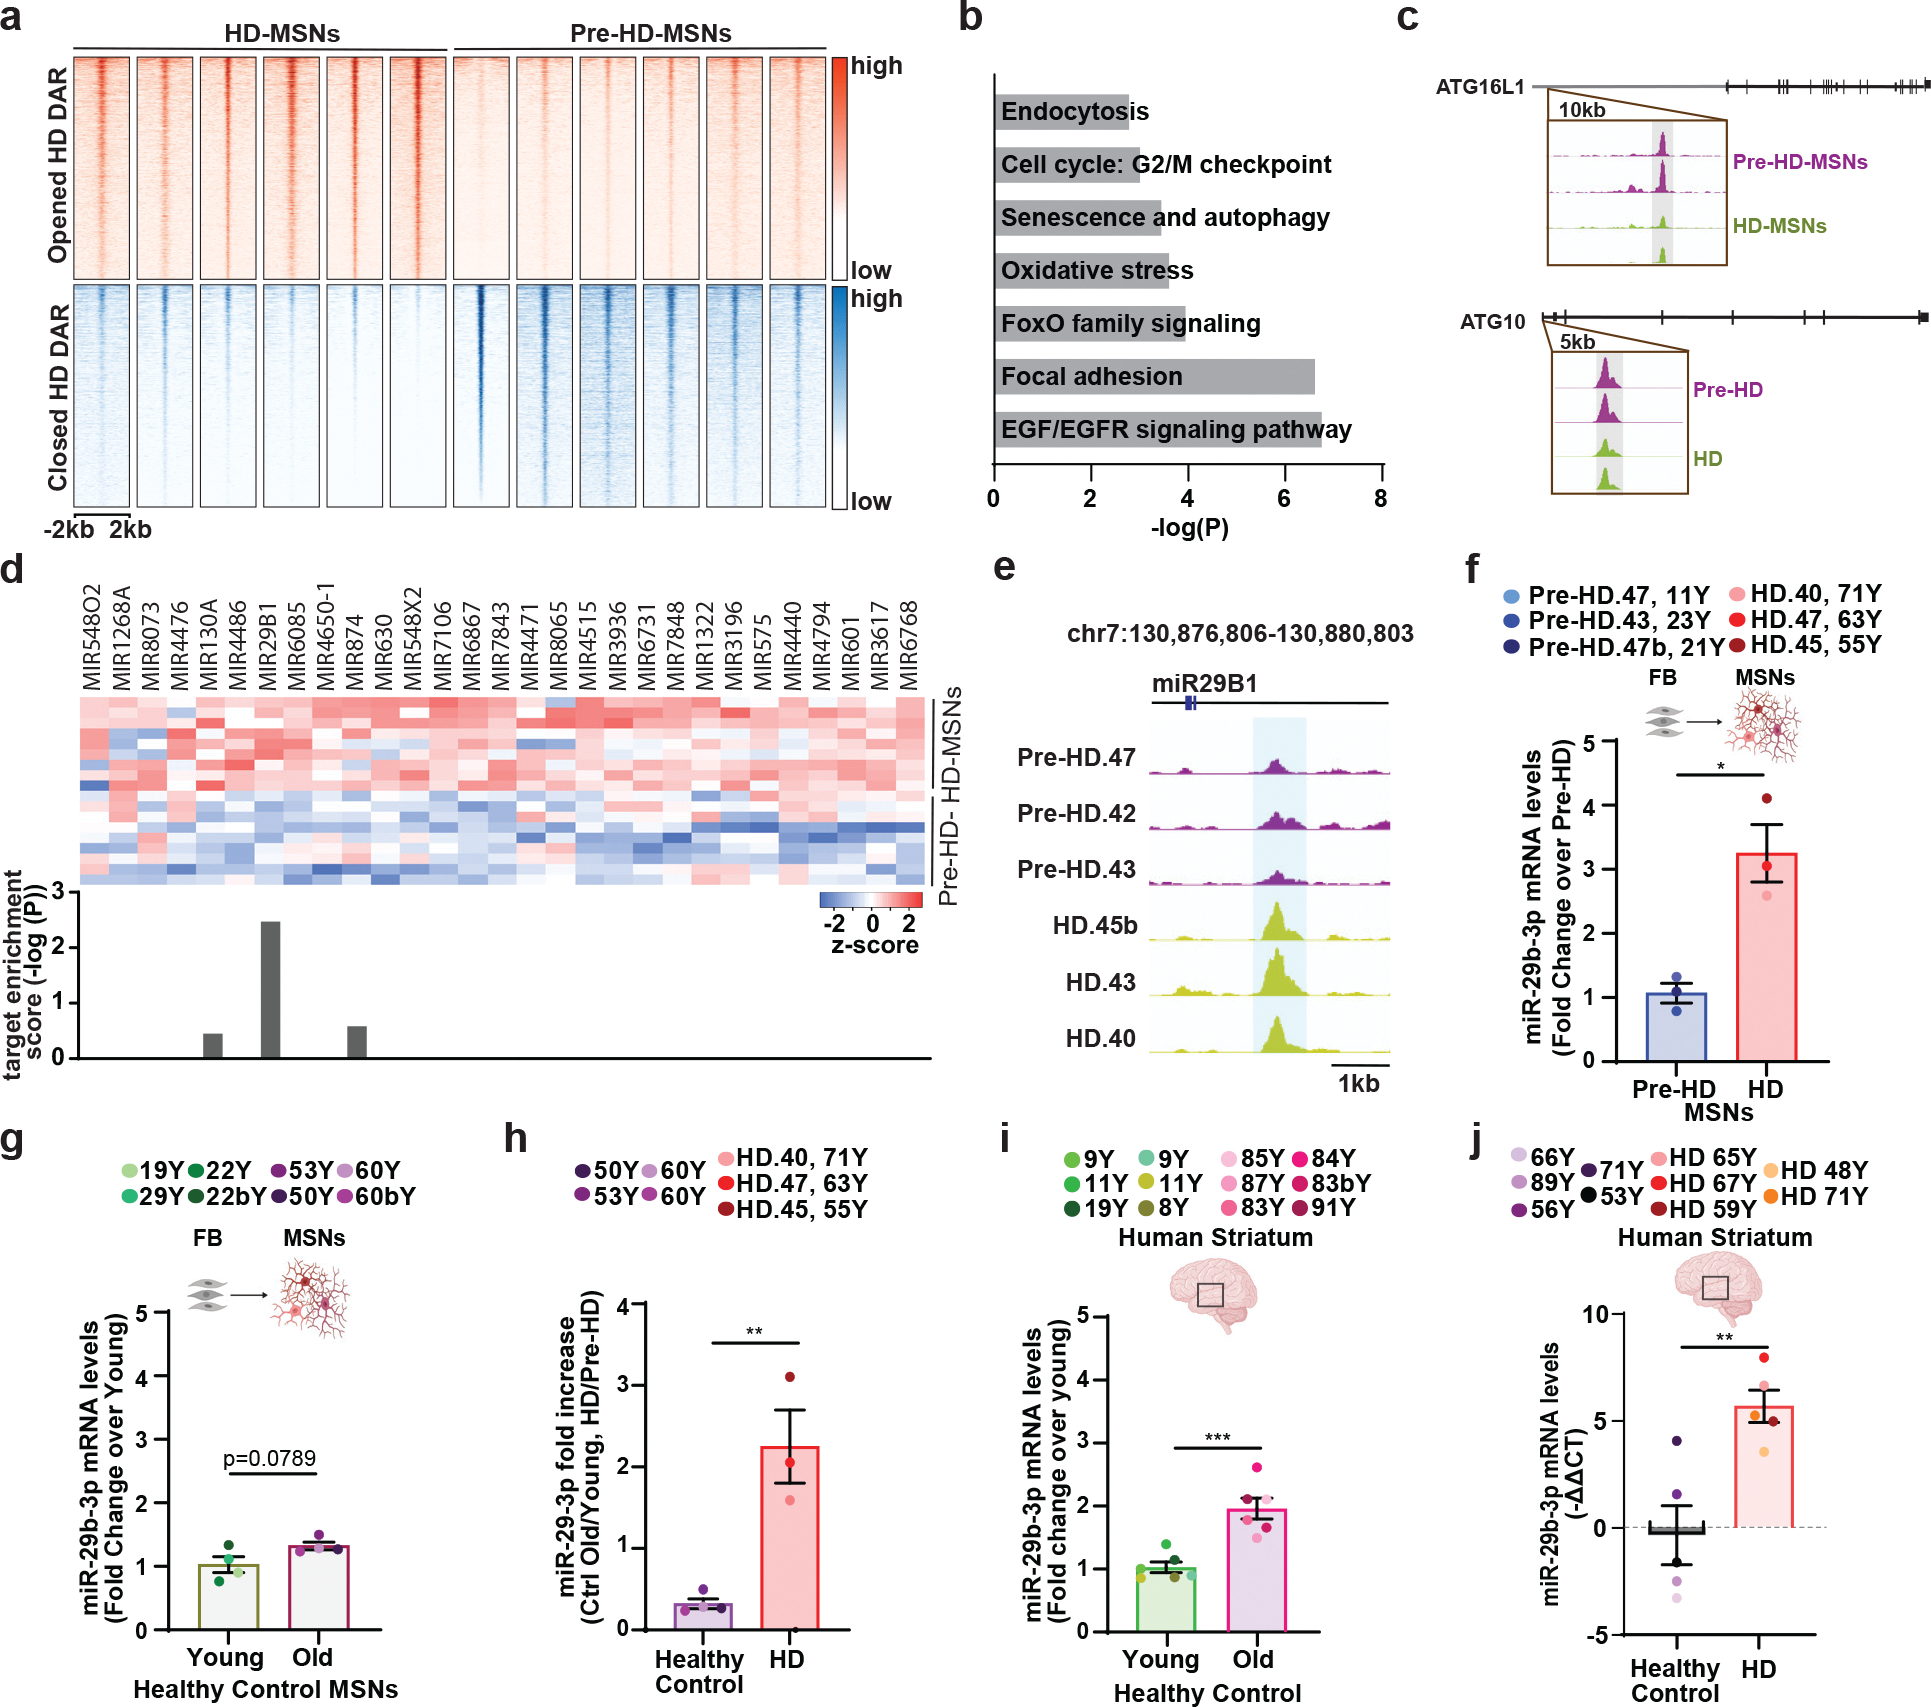
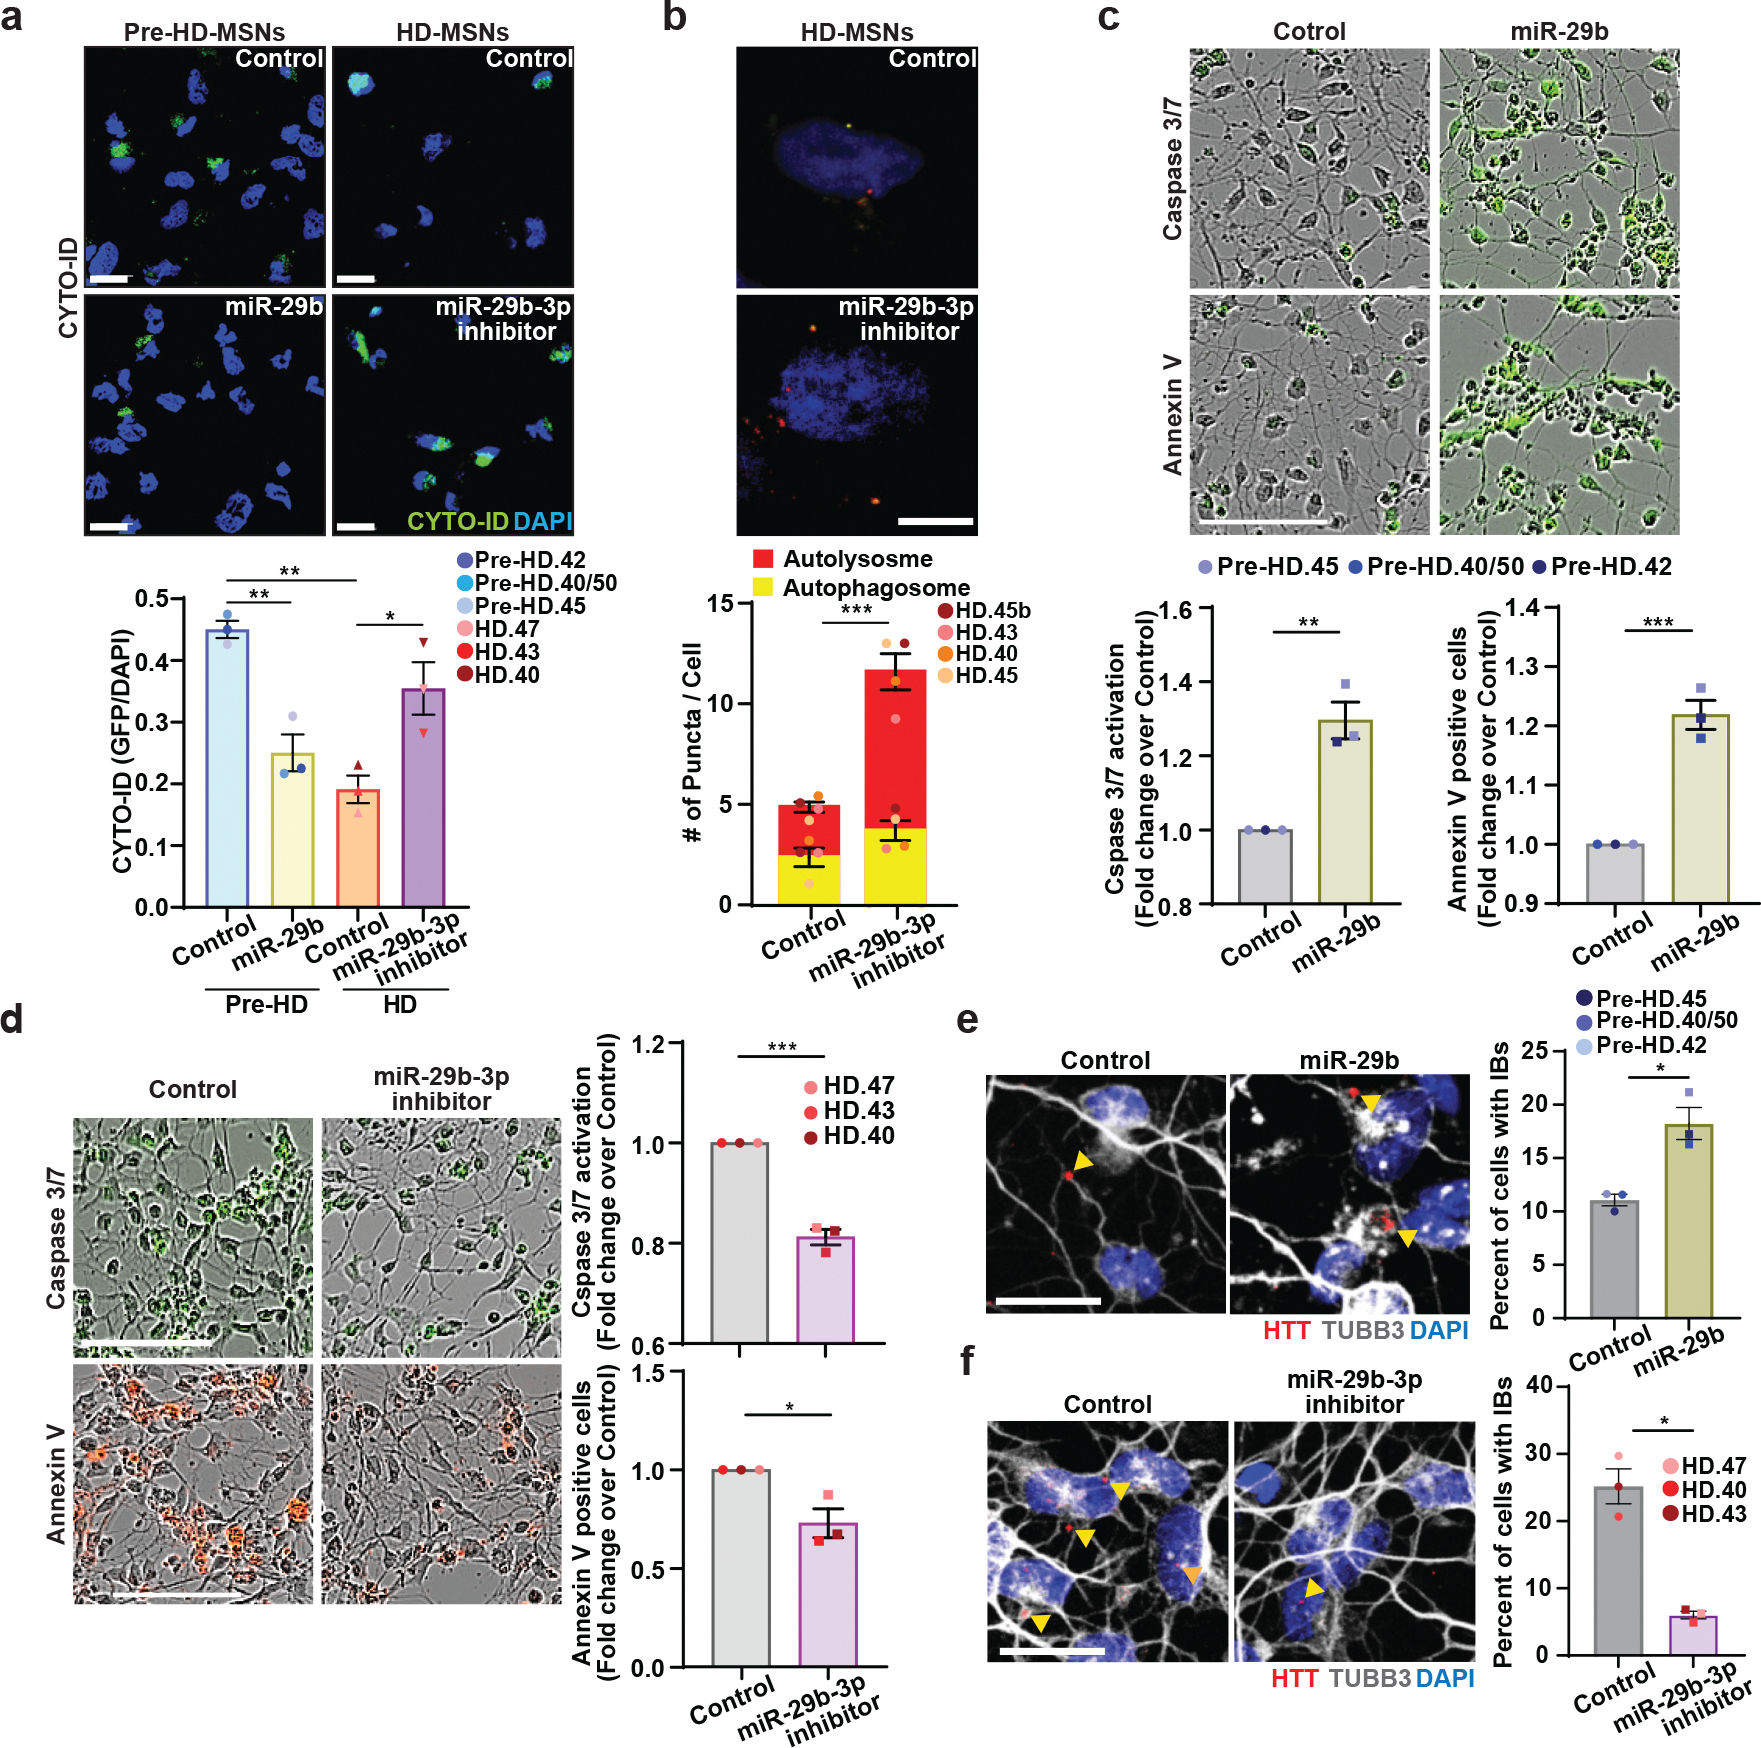
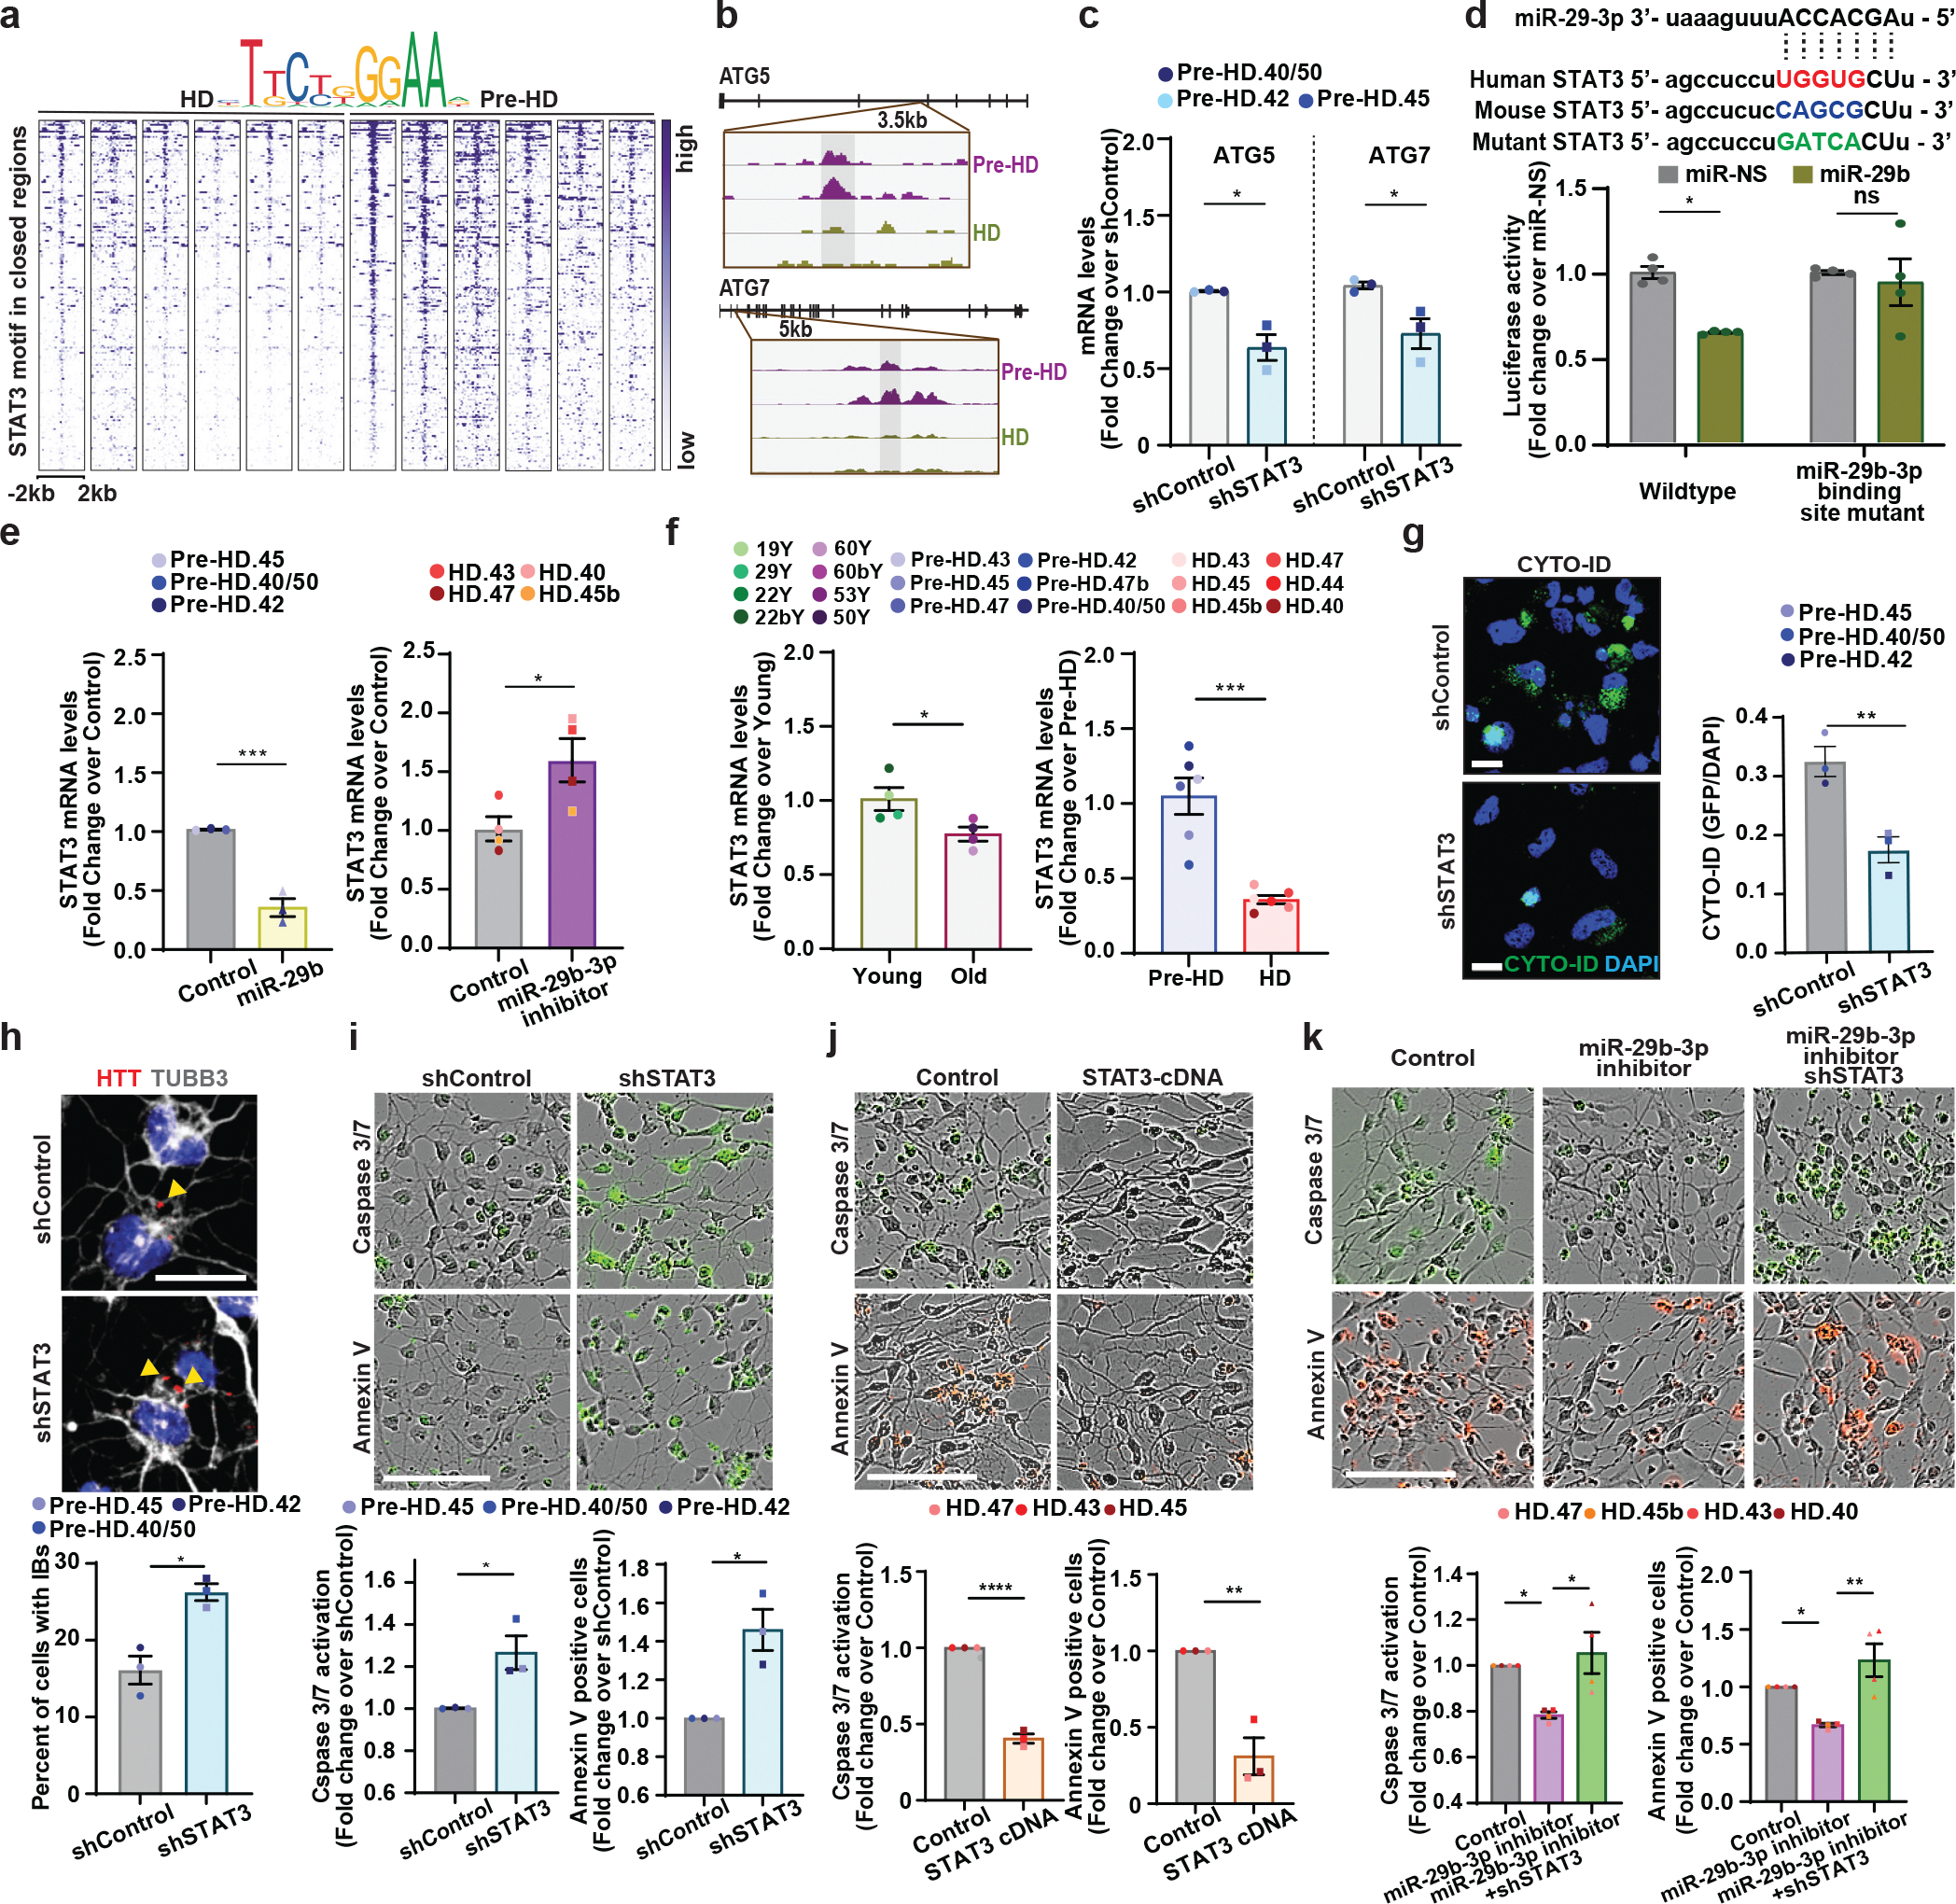
Huntington's disease (HD) is an inherited neurodegenerative disorder with adult-onset clinical symptoms, but the mechanism by which aging drives the onset of neurodegeneration in patients with HD remains unclear. In this study we examined striatal medium spiny neurons (MSNs) directly reprogrammed from fibroblasts of patients with HD to model the age-dependent onset of pathology. We found that pronounced neuronal death occurred selectively in reprogrammed MSNs from symptomatic patients with HD (HD-MSNs) compared to MSNs derived from younger, pre-symptomatic patients (pre-HD-MSNs) and control MSNs from age-matched healthy individuals. We observed age-associated alterations in chromatin accessibility between HD-MSNs and pre-HD-MSNs and identified miR-29b-3p, whose age-associated upregulation promotes HD-MSN degeneration by impairing autophagic function through human-specific targeting of the STAT3 3' untranslated region. Reducing miR-29b-3p or chemically promoting autophagy increased the resilience of HD-MSNs against neurodegeneration. Our results demonstrate miRNA upregulation with aging in HD as a detrimental process driving MSN degeneration and potential approaches for enhancing autophagy and resilience of HD-MSNs.


Conflict of interest statement

COMPETING INTERESTS

The authors declare no competing interests.

Figures

Extended Data Fig. 1.
Extended Data Fig. 1.. Healthy control and HD patient fibroblasts can be directly reprogrammed into MSNs.
a. Reprogrammed cells by transduction of miR-9/9*-124+CDM immunostained for neuronal markers, TUBB3, and MSN marker, DARPP32 at PID30. Scale bars 20 μm. b. Expression of each CDM factor in reprogramming cells by immunostaining for CTIP2, DLX1, DLX2, MYT1L, and TUBB3. Non-transduced fibroblasts were used as a negative control for immunostaining. Scale bars 20μm. c. The neuronal morphology across all samples we used in the current study stained positive for TUBB3 successfully undergo direct conversion by miR-9/9*-124+CDM. Scale bars 20μm. d. Left, representative images of healthy control Young, Old, Pre-HD, and HD MSNs marked by TUBB3. Images processed by CellProfiler to identify neurites and associated cell soma. Scale bars, 100μm. Right, the measurement of mean neurite length and mean number of neurite branches in reprogrammed Healthy control Young, Old, Pre-HD, and HD-MSNs at PID21 and PID35 (n=24 individual’s reprogrammed MSNs). Statistical significance was determined using one-way ANOVA, ****p<0.0001, ***p<0.001 (Old vs. HD in neurite length p=0.0007, Old vs. HD in neurite branches p=0.0001, Pre-HD vs. HD in neurite branches p=0.0002), **p<0.01 (Young vs. HD in neurite length p=0.0012, Pre-HD vs. HD in neurite length p=0.0026), ns, not significant. Mean±s.e.m.
Extended Data Fig. 2.
Extended Data Fig. 2.. Genetic networks altered in HD-MSNs by WGCNA.
a, The signed association of protein-coding genes with Age, Symptomatic onset, and Sex condition of Huntington’s disease. Modules with positive values indicate increased expression in HD-MSNs; modules with negative values indicate decreased expression in HD-MSNs. The red dotted lines indicate correlation values of 0.7 or −0.7 with p=10–7 for age, p=10–6 for symptomatic onset, and p=10–6 for sex. b, An expression heatmap of our selected modules of HD samples (blue, lightcyan1, brown, and greenyellow) from WGCNA. c, Pathways enriched in downregulated (log2FC<−1) or upregulated (log2FC>1) genes in the greenyellow, blue and lightcyan1 module of Huntington’s disease by BioPlanet analysis. d, The signed association of protein-coding genes with age and sex of healthy control. Modules with positive values indicate increased expression in Old-MSNs; modules with negative values indicate decreased expression in Old-MSNs. The red dotted lines indicate correlation values of 0.7 or −0.7 with p=10–7 for age and p=10–6 for sex condition. e, Pathways enriched in upregulated (log2FC>1) genes in the honeydew1 module of healthy control by BioPlanet analysis. f, Summary preservation statistics as a function of the module size. Left: the composite preservation statistic (Zsummary), Middle: the connectivity statistics (Zconnectivity), Right: the density statistics (Zdensity). Each point represents a module, labeled by color. The dashed blue and green lines indicate the thresholds Z=2 and Z=10, respectively. g. Representative images of MSNs expressing the tandem monomeric mCherry-GFP-LC3 reporter immunostained for TUBB3. Autophagosome (i.e., mCherry+, GFP+ puncta) and autolysosome (i.e., mCherry+, GFP−puncta) compartments in MSNs from HD patients and control individual. Scale bar 20μm. h. Reprogrammed cells immunostained for p62 and TUBB3 from independent HD and healthy control lines. Scale bar 20μm. i. Immunoblot analysis for p62 and GAPDH of three independent pre-HD- and three independent HD-MSN lines at PID26. P62 signal intensities were normalized by GAPDH signals and relative fold changes in HD-MSNs were calculated over pre-HD-MSNs (**p=0.0019 by two-tailed unpaired t-test; Mean±s.e.m.).
Extended Data Fig. 3.
Extended Data Fig. 3.. The treatment of autophagy inhibitor or inducer in reprogrammed MSNs.
a, Immunoblot of p62 and GAPDH in pre-HD-MSNs treated with DMSO or 50 μM LY294002 and HD-MSNs treated with DMSO or 0.5uM G2-115 at PID26 (left). p62 Intensity values were normalized by GAPDH intensities and the relative fold change over DMSO condition was calculated from immunoblot images of three independent Pre-HD-MSNs (middle, *p=0.0277) and HD-MSNs (*p=0.0460). Each dot represents one individual’s reprogrammed MSN. b, left: representative images of pre-HD-MSNs treated with DMSO or 50μM LY294002 and HD-MSNs treated with DMSO or 0.5uM G2-115 (PID 30). MSNs express the tandem monomeric RFP-GFP-LC3 reporter. Scale bars 20μm. right: quantification of autophagosome (i.e., mCherry+, GFP+puncta) and autolysosome (i.e., mCherry+, GFP− puncta) compartments from three independent Pre-HD-MSNs (***p=0.0004) and HD-MSNs (***p=0.0005). Measurements were performed in cells having at least 3 puncta per cell (from more than 50 cells per MSN line). Each dot represents one individual’s reprogrammed MSNs. c. Synthetic route for the preparation of G2-115. d, Measurement of neuronal cell death of HD.40-MSNs with the treatment of DMSO or three different concentrations of G2 compound at PID 30 by Caspase-3/7 reagents (left, *p=0.0199, ****p<0.0001) or Annexin V reagents (right, *p=0359, *p=0.0326) (n=4–8 cultures). For all figures shown, statistical significance was determined using two-tailed unpaired t-test (a,b) and one-way ANOVA (d); ****p < 0.0001, ***p<0.001, *p<0.05. Mean±s.e.m.
Extended Data Fig. 4.
Extended Data Fig. 4.. Pre-HD-MSNs and HD-MSNs display differential chromatin accessibilities.
a, A heatmaps showing gene expression levels for DEGs that positively correlated with signal intensities of ATAC-seq in their promoter regions. Signal intensity is based on normalized CPM values. Data are shown as Z-score normalized log2CPM (adjusted p<0.05, │log2FC│>1). b, c, GO terms associated with opened and upregulated genes (b) and closed and downregulated genes (c). d, Transcription regulators predicted as upstream regulators of the brown module (Huntington’s disease) and the lavenderblush3 (healthy control) by Ingenuity Pathway Analysis (IPA). e, Mature microRNAs predicted as an upstream regulator of the brown module (Huntington’s disease) and the lavenderblush3 (healthy control) by Ingenuity Pathway Analysis (IPA). f, MicroRNAs predicted as an upstream regulator of the brown module (Huntington’s disease) by miRTarBase and TargetScan. g, Pathways enriched in target genes of miR-29b-3p in the brown module (Huntington’s disease) by BioPlanet analysis.
Extended Data Fig. 5.
Extended Data Fig. 5.. miR-29b-3p expression changes by miR-29–3p inhibitor or miR-29b overexpression lentivirus transduction.
a, RT-qPCR analysis of mature miR-29–3p expression levels in four HD-MSNs with control or miR-29b-3p inhibitor at PID26 (n=4 individual’s reprogrammed HD-MSNs, ***p=0.0002 by two-tailed unpaired t-test; Mean±s.e.m.). b, Pre-HD-MSNs expressing RFP only or RFP-miR-29b immunostained with RFP and DAPI. (Scale bars, 20μm). c, RT-qPCR analysis of mature miR-29–3p expression levels in three independent pre-HD-MSNs expressing control or miR-29b. Each dot represents one individual’s reprogrammed MSNs. (**p=0.0019 by two-tailed unpaired t-test; Mean±s.e.m).
Extended Data Fig. 6.
Extended Data Fig. 6.. The autophagy-related genes regulated by STAT3 in HD-MSNs.
a, The target genes of miR-29b-3p functionally related to autophagy in the brown module. Visualized by NetworkAnalyst. b, A heatmap of representation of ATAC-seq signal intensities for autophagy-related genes that contained STAT3 binding site in the closed DARs in HD-MSNs (n=8–9 per group). c, Percentage of decrease of STAT3 levels in old versus young Ctrl-MSNs, and HD-MSNs versus pre-HD-MSNs, replotted from Figure 7(f). Each dot represents one individual’s reprogrammed MSNs. (****p<0.0001 by two-tailed unpaired t-test; Mean±s.e.m.). d, RT-qPCR analysis of STAT3 mRNA levels in three independent pre-HD-MSN lines with shControl or shSTAT3 at PID26. Each dot represents one individual’s reprogrammed Pre-HD-MSNs. (****p<0.0001 by two-tailed unpaired t-test; Mean±s.e.m.). e, Western bot for STAT3 expression in human adult fibroblasts with shControl or shSTAT3. f, RT-qPCR analysis of STAT3 mRNA levels in three independent HD-MSN lines with Control or STAT3 overexpression at PID26. Each dot represents one individual’s reprogrammed HD-MSNs. (*p=0.0143 by two-tailed unpaired t-test; Mean±s.e.m.).
Extended Data Fig. 7.
Extended Data Fig. 7.. Prediction of DAR proximal to miR-29b and HD-specific phenotype in fibroblasts
a, Predicted transcription binding sites for the DAR proximal to miR29B1 (chr7:130,878,800–130,879,437). Image from UCSC Genome Browser on Human (GRCh38/hg38). JASPAR CORE 2022, Minimum Score: 500. b, Quantification of Sytox-positive cells, CYTO-ID signal, STAT3 expression, and miR-29b-3p expression in fibroblasts from healthy control Young/Old, Pre-HD, and HD (n= 14 or 19 individual fibroblasts, statistical significance was determined by one-way ANOVA. ns, not significant; Mean±s.e.m.).
Fig. 1.
Fig. 1.. Differential manifestation of neurodegeneration between MSNs derived from healthy control individuals and HD patients.
a, Experimental scheme for MSN derivation from fibroblasts of pre-symptomatic (Pre-HD-MSNs), symptomatic HD patients (HD-MSNs), and their respective healthy control individuals of similar ages (Young/Old-MSNs). b, Representative images of TUBB3-, DARPP32-, and MAP2-positive cells from Young/Old healthy control MSNs, Pre-HD-MSNs, and HD-MSNs. c, Quantification of TUBB3-, MAP2- and DARPP-32-positive cells in (b); averages of 300–600 cells per group from independent HD and healthy control lines (n=13 or 20 individual’s reprogrammed MSNs). d, The average long gene expression (LGE), a transcriptomic feature of neuronal identity, in fibroblasts, young/old-MSNs, Pre-HD-, and HD-MSNs. X-axis corresponds to gene lengths (kb) defined by the start and stop genomic coordinates and Y-axis corresponds to gene expression (CPM). The dotted line depicts 100kb in gene length. e, Representative images (left) and quantification (right) of SYTOX-positive cells as a fraction of Hoechst-positive cells (n=14 individual’s reprogrammed MSNs, Young vs. HD p<0.0001, Old vs. HD p=0.0004, Pre-HD vs. HD p=0.0003). For all figures shown, statistical significance was determined by one-way ANOVA (c,e). ****p<0.0001, ***p<0.001, ns, not significant. Scale bars in b 20μm, in e 100μm. Mean±s.e.m.
Fig. 2.
Fig. 2.. Identification of gene module associated with autophagy dysfunction in HD-MSNs by weighted gene coexpression network analysis (WGCNA).
a. A heatmap of six gene modules associated with age and disease stage of HD (left). Pathways enriched in downregulated genes (log2FC<−1) in the brown module by BioPlanet analysis (right). b. A heatmap of six modules associated with age in Ctrl-MSNs from young and old healthy individuals (left). Pathways enriched in downregulated genes (log2FC<−1) in the lavenderblush3 module by BioPlanet analysis (right). c. Venn diagram of the number of gene members from the brown module either overlapping or distinct from gene members in the lavenderblush3 module from control groups. The diagram also contains several representative genes. d. Protein-Protein interaction network of the brown module. e. Chemical compounds are predicted as upstream regulators of the brown module by Ingenuity Pathway Analysis (IPA). f. Left: representative images of MSNs expressing the tandem monomeric mCherry-GFP-LC3 reporter. Right: quantification of autophagosome (i.e., mCherry+, GFP+ puncta) and autolysosome (i.e., mCherry+, GFP− puncta) compartments in MSNs from multiple HD patients and control individuals. Measurements were performed in cells having at least 3 puncta per cell (from more than 50 cells per MSN line, n=15 individual’s reprogrammed MSNs, Young vs. HD p=0.0026, Old vs. HD p=0.0004, Pre-HD vs. HD p=0.0004). g. Representative images (left) and quantification of CYTO-ID green signals in MSNs from multiple HD patients and control individuals (right) at PID 26 (n=24 individual’s reprogrammed MSNs, Young vs. HD p=0.0023, Old vs. HD p=0.0491, Pre-HD vs. HD p=0.0465). h. Reprogrammed cells immunostained for p62 and TUBB3 (right) and quantification of p62 intensity per cell in MSNs from independent HD and healthy control lines (n=24 individual’s reprogrammed MSNs, Young vs. HD p<0.0001, Old vs. HD p=0.0009, Pre-HD vs. HD p<0.0001). i. Representative images (top) and quantification (bottom) of neuronal apoptosis in pre-HD-MSNs and HD-MSNs (four pre-HD-MSN lines and three HD-MSN lines). The green signal represents Caspase 3/7 activation (PID 26) and Annexin V signal (PID 30), (n=7 individual’s reprogrammed MSNs, left p=0.0003, right p=0.0004). For all figures shown, statistical significance was determined by one-way ANOVA (f,g,h) and two-tailed unpaired t-test (i). ****p<0.0001, ***p<0.001, **p<0.01, *p<0.05. Scale bars in f,h 10μm, g 20μm; i 100μm. Mean±s.e.m.
Fig. 3.
Fig. 3.. Autophagy inhibitor induces neurodegeneration of pre-HD-MSNs.
a-c, Representative images of p62 and TUBB3-positive cells (top) and quantification of p62 intensity per cell (bottom) at PID26 (a, n=12 individual’s reprogrammed MSNs, ***p=0.0001, ****p<0.0001), representative images of CYTO-ID green signals (top) and quantification of CYTO-ID signals per cell (bottom) at PID26 (b, n=12 individual’s reprogrammed MSNs, *p=0.0253, **p=0.0013), and representative images of SYTOX staining (top) and quantification of SYTOX-positive cells as a fraction of Hoechst-positive cells (bottom) at PID30 (c, n=12 individual’s reprogrammed MSNs, ****p<0.0001) from multiple healthy control young and pre-HD-MSNs treated with DMSO or 50 μM LY294002. d,e, Representative images (top) and quantification (bottom) of caspase activation (green) at PID 26 (d, n=3 individual’s reprogrammed MSNs, **p=0.0023) and Annexin V signal (green) at PID 30 (e, n=3 individual’s reprogrammed MSNs, **p=0.0045) from three pre-HD-MSN lines treated with DMSO or 50μM LY294002. f, Representative images (top) and quantification (bottom) of HTT inclusion bodies (IBs) present in pre-HD-MSNs treated with DMSO or 50μM LY294002 (four pre-HD-MSNs lines; DMSO: 3947 cells, 50μM LY294002: 4314 cells, PID30), (n=4 individual’s reprogrammed MSNs, **p=0.0075). For all figures shown (a-f), statistical significance was determined using two-tailed unpaired t-test; ****p<0.0001, ***p<0.001, **p<0.01, *p<0.05. Scale bars in a,b,f 20μm; in c,d,e 100μm. Mean±s.e.m.
Fig. 4.
Fig. 4.. Autophagy activator rescues HD-MSNs from degeneration.
a, Chemical structure of G2-115. b, Representatives immunoblot (top) of steady-state levels of α1-antitrypsin Z variant (ATZ) and β-actin in the HTO/Z cell line model of α1-antitrypsin deficiency after 24 hr treatment with DMSO alone or G2-115 in DMSO at 0.5 and 2.5μM. The normalized intensity (bottom) was calculated from immunoblot images for 0.5μM versus DMSO control (Individual data plotted, n=4; *p=0.003 by t-test; Mean±s.e.m.). c,d, Representative images of p62 and TUBB3-positive cells (top) and quantification of p62 intensity per cell (bottom) at PID26 (c, n=12 individual’s reprogrammed MSNs, ***p=0.0002, ****p<0.0001) and representative images of CYTO-ID staining (top) and quantification of CYTO-ID green signals (bottom) at PID26 (d, n=12 individual’s reprogrammed MSNs, *p=0.0415, **p=0.0049) from multiple healthy control old and HD-MSNs treated with DMSO or 0.5 μM G2-115. e, Representative images (top) and quantification (bottom) of SYTOX-positive cells as a fraction of Hoechst-positive cells in HD-MSN treated with DMSO or different concentration of G2-115 (0.125, 0.25, or 0.5μM) (n=4, *p=0.0390, **p=0.0025, ****p<0.0001). f. Quantification of SYTOX-positive cells from multiple healthy control old and HD-MSNs treated with DMSO or 0.5μM G2-115 (n=12 individual’s reprogrammed MSNs, ***p=0.0004). g, Representative images (left) and quantification (right) of caspase3/7 activation (green) and Annexin V signal (green) from three independent HD-MSN lines treated with DMSO or 0.5μM G2-115 (n=3 individual’s reprogrammed MSNs, top *p=0.0105, down *p=0.0473). h, Representative images (top) and quantification (bottom) of HTT inclusion bodies from three independent HD-MSNs treated with DMSO or 0.5μM G2-115 (DMSO: 285 cells, 0.5μM G2-115: 325 cells) at PID30 (n=3 individual’s reprogrammed MSNs, *p=0.0326). For all figures shown (b-h), statistical significance was determined using two-tailed unpaired t-test; ****p<0.0001, ***p<0.001, **p<0.01, *p<0.05, ns, not significant. Scale bars in c,d,e,h 20μm; in g 100μm. Mean±s.e.m.
Fig. 5.
Fig. 5.. Comparative analysis of chromatin accessibility between pre-HD- and HD-MSNs.
a, Heatmaps showing signal intensities of ATAC-seq peaks for DARs detected between pre-HD-MSNs and HD-MSNs at PID21 (adj. p<0.05, │log2FC│>1). b, Pathway enrichment for genes associated with DARs at promoter regions in pre-HD-MSNs and HD-MSNs at PID21 (adj. p<0.05) by BioPlanet analysis. c, Integrative Genomics Viewer (IGV) snapshots showing DAR peaks (blue highlight) are more accessible in pre-HD-MSNs (purple) compared to HD-MSNs (green). ATG16L1 and ATG10 are shown as these genes are involved in senescence and autophagy. d, Heatmap representation of ATAC-seq signal intensities for promoter regions of miRNA precursors opened in HD-MSNs. Target enrichment score (log(p-value)) of miRNA precursors for the brown module. e, Integrative Genomics Viewer (IGV) snapshots showing peaks enriched in HD-MSNs (green) over pre-HD-MSNs (purple) within miR29B1 (DAR highlighted in blue). f, RT-qPCR analysis of mature miR-29b-3p expression in three independent pre-HD- and HD-MSNs at PID 26 (*p=0.0100). g, RT-qPCR analysis of mature miR-29b-3p expression in four independent healthy control young and old Ctrl-MSNs at PID 26. h, Fold changes of increase of miR-29–3p levels in old versus young Ctrl-MSNs, and HD-MSNs versus pre-HD-MSNs, replotted from f and g (n=7 individual’s reprogrammed MSNs, **p=0.0039). i, RT-qPCR analysis of mature miR-29b-3p expression in human young striatum aged 8, 9, 11, and 19 years and human old striatum aged 83, 84, 85, 87, and 91 years (n=12 individual’s striatum, ***p=0.0005). j, RT-qPCR analysis of mature miR-29b-3p expression in human healthy control striatum (53, 71, 56, 89, and 66 years of age) and human Huntington’s disease patient’s striatum (59, 67, 48, 71 and 65 years of age), (n=10 individual’s striatum, **p=0.0050). For f-j figures shown, statistical significance was determined using two-tailed unpaired t-test; ***p<0.001, **p<0.01, *p<0.05. Mean±s.e.m.
Fig. 6.
Fig. 6.. Inhibition of miR-29b-3p enhances autophagy and rescues HD-MSNs from degeneration.
a, Representative images (top) and quantification (bottom) of CYTO-ID green signals from pre-HD-MSNs expressing control or miR-29b (control: 353 cells, miR-29b: 392 cells) and HD-MSNs with control or miR-29b-3p inhibitor (control: 380 cells, miR-29b-3p inhibitor: 421 cells) at PID26 (n=6 individual’s reprogrammed MSNs, Pre-HD Control vs. miR-29b **p=0.0054, HD Control vs. miR-29b-3p inhibitor *p=0.0172, Pre-HD Control vs. HD Control **p=0.0010). b, Representative images (top) of HD-MSNs expressing the tandem monomeric mCherry-GFP-LC3 reporter with control or miR-29b-3p inhibitor. Quantification (bottom) of autophagosome (i.e., mCherry+, GFP+ puncta) and autolysosome (i.e., mCherry+, GFP− puncta) compartments from four independent HD-MSNs. Measurements were performed in cells having at least 3 puncta per cell (from more than 50 cells per MSN line, ***p=0.0004). c,d, Representative images (top) and quantification (bottom) of caspase3/7 activation at PID 26 and Annexin V signal at PID 30 from three independent pre-HD-MSN lines expressing control or miR-29b (c, **p=0.0040, ***p=0.0009). Representative images (left) and quantification (right) of caspase3/7 activation at PID 26 and Annexin V signal at PID 30 from three independent HD-MSN lines with control or miR-29b-3p inhibitor (d, ***p=0.0003, *p=0.0209). e,f, Representative images (left) and quantification (right) of HTT inclusion bodies from three independent pre-HD-MSNs expressing control or miR-29b (e, *p=0.0355) (control: 437 cells, miR-29b: 389 cells) and three independent HD-MSNs with control or miR-29b-3p inhibitor (f, *p=0.0136) (control: 406 cells, miR-29b-3p inhibitor: 630 cells) at PID30. For all figures shown, statistical significance was determined using one-way ANOVA (a) and two-tailed unpaired t-test (b-f); ***p<0.001, **p<0.01, *p<0.05. Scale bars in b 10μm; in a, e, f 20μm; in c, d 100μm. Mean±s.e.m.
Fig. 7.
Fig. 7.. Inhibition of miR-29b-3p-STAT3 axis enhances autophagy and rescues HD-MSNs from degeneration.
a, Heatmaps of STAT3 binding site intensity within chromatin loci closed in HD-MSNs. Legend depicts representative motifs for STAT3 binding sites. b, Integrative Genomics Viewer (IGV) snapshots showing DAR peaks (blue highlight) are more accessible in pre-HD-MSNs (purple) compared to HD-MSNs (green). ATG5 and ATG7 contained the STAT3 binding motif. c, RT-qPCR analysis of ATG5 and ATG7 mRNA levels in three independent pre-HD-MSNs expressing shControl or shSTAT3 at PID26. Each dot represents one individual’s reprogrammed MSN (ATG5 *p=0.011954, ATG7 *p=0.034887). d, Top: the sequence of miR-29–3p seeds in human and mouse STAT3 3’UTR and human STAT3 3’UTR mutant. Bottom: luciferase assays with HEK293Le cells co-transfected miR-NS or miR-29b-3p and wild-type or mutant of STAT3 3′UTRs containing point mutations to the seed-match regions of miR-29b-3p. The sample size (n) corresponds to the number of biological replicates (n=4, *p=0.0197). e, RT-qPCR analysis of STAT3 expression in three independent pre-HD-MSNs expressing control or miR-29b (left) and four independent HD-MSNs expressing negative control or miR-29–3p inhibitor (right) at PID26 (***p=0.0010, *p=0.0330). f, RT-qPCR analysis of STAT3 expression in four independent healthy control young- and old-MSNs, six independent pre-HD- and HD-MSNs at PID21 (*p=0.0395, ***p=0.0003). g, h, Representative images (left, top) and quantification (right, bottom) of Cyto-ID green signals (g, **p=0.0089) and HTT inclusion bodies (IBs) (h, *p=0.0300) from three independent pre-HD-MSNs expressing shControl or shSTAT3 (for Cyto-ID, shControl: 498 cells, shSTAT3: 404 cells. for HTT inclusion bodies, control: 260 cells, miR-29b: 346 cells). i, j, Representative images (top) and quantification (bottom) of caspase3/7 activation (green) at PID 26 and Annexin V signal (green or red) at PID 30 from three independent pre-HD-MSN lines expressing shControl or shSTAT3 (i, left *p=0.0306, right *p=0.0126) and three independent HD-MSN lines expressing control or STAT3 cDNA (j, left ****p<0.0001, right **p=0.0047). k, Representative images (top) and quantification (bottom) of caspase3/7 activation (green, left ****p<0.0001, right **p=0.0047) at PID 26 and Annexin V signal (red, left *p=0.0415, right *p=0.0133) at PID 30 from four independent HD-MSN lines expressing control, miR-29b-3p inhibitor or shSTAT3. Each dot represents one individual’s reprogrammed MSN in e,f,g,h,i,j,k. For all figures shown, statistical significance was determined using one-way ANOVA (c,k) and two-tailed unpaired t-test (d,e,f,g,h,i,j). ****p<0.0001, ***p<0.001, **p<0.01, *p<0.05, ns, not significant. Scale bars in g, h 20μm; in i, j, k 100μm; Mean±s.e.m.

Comment in

References

    1. Vonsattel JP & DiFiglia M Huntington disease. J Neuropathol Exp Neurol 57, 369–384, doi:10.1097/00005072-199805000-00001 (1998). - DOI - PubMed
    1. Ross CA et al. Huntington disease: natural history, biomarkers and prospects for therapeutics. Nat Rev Neurol 10, 204–216, doi:10.1038/nrneurol.2014.24 (2014). - DOI - PubMed
    1. Kremer B et al. A worldwide study of the Huntington’s disease mutation. The sensitivity and specificity of measuring CAG repeats. N Engl J Med 330, 1401–1406, doi:10.1056/NEJM199405193302001 (1994). - DOI - PubMed
    1. Brinkman RR, Mezei MM, Theilmann J, Almqvist E & Hayden MR The likelihood of being affected with Huntington disease by a particular age, for a specific CAG size. Am J Hum Genet 60, 1202–1210 (1997). - PMC - PubMed
    1. Arrasate M, Mitra S, Schweitzer ES, Segal MR & Finkbeiner S Inclusion body formation reduces levels of mutant huntingtin and the risk of neuronal death. Nature 431, 805–810, doi:10.1038/nature02998 (2004). - DOI - PubMed

Publication types