. 2022 Nov;54(11):1690-1701.
doi: 10.1038/s41588-022-01202-z. Epub 2022 Oct 27.

Adult human kidney organoids originate from CD24+ cells and represent an advanced model for adult polycystic kidney disease

Affiliations

Adult human kidney organoids originate from CD24+ cells and represent an advanced model for adult polycystic kidney disease

Yaoxian Xu et al. Nat Genet. 2022 Nov.

Abstract

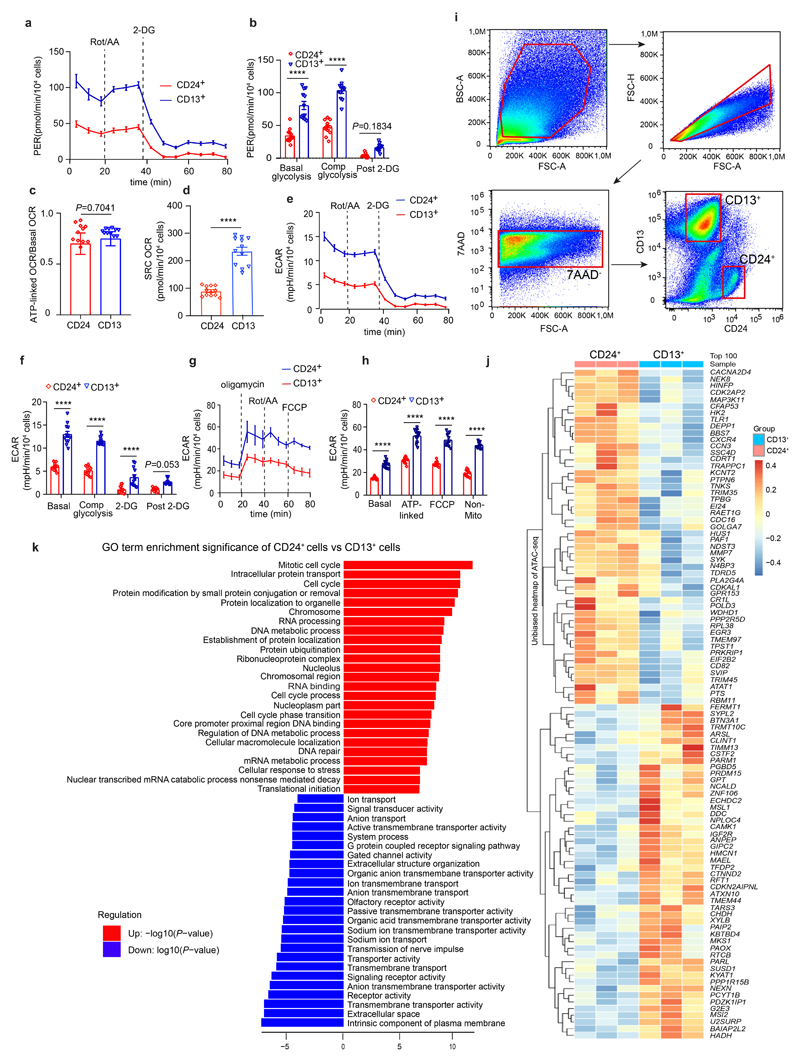
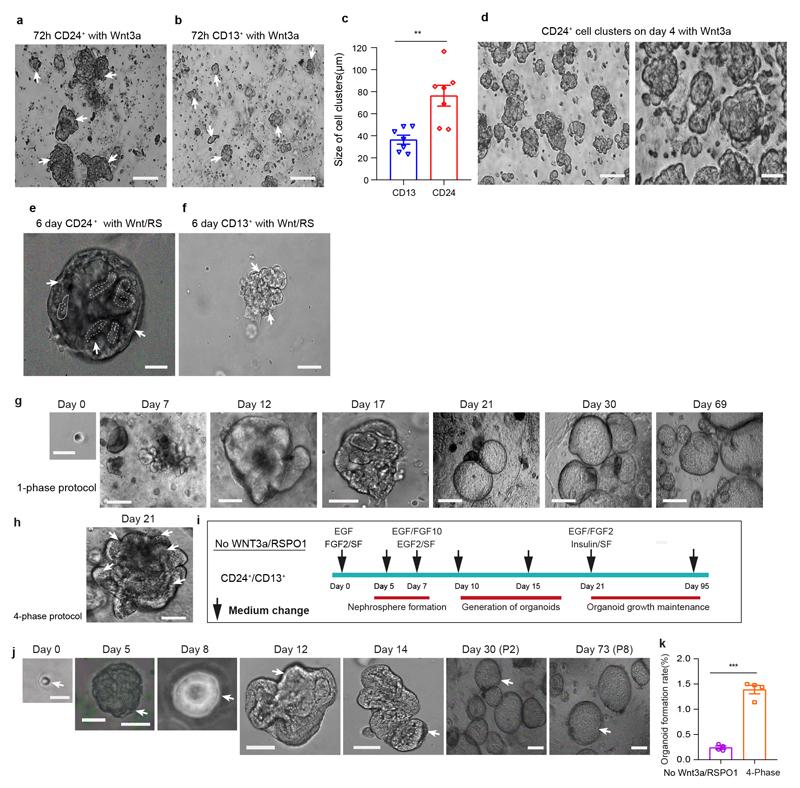
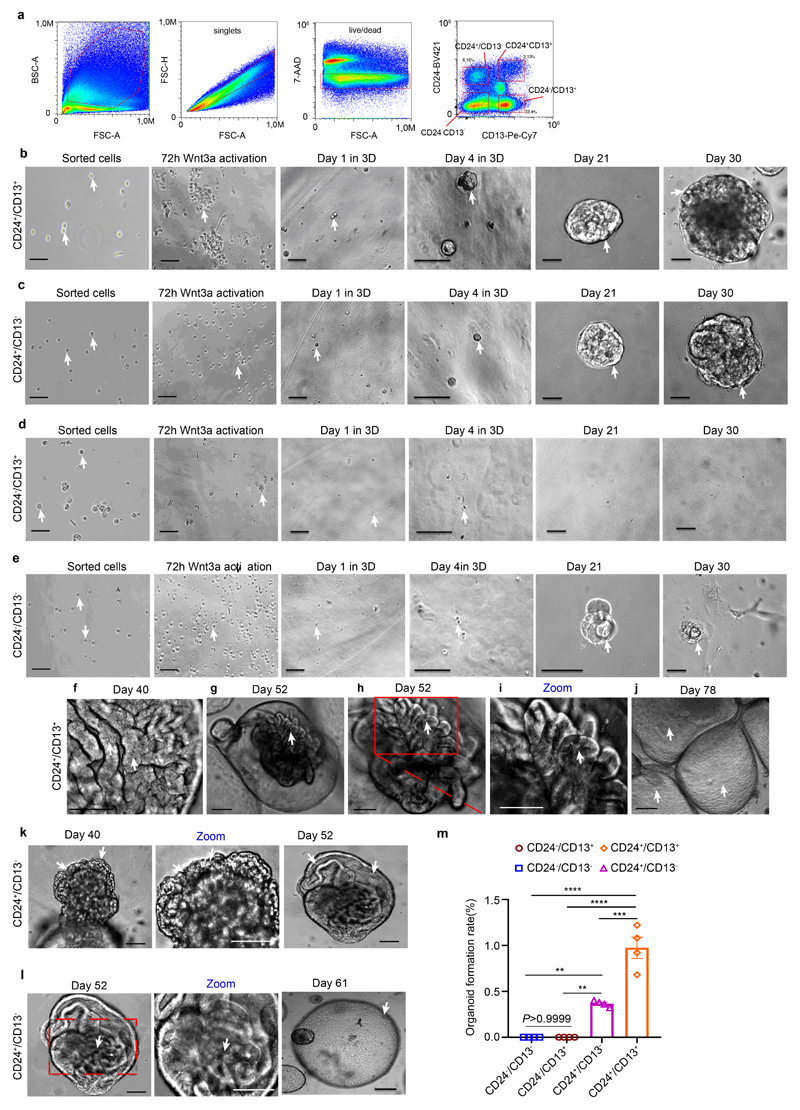
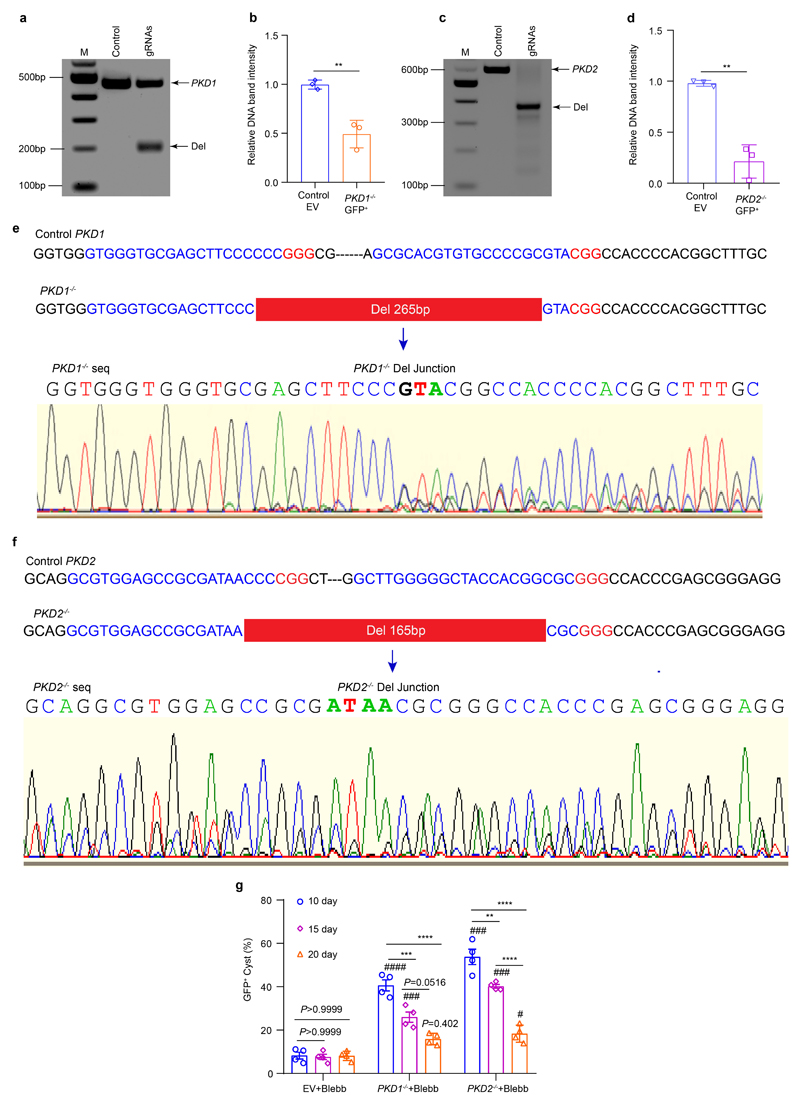
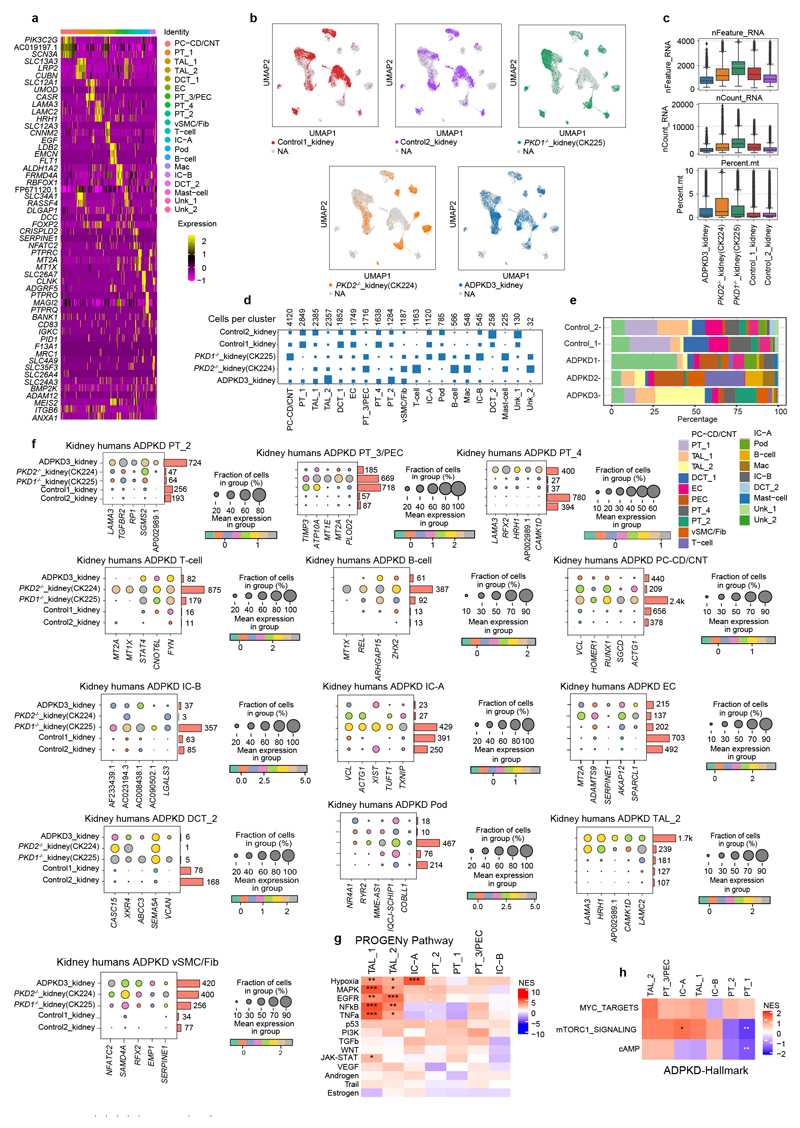
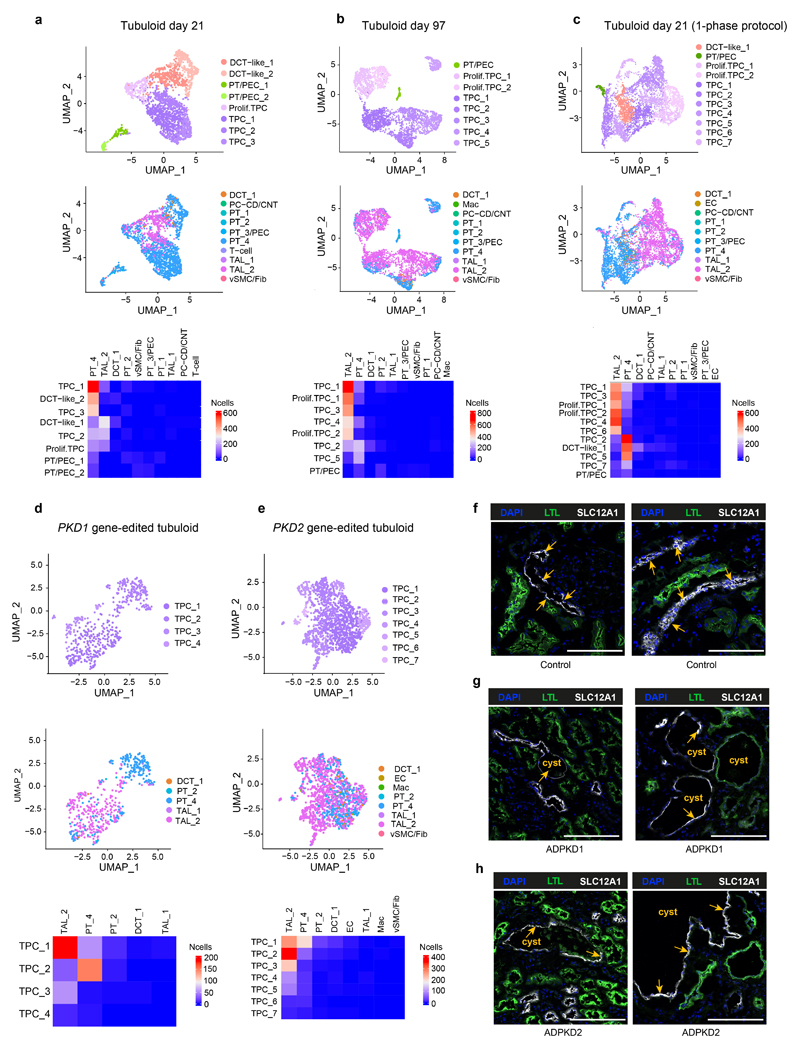
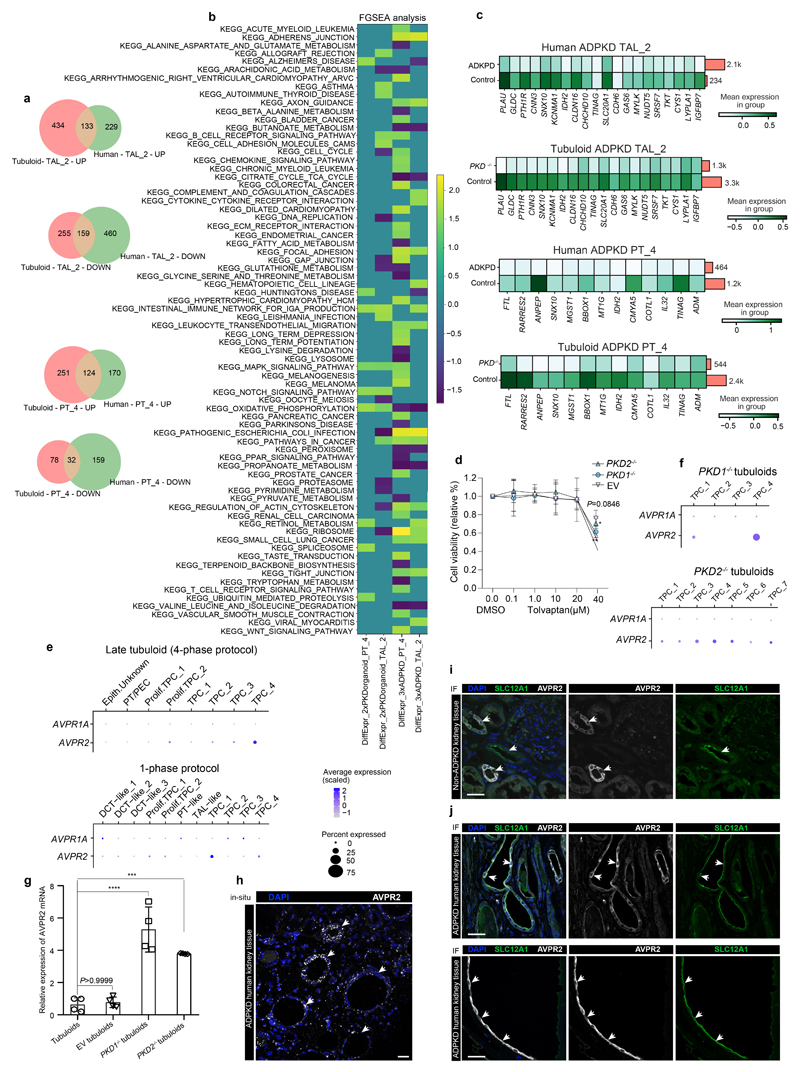
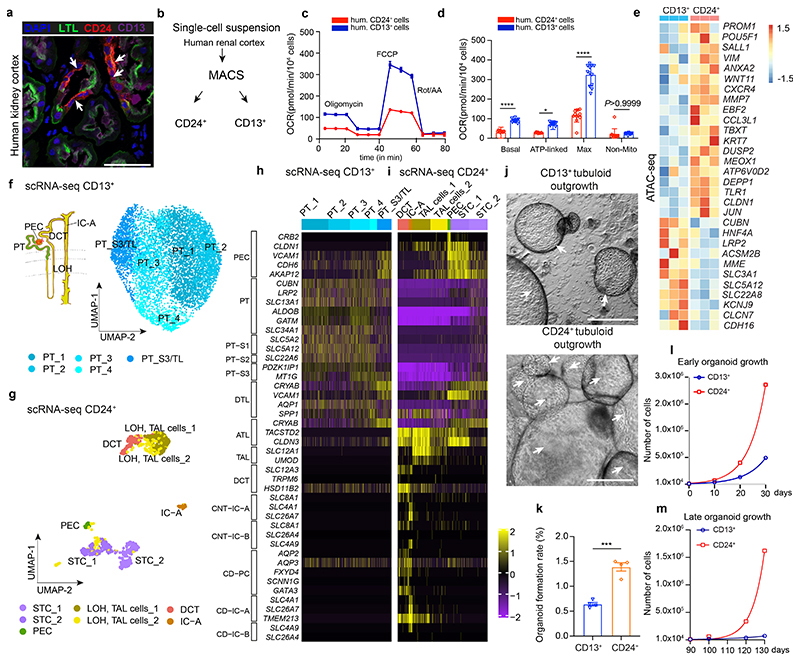
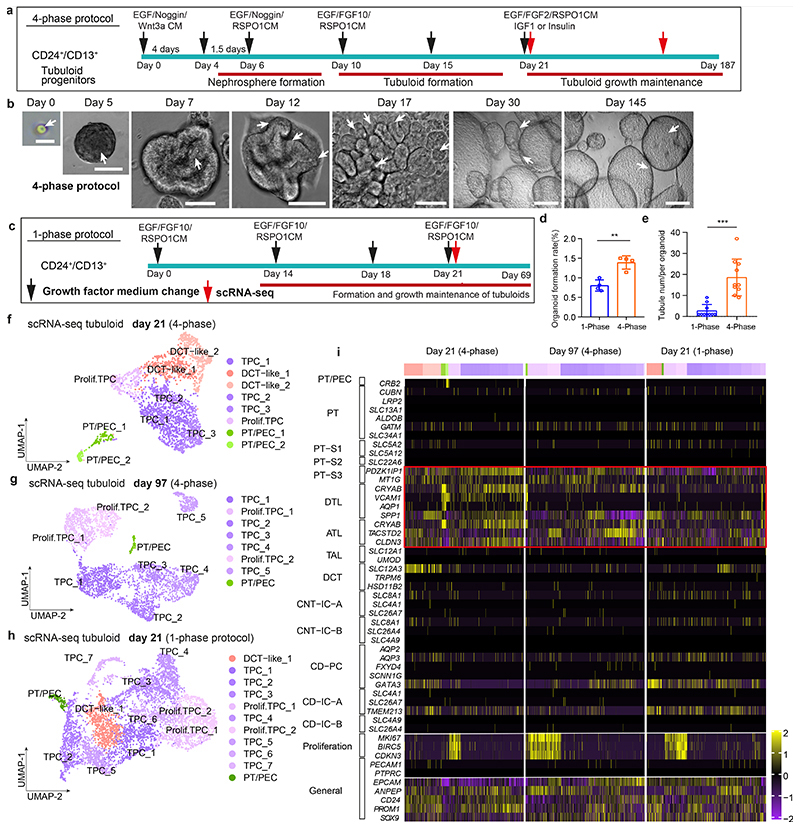
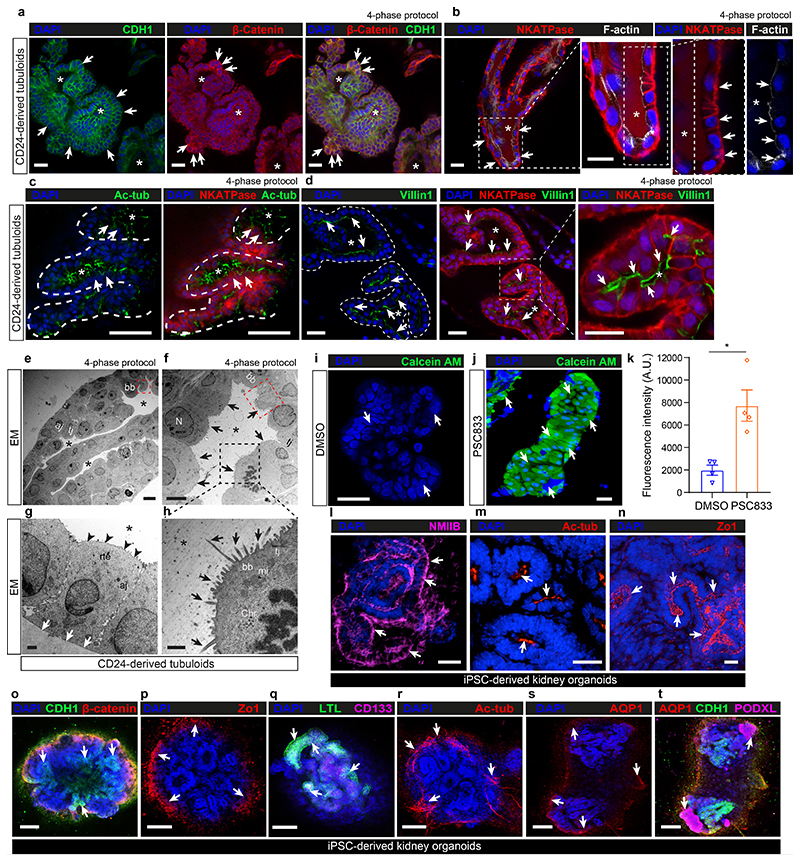
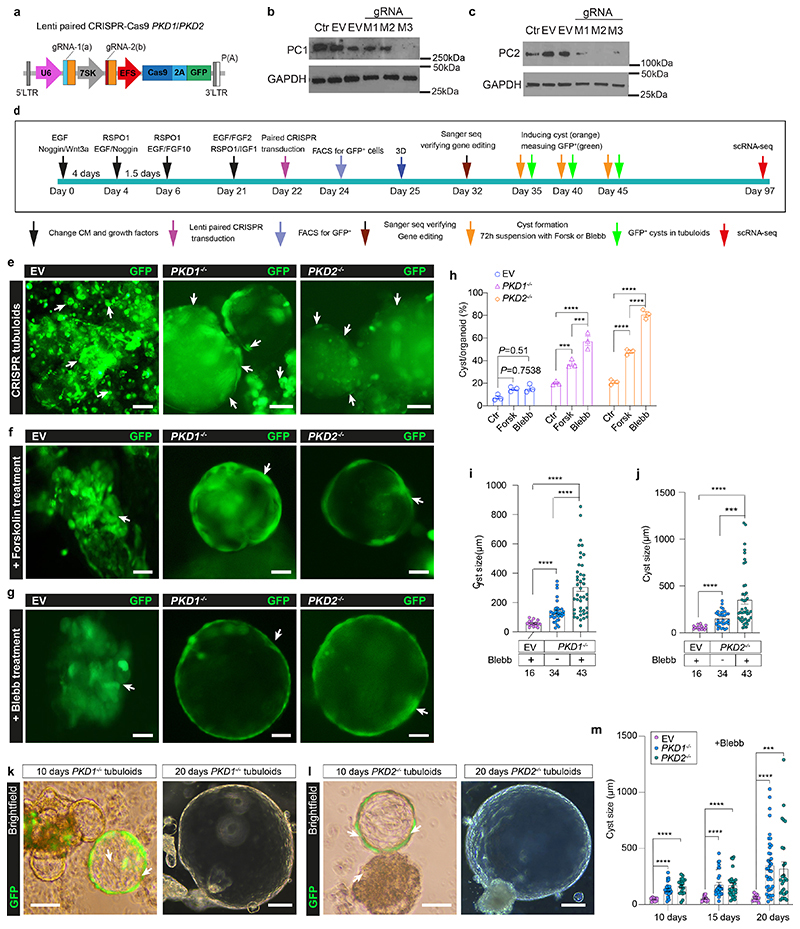
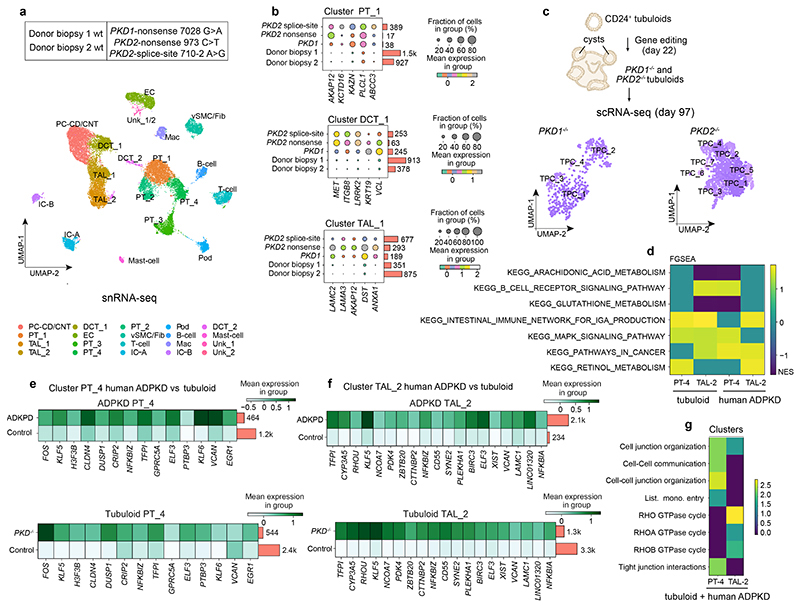
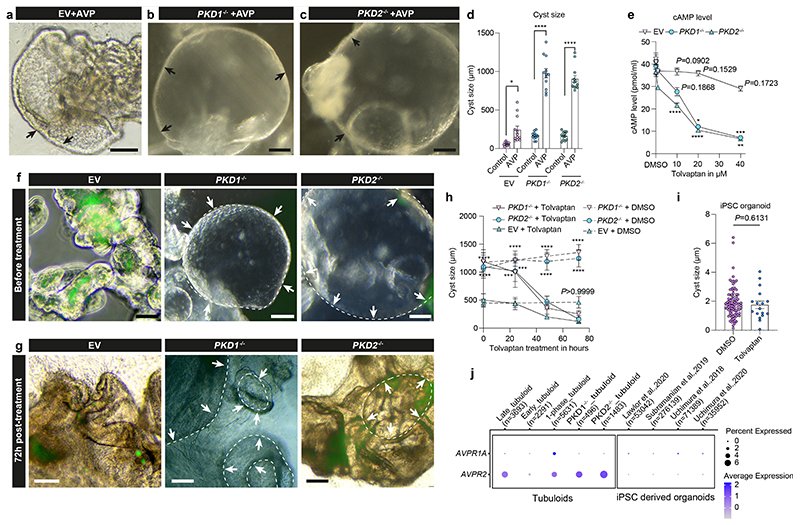
Adult kidney organoids have been described as strictly tubular epithelia and termed tubuloids. While the cellular origin of tubuloids has remained elusive, here we report that they originate from a distinct CD24+ epithelial subpopulation. Long-term-cultured CD24+ cell-derived tubuloids represent a functional human kidney tubule. We show that kidney tubuloids can be used to model the most common inherited kidney disease, namely autosomal dominant polycystic kidney disease (ADPKD), reconstituting the phenotypic hallmark of this disease with cyst formation. Single-cell RNA sequencing of CRISPR-Cas9 gene-edited PKD1- and PKD2-knockout tubuloids and human ADPKD and control tissue shows similarities in upregulation of disease-driving genes. Furthermore, in a proof of concept, we demonstrate that tolvaptan, the only approved drug for ADPKD, has a significant effect on cyst size in tubuloids but no effect on a pluripotent stem cell-derived model. Thus, tubuloids are derived from a tubular epithelial subpopulation and represent an advanced system for ADPKD disease modeling.


Conflict of interest statement

Competing interests

All authors declare no competing interests. Disclosures: R.K. reports unrelated funding from Travere Therapeutics, Galapagos and Novo Nordisk and unrelated honoraria from Bayer, Pfizer, Grünenthal and Novo Nordisk. SH reports unrelated funding from Novo Nordisk. J.S.R. reports unrelated funding from GSK and Sanofi and unrelated fees from Travere Therapeutics and Astex Therapeutics. All other authors have nothing to disclose.

Figures

Extended Data Fig. 1
Extended Data Fig. 1. Metabolism and DNA accessibility in CD24+ cells as compared to CD13+ cells
a-b, Cellular glycolysis and proton efflux rate (PER) of CD24+ cells as compared to CD13+ cells. Statistical analysis in n = 12 mean ± s.e.m. (a-b), 2-way ANOVA post-hoc Bonferroni, non-significant for post 2-deoxy-D-glucose (2-DG, a glucose analog that inhibits glycolysis) in CD24+ cell vs CD13+ cells, P = 0.1834 (b); Basal glycolysis and comp glycolysis (compensatory glycolysis) in CD24+ cells vs CD13+ cells, ****P < 0.0001. c, ATP-linked versus basal oxygen consumption rate (OCR) between CD24+ cells and CD13+ cells in n = 12 mean ± s.e.m., P = 0.7041, non-significant using a two-tailed (also called two-sided) unpaired t-test with Welch’s correction. d, Spare respiratory capacity (SRC) of CD24+ cells compared to CD13+ cells, n = 12 mean ± s.e.m., ****P <0.0001 by a two-tailed unpaired t-test with Welch’s correction. e-f, Extracellular acidification rates (EACR) of CD24+ cells compared to CD13+ cells during anaerobic glycolysis. n = 12 mean ± s.e.m.(e-f), 2-way-ANOVA with post-hoc Bonferroni, non-significant, P = 0.053 for Post 2-DG in CD24+ cells vs CD13+ cells, ****P <0.0001 for Basal, Compensatory glycolysis and 2-DG in CD24+ cells vs CD13+ cells(f). g-h, Extracellular acidification rates (EACR) in CD24+ cells compared to CD13+ cells during aerobic mitochondrial respiration. n = 12 mean ± s.d. (g-h), ****P <0.0001 for Basal, Oligomycin-ATP-linked, FCCP, and non-Mito-Rot/AA in CD24+ cells vs CD13+ cells by 2-way-ANOVA with post-hoc Bonferroni(h). i, FACS gating for sorting of CD13+ or CD24+ cells. j, Scaled heat map showing the chromatin accessibility of top 50 most accessible promoter regions in CD24+ cells or CD13+ cells. k, Top 25 upregulated and downregulated GO terms in CD24+ cells versus CD13+ cells based on the genome-wide measured chromatin accessibility by ATAC-seq.
Extended Data Fig. 2
Extended Data Fig. 2. Wnt3a/RSPO1 activated growth and expansion of CD24+ cells.
a-d, Representative images and quantification of cell-cluster sizes of Wnt3a conditioned medium (CM) treated CD24+ cells compared to CD13+ cells at 72 hours. Statistical analysis in n = 7 mean ± s.e.m., **P = 0.0045 by two-tailed t-test with Welch’s correction(c); CD24+ cells formed large cell clusters before Wnt3a was removed at day 4 (d). Scale bars 100 μm-a and b; 50 μm-d. e-f, Expansion of CD24+ cells into early tubuloids at day 6, which subjected to 4-phase protocol under Wnt3a/RSPO1 conditioned medium (e); CD13+ cells that subjected to 4-phase protocol under Wnt3a/RSPO1 conditioned medium, did not produce tubuloids and presented as loose cell-aggregates with vacuole formation (f). Scale bar 50 μm: e and f. g, Representative images of CD24+ cell derived organoid formation at day 7, 12, 17, 21 as well as organoid growth maintenance at day 30 and day 69, which were subjected to the 1-phase protocol published by Schutgens et al. Scale bar, 200 μm: day 21, 30, 69; 100 μm: day 0, 7, 17; 50 μm: day 12. h, Representative image of CD24+ cell derived organoid formation at day 21 that was subjected to the 4-phase protocol. Scare bar 50μm. i-j, Schematic (I) and representative images of CD24+ cells subjected to a tubuloid protocol without WNT3a/RSPO1(j). In the schematic, a FGF2, FGF10 stability factor (SF), heparin was used in this protocol, stability factor (SF) represents heparin (i). Scale bars 200 μm-m at day 30, 73; 100 μm-m at day 0, day 14; 50 μm-m at day 5, 8, 12 (j). k, Organoid formation rate comparison between CD24+ cell subjected to the 4-phase protocol without Wnt3a/RSPO1 (i-j) and the original 4-phase protocol, n = 4 mean ± s.e.m with two-tailed unpaired t-test with Welch’s correction, ***P = 0.0003. Arrows mark borders of tubuloids. Wnt-Wnt3a; RS-RSPO1. For details on statistics and reproducibility, see Methods.
Extended Data Fig. 3
Extended Data Fig. 3. CD24+ cells are the cellular origin of adult kidney tubuloids.
a, FACS gating for sorted CD24+/CD13+, CD24+/CD13-, CD24-/CD13+ and CD24-/CD13- cells. b-e, Representative bright field images of sorted CD24+/CD13+(b); CD24+/CD13-(c); CD24-/CD13+(d) and CD24-/CD13- cells (e) subjected to the 4-phase organoid formation and expansion protocol. Note that only the populations, that contain CD24+ cells were able to form tubuloids (b, c). Arrows mark cells, borders of nephrospheres or tubuloids. Scale bar 100 μm-b-e: sorted cells, 72h Wnt3a, Day 1 in 3D; 50 μm-b-e: Day 4 in 3D, Day 21, Day 30. f-l, Representative DIC (differential interference contrast) images exhibited growth and expansion of tubuloids from CD24+/CD13+ cells(f-j) and CD24+/CD13- cells(k-l). h represents a zoom from g. Red square marks tubuli in a tubuloid at day 52. Arrows mark cells, borders of tubuli or tubuloids. Scale bars, 200 μm: j;100 μm: g, l at -day 61; 50 μm: f, h, i, k at day 40, l at day 52, l -zoom in. m, Comparison of tubuloid formation rates in CD24+/CD13+, CD24+/CD13-, CD24- /CD13+ and CD24-/CD13- cells. Statistical analysis was performed by 2-way ANOVA with post-hoc Bonferroni correction in n = 4 mean ± s.e.m., non-significant, P >0.9999 for CD24-/CD13- vs CD24-/CD13+; **P = 0.0077 for CD24+/CD13- vs CD24-/CD13+ or CD24-/CD13-; ***P = 0.0002 for CD24+/CD13+ vs CD24+/CD13-; ****P <0.0001 for CD24+/CD13+ vs CD24-/CD13+ or CD24-/CD13- cells. Arrows mark cells, borders of cells or tubuloids.
Extended Data Fig. 4
Extended Data Fig. 4. Gene-editing resulted in a precise deletion within the human PKD1 or PKD2 gene.
a-d, Representative images of a horizontal agarose gel electrophoresis for PCR amplified DNA fragments of the target region using sorted GFP+ cells from PKD1-/-, PKD2-/- and control (lentibbCas9v2eGFP) tubuloids at day 7 of transduced tubuloids in 3D (day 10 after transduction, a and c), quantification of the knockout efficiency from paired gRNA gene editing of PKD1 gene (b) and paired gRNA gene editing of PKD2 gene (d) by measurement of the relative band intensity. Statistical analysis was performed by two-tailed unpaired t-test with n = 3 mean ± s.d., **P = 0.0041 in PKD1-/- tubuloids vs control (b); and n = 3 mean ± s.d., **P = 0.0013 in PKD2-/- tubuloids vs control (d). Uncropped DNA gel images in Supplementary Fig. 18, e-f, Sanger sequencing of the paired CRISPR/Cas9 targeting region revealed an accurate deletion of 265bp in the PKD1 gene (e) and 165bp in the PKD2 gene (f) at day 7 of the transduced kidney tubuloids in 3D (10 days after transduction). g, Quantification of the percentage of GFP+ cysts in control (EV) and PKD1-/-, PKD2-/- tubuloids at 10, 15 and 20 days after transduction that were treated with blebbistatin (Blebb), then transferred into suspension culture for 72 hours. Statistical analysis using 2-way-ANOVA post-hoc Bonferroni in n = 4 mean ± s.e.m., P >0.999, no significant in GFP+ cyst rate of EV tubuloids between day 20 and 15 or 10 each other; P = 0.0516 in GFP+ cyst rate of PKD1-/- +Blebb for day 20 vs 15; ***P = 0.0007 in GFP+ cyst rate of PKD1-/- +Blebb for day 15 vs 10; ****P <0.0001 in GFP+ cyst rate of PKD1-/- +Blebb for day 20 vs 10; **P = 0.0020 in GFP+ cyst rate of PKD2-/- +Blebb for day 15 vs 10; ****P <0.0001 in GFP+ cyst rate of PKD2-/- +Blebb for day 20 vs 15 or 10. ###P <0.001 in PKD1-/- or PKD2-/- +Blebb for day 15 and 10; P = 0.402 in PKD1-/- and #P = 0.048 in PKD2-/- for day 20, by 2-way-ANOVA with post-hoc Bonferroni vs EV+Blebb on the same day.
Extended Data Fig. 5
Extended Data Fig. 5. Single nuclei ADPKD transcriptomic data.
a, Scaled gene expression of the top 3 differentially over-expressed genes (sorted by log2-fold-changes) in each cluster. b, Individual UMAP embeddings of nuclei from each of the 5 human kidney specimens. c, Number of genes, cell count and percentage of reads mapped to mitochondrial genes for each human sample. Box-whisker plots. d, Contribution of each sample toward the composition of the major cell types identified in human samples. e, Cell-type distribution was shown per condition and percentage of cells. f, Top 5 upregulated genes in human ADPKD vs donor biopsies. g, Heatmap of pathway activity using PROGENY comparing the integrated ADPKD kidney tissue data to the donor biopsies, indicating increased pathway activity in several cystic epithelial clusters as compared to their nephron counterparts in the healthy tissue. ***P <0.001; **P < 0.01; *P <0.05. P: Adjusted P-value by Benjamini & Hochberg method for multiple testing, from a nominal P-value obtained from an enrichment test with 10,000 permutations. h, Heatmap of gene-set enrichment of hallmark pathways of ADPKD comparing the integrated human ADPKD tissue data to the control data from donor biopsies. ***P <0.001; **P <0.01; *P <0.05. P: Adjusted P-value by Benjamini & Hochberg method, two-tailed, from a nominal P value obtained from an enrichment test with 1,000 permutations.
Extended Data Fig. 6
Extended Data Fig. 6. Pathway analysis of human ADPKD and control kidney tissue.
a, Gene set enrichment with PID pathway database in human ADPKD kidney tissue compared to controls. b, Gene set enrichment with GO Molecular function terms in human ADPKD kidney tissue compared to controls. c, Gene set enrichment with KEGG pathways in human ADPKD kidney tissue compared to controls. d, Gene set enrichment with BIOCARTA gene sets in human ADPKD kidney tissue compared to controls.
Extended Data Fig. 7
Extended Data Fig. 7. Receptor ligand interaction analysis in human ADPKD kidney tissue snRNA-seq data compared to healthy human kidney tissue.
a, Cell-cell interaction based on CrossTalkeR for all cell-clusters in human ADPKD kidney tissue snRNA-seq data as compared to control tissue (donor biopsies) snRNA-seq data. Color indicates weight of interaction. Orange and cyan color signifies cell-cell interaction enrichment in ADPKD and controls, respectively. b, PageRank log ratio for cell-type ranking based on the in-coming and outgoing interactions. Orange and cyan color signifies cell-cell interaction enrichment in ADPKD and controls, respectively. c, PageRank log ratio for cell-gene interaction ranking. Orange and cyan color signifies cell-cell interaction enrichment in ADPKD and controls, respectively. d, Heatmap of KEGG pathway enrichment using top 100 high-scoring dysregulated genes using the different ranking measures. e, Sankey plot summarizing top 50 out of 566 significant MET ligand-receptor interactions from major cell types. f, Sankey plot summarizing top 50 out of 291 significant ERBB4 ligand-receptor interactions from major cell types.
Extended Data Fig. 8
Extended Data Fig. 8. Subclustering analysis of selected populations in human ADPKD and control tissue snRNA-seq data.
a, Subclustering of principal cells of the collecting duct and epithelial cells of the connecting tubule (PC-CD/CNT), relative distribution of cells per subcluster in ADPKD and control tissue (donor biopsies) and top filtered marker genes of subclusters. b, Subclustering of cells from the distal convoluted tubule (DCT), relative distribution of cells per subcluster in ADPKD and control tissue (donor biopsies) and top filtered marker genes of subclusters. c, Subclustering of collecting duct intercalated cells (ICs), relative distribution of cells per subcluster in ADPKD and control tissue (donor biopsies) and top filtered marker genes of subclusters. d, Subclustering of proximal tubule epithelial cells (PTs), relative distribution of cells per subcluster in ADPKD and control tissue (donor biopsies) and top filtered marker genes of subclusters. e, Subclustering of cells from the Loop of Henle (LOH) thick ascending limb (TAL), relative distribution of cells per subcluster in ADPKD and control tissue (donor biopsies) and top filtered marker genes of subclusters. f, Overrepresentation analyses with Reactome pathway database using up-regulated DE genes obtained from ADPKD vs control comparison.
Extended Data Fig. 9
Extended Data Fig. 9. Symphony mapping of tubuloid cells to human kidney snRNA-seq data
a-e, Symphony mapping of tubuloid cell clusters from different tubuloids generated (a, early tubuloid 4-phase; b, late tubuloid 4-phase; c, tubuloid 1-phase; d, PKD1 gene edited tubuloid; e, PKD2 gene edited tubuloid) to the integrated human kidney snRNA-seq data from donor biopsies. f, Representative Immunofluorescent staining of the proximal tubular marker LTL (green) and the TAL marker SLC12A1 (white), non-ADPKD human kidney tissue. Scale bars 75 μm. g-h, Representative immunofluorescent staining of the proximal tubular marker LTL (green) and the TAL marker SLC12A1 (white) on human ADPKD tissue sections showing epithelial cysts lined by TAL marker SLC12A1+ cells (arrows). Nuclei were counterstained with DAPI. Scale bars 75 μm. For details on statistics and reproducibility, see Methods.
Extended Data Fig. 10
Extended Data Fig. 10. Gene expression in gene edited tubuloids as compared to human kidneys and AVPR2 expression in tubuloids.
a, Venn diagram of separately commonly up and downregulated genes in TAL cluster TAL_2 and PT_4 in human ADPKD kidney tissue versus healthy human kidney (donor biopsies) and the gene edited tubuloids as compared to control tubuloids. b, Commonly dysregulated pathways obtained from gene set enrichment with KEGG pathways using all differentially expressed (DE) genes in human ADPKD vs donor biopsies in PT-4 and TAL-2 cells with the cells of the tubuloids that mapped to PT-4 and TAL-2 using Symphony. c, Top selected commonly downregulated genes in human ADPKD vs donor biopsies and the cells that mapped to PT-4 and TAL-2 in PKD-/- vs Control. d, Results of the CellTiter-Glo 3D Cell Viability assay from control (EV), PKD1-/- and PKD2-/- tubuloids subjected to different doses of tolvaptan. 0.0 indicates 0.2% DMSO treated tubuloids as a control. 2-way ANOVA post-hoc Bonferroni in n = 3 mean ± s.e.m. No significant difference in cell viability for DMSO control (0.0 μM tolvaptan, 0.2% DMSO) compared to 0.1 to 20 μM tolvaptan treated EV tubuloids, PKD1-/-, PKD2-/- tubuloids, P >0.9999; 40 μM tolvaptan vs DMSO control, P = 0.0846 for EV tubuloids, **P = 0.0019 for PKD1-/- tubuloids, and *P = 0.0215 for PKD2-/- tubuloids. e-f, Dotplots of AVPR1A and AVPR2 average scaled mRNA expression in tubuloids (late and 1-phase protocol) (e) and PKD1-/- as well as PKD2-/- (f). g, Relative mRNA expression for AVPR2 (V2R) in non-treated tubuloids as compared to tubuloids transduced with a lentivirus control (EV) and tubuloids were gene edited by lenti paired CRISPR/Cas9 for either PKD1 or PKD2. 1-way-ANOVA with post-hoc Bonferroni in n = 4 mean ± s.d., PKD1-/- tubuloids vs EV tubuloids, ****P <0.0001; PKD2-/- tubuloids vs EV tubuloids, ***P = 0.0006; PKD1-/- tubuloids vs normal tubuloids, ****P <0.0001; PKD2-/- tubuloids vs normal tubuloids, ***P = 0.0004; EV tubuloids vs normal tubuloids, P >0.9999. h, Representative in-situ hybridization of AVPR2, human ADPKD2 kidney tissue section. AVPR2 mRNA was detected in cyst-lining epithelial cells. Scale bar 50 μm. i, Representative immunofluorescent staining of the LOH marker SLC12A1 and AVPR2 in collecting duct epithelial cells. Scale bars 50 μm. j, Representative immunofluorescent staining of the LOH marker SLC12A1 and AVPR2 in ADPKD cyst lining epithelial cells. Scale bars 50 μm. For details on statistics and reproducibility, see Methods.
Fig. 1
Fig. 1. CD24+ cells are a distinct tubular subpopulation and the origin of human kidney tubuloids
a, Human kidney tissue stained for lotus tetragonolobus lectin (LTL), CD13, CD24 (arrows) and DAPI (nuclei). Arrows indicate CD24 costaining with CD13/LTL cells. Scale bar, 50 μm. b, Scheme of cell isolation. c-d, Oxygen consumption rate (OCR) in CD24+ and CD13+ cells. Basal-unstimulated OCR; ATP-linked-oligomycin OCR; Max-FCCP OCR; Non-Mito-ROT/AA OCR; FCCP-Carbonyl cyanide-4 (trifluoromethoxy) phenylhydrazone; Rot/AA-rotenone/antimycin A. Statistical analysis in n = 12 mean ± s.d.(c), and n = 12 mean ± s.e.m.(d), 2-way-ANOVA post-hoc Tukey, *P = 0.0226 for ATP-linked OCR; ****P <0.0001 for basal unstimulated OCR, Max-FCCP OCR; non-significant, P >0.9999 for Non-Mito OCR (d). hum. = human (c, d). e, Heatmap displaying ATAC-seq peak count data in the transcription start site (TSS) of selected genes of CD13+ or CD24+ cells. f, Scheme of the human nephron with proximal tubule (PT), loop of Henle (LOH), distal convoluted tubule (DCT) and type A intercalated cells (IC-A) of the collecting duct and UMAP embedding for sorted CD13+ cells from the human kidney. n = 7,121 cells from proximal tubule: PT_1, 2, 3, 4, and S3 segment/ thin-limb of the LOH (S3/TL). g, UMAP embedding for sorted CD24+ cells from the human kidney. n = 868 cells, distal convoluted tubule cells (DCT), thick ascending limb cells from loop of Henle (TAL cells-1, 2), parietal epithelial cells (PEC), scattered tubule epithelial cells (STC1 and 2), and collecting duct type A intercalated cells (IC-A). h-i, Scaled gene expression of the reported Kidney Precision Medicine Project (KPMP) marker genes of the identified clusters in scRNA-seq of CD13+ cells (h) and CD24+ cells (i). j, Representative difference interference contrast (DIC) microscopy images of 30-day tubuloids. Arrows mark cysts and cyst borders. Scale bar 200 μm. k, Comparison of organoid formation rate. Statistical analysis using two-tailed unpaired t-test, n = 4 mean ± s.e.m, ***P = 0.0002. l-m, Early and late organoid growth curves. 2-way-ANOVA post-hoc Bonferroni, n = 2 from separate experiments, graph shows mean of the two experiments.
Fig. 2
Fig. 2. Single-cell RNA sequencing of tubuloids
a, Timeline of tubuloid generation (4-phase protocol). Black arrows indicate change of conditioned medium and growth factors, red arrows indicate timepoints for single-cell RNA sequencing. b, Representative images of CD24+-cell-derived tubuloids using the 4-phase protocol. Scale bars, 200 μm - day 30, day 145; 100 μm - day 0; 50 μm - day 5, 7, 12, 17. c, Schematic timeline of tubuloid generation using the 1-phase protocol. d-e, Quantification of tubuloid formation rate at day 22 (d) and number of tubuli within a tubuloid at day 25 (e) of CD24+ cells comparing 4-phase and 1-phase protocol. Statistical analysis in n = 4 mean ± s.d., two-tailed unpaired t-test with Welch’s correction, **P = 0.0020(d); n = 10 mean ± s.d., two-tailed unpaired t-test with Welch’s correction, ***P = 0.0002, mean = 18.60 tubuli per 4-phase tubuloid, 95% confidence interval = 9.464 to 22.34, indicating 95% of 4-phase tubuloids contained around 9-22 tubuli(e). Tubule num/per organoid indicates tubule numbers in each organoid (e). f, UMAP embedding of cells from an early tubuloid (day 21, 4-phase protocol). 2,291 cells in 8 clusters: tubuloid progenitors 1-3 (TPC1-3), proliferating TPC, distal convoluted tubule (DCT 1 and 2), proximal tubule / parietal epithelial cells (PT/PEC1 and 2). g, UMAP embedding of cells from a late tubuloid (day 97, 4-phase protocol). 3,693 single cells in 8 clusters:tubuloid progenitor cells (TPC1-5), proliferating tubuloid progenitor cells (Prolif. TPC 1-2), and cells that showed markers of parietal epithelial cells (PEC) and PT (PT/PEC). h, UMAP embedding of cells from an early tubuloid (day 21, 1-phase protocol). 5,631 cells in 11 clusters identified: TPC (TPC1-7), proliferating TPCs, (Prolif. TPC1-2), distal convoluted tubule cells (DCT-like-1), PT/PEC. i, Heatmap of marker gene expression for different nephron parts using Kidney Precision Medicine Project marker genes as well as selected general marker genes and proliferation markers of the early (day 21) and late (day 97) stage tubuloids (4-phase) and an early (day 21) tubuloid (1-phase protocol). For details on statistics and reproducibility, see Methods.
Fig. 3
Fig. 3. CD24+-cell-derived tubuloids represent functional proximal tubules while iPSC-derived organoids represent various parts of the adult kidney.
a, Representative images of tubuloids (4-phase) derived from CD24+ cells stained for CDH1 (E-cadherin), β-catenin and DAPI (nuclei). Scale bar 50 μm. b, Representative images of tubuloids (4-phase) stained for Na+/K+-ATPase (NKATPase), apical filamentous actin (F-actin) and DAPI. Scale bar 50 μm. c, Representative images of tubuloids (4-phase) stained for basolateral acetylated tubulin (Ac-tub), Na+/K+-ATPase and DAPI. Scale bar 50 μm. d, Representative images of tubuloids (4-phase) stained for Villin1 (brush border) with Na+/K+-ATPase and DAPI. Scale bar 50 μm. e-h, Representative transmission electron microscopy (TEM) images of tubuloids (4-phase, day 21). Arrows mark cell borders and microvilli (h). N = nucleus; tj = tight junction; aj = adherens junction, bb = brush border, mi = mitochondria, chr = chromosome, rte = renal tubule epithelium; red dashed squares indicate bb; black dashed squares mark cilia. Black arrows mark the apical and white arrows the basolateral side of epithelial cells. Scale bars, 100 μm - e; 5 μm - f; 1 μm - g and h. i-k, Representative images (i-j) and quantification (k) of intracellular calcein-AM accumulation in tubuloids in the presence of the P-gp transporter inhibitor PSC833 or vehicle (0.2% DMSO). two-tailed unpaired t-test with Welch’s correction, n = 4 mean ± s.e.m., *P = 0.0207. Scale bars, 50 μm - i; 100 μm - j. l-t, Representative images of human iPSC-derived kidney organoids stained for NMIIB (l), acetylated tubulin (Ac-tub; m and r), Zo1 (n and p), CDH1 and β-catenin (o), CD133 and LTL (q), AQP1 (s) and AQP1 with podocalyxin (PODXL, t). DAPI was used to counterstain nuclei in all images. Scale bars, 50 μm: o-t; 25 μm. Stars in all images indicate renal tubule lumen(a-h). Arrows indicate positive stainings in immunofluorescent images (a-d, i, j, l-t). For details on statistics and reproducibility, see Methods.
Fig. 4
Fig. 4. Lentiviral paired CRISPR/Cas9 models adult polycystic kidney disease with rapid cyst formation in tubuloids.
a, Scheme of lentiviral paired CRISPR/Cas9. b-c, Representative Western blots of gene-edited tubuloids. M1-two U6 paired gRNAs, M2/M3-U6 and 7SK paired gRNAs; Ctr-none-transduction, EV-empty vector, GAPDH-loading control. Uncropped Western blot in Supplementary Fig. 18a-d. d, Timeline of gene-editing in tubuloids. e, Representative images of EV, PKD1-/-, PKD2-/- tubuloids at 10 days after transduction. Scale bar 100 μm, e-middle and right; 50 μm, e-left. f-h, Representative images (f-g) and quantification of cyst formation rate (h) using 2-way-ANOVA post-hoc Bonferroni in n = 3 mean ± s.e.m., non-significant for EV Forsk or Blebb vs Ctr; PKD1-/- Forsk vs Ctr, ***P = 0.0007; PKD1-/- Blebb vs Forsk, ***P = 0.0001; PKD1-/- Blebb vs Ctr and PKD2-/- Forsk or Blebb vs Ctr, Blebb vs Forsk, ****P <0.0001(h). Scale bar 100 μm, f-left, g-middle; 50 μm, f-middle and right, g-left and right. Ctr-DMSO. i-j, Quantification of cysts with Brown-Forsythe and Welch ANOVA test post-hoc Tamhane’s T2 in n = 43 PKD1-/- or PKD2-/-+Blebb, n = 34 PKD1-/- or PKD2-/- alone vs n = 16 EV+Blebb mean ± s.d.(i-j), ****P <0.0001 in PKD1-/- for Blebb vs alone, Blebb or alone vs EV(i), in PKD2-/- for Blebb or alone vs EV(j); ***P = 0.0004 in PKD2-/- for Blebb vs alone(j). k-l, Representative images of PKD1-/- (k) and PKD2-/- (l) at day 10 and 20 treated with Blebb. Scale bar 200 μm, right of k-l; 100μm, left of k-l. m, Statistical analysis of cysts using 2-way-ANOVA post-hoc Bonferroni, day 10 in n = 26 PKD1-/- or n = 21 PKD2-/- vs n = 9 EV mean ± s.d.; day 15 in n = 29 PKD1-/- or n = 26 PKD2-/- vs n = 11 EV mean ± s.d.; day 20 in n = 38 PKD1-/- or = 27 PKD2-/- vs =11 EV mean ± s.d., ***P = 0.0004, day 20 of PKD2-/- vs EV; ****P<0.0001, day 10 of PKD1- -/- or PKD2-/- vs EV, day 15 of PKD1-/- or PKD2-/- vs EV, day 20 of PKD1-/- vs EV. For details on statistics and reproducibility, see Methods.
Fig. 5
Fig. 5. Single-cell RNA sequencing of human ADPKD kidney tissue compared to healthy human kidney tissue and gene edited PKD1-/- and PKD2-/- tubuloids.
a, Overview of the human kidney tissue and PKD1/2 genotype used for single-nucleus RNA sequencing (snRNA-seq) and UMAP embedding of n = 26,509 single cells from the 5 human kidney samples. Labels refer to identified cell types. EC, endothelial cells; Mac, macrophages; Fib, fibroblasts; vSMC, vascular smooth muscle cells; PT, proximal tubular cells; Pod, podocytes; vSMC, vascular smooth muscle cells; IC-A/B, intercalated cells A/B; DCT, distal convoluted tubular cells; PC-CD/CNT, principal cells of connecting tubule/collecting duct; TAL, thick ascending limb tubular cells; unk, unknown. b, Top 5 upregulated genes in human ADPKD vs donor biopsies c, Scheme of gene editing and single-cell RNA sequencing (scRNA-seq) in tubuloids. UMAP embedding of n = 496 single cells from PKD1 gene edited tubuloids (4-phase, PKD1-/-)(middle) and n = 1,483 cells from PKD2 gene edited tubuloids (PKD2-/-)(right), tubuloid progenitor cells (TPC). d, Common dysregulated pathways obtained from gene set enrichment with KEGG pathway analysis using all differentially expressed genes in human ADPKD vs donor biopsies in PT-4 and TAL-2 cells with the cells of the tubuloids that mapped to PT-4 and TAL-2 using Symphony. e-f, Top selected commonly upregulated genes in human ADPKD vs donor biopsies and the cells that mapped to PT-4 (e) and TAL-2 (f) in gene edited tubuloids (PKD-/- tubuloids) vs control tubuloids. g, Gene set over-representation analysis with Reactome pathways for the common upregulated genes in human tissue (ADPKD vs donor biopsies) and tubuloids (PKD-/- vs control).
Fig. 6
Fig. 6. Gene-edited ADPKD tubuloids represent a platform for tolvaptan testing.
a-d, Representative images (a-c) and quantification of cyst size (d) in EV, PKD1-/-, PKD2-/- treated with AVP vs control. 2-way-ANOVA post-hoc Bonferroni in n = 12 mean ± s.e.m., *P = 0.0165 for EV+AVP vs control; ****P< 0.0001 for PKD1-/-or PKD2-/-+AVP vs control(d). Scale bars, 200 μm - b and c, 100 μm - a. e, Quantification of cAMP in EV, PKD1-/-, PKD2-/- treated with tolvaptan (0.1-40 μM) or DMSO (0.0) as control. 2-way ANOVA post-hoc Tukey in n = 3 mean ± s.d., compared to control 0.1 μM tolvaptan, P = 0.9779 in EV, P = 0.5354 in PKD1-/-, P >0.9999 in PKD2-/-; 1 μM tolvaptan, P = 0.4963 for EV, P = 0.5975 for PKD1-/-, P = 0.0956 for PKD2-/- non-significant for 10-40 μM tolvaptan in EV; 10 μM tolvaptan in PKD1-/-, P = 0.1868, PKD2-/-, ****P<0.0001; 20μM tolvaptan, *P = 0.0136 for PKD1-/-, ****P<0.0001 for PKD2-/-; 40 μM tolvaptan, ***P = 0.0007 for PKD1-/-, **P = 0.0015 for PKD2-/-. f-h, Representative images (f-g) and quantification (h) of EV, PKD1-/- and PKD2-/- subjected to tolvaptan or DMSO with different times. 2-way-ANOVA post-hoc Tukey in n = 3 mean± s.e.m., for tolvaptan treatment: 0.0 hour, ****P <0.0001 PKD1-/- vs EV, ***P = 0.0001 PKD2-/- vs EV; 24 hour, ***P = 0.0003 for PKD1-/- vs EV; ***P = 0.0002 for PKD2-/- vs EV; 48-72hour, non-significant in cyst size for PKD1-/- or PKD2-/- vs EV (P = 0.4014 for 48 h or P = 0.5268 for 72 h in PKD1-/- vs EV, P = 0.0818 for 48 h or P = 0.9403 for 72h in PKD2-/- vs EV). 24-72 hours for DMSO: ****P <0.0001 in PKD1-/- or PKD2-/- vs EV; comparing 72 hour post-treatment with before treatment: non-significant for EV; ****P <0.0001 for PKD1-/- or PKD2-/-(h). Scale bars, 200 μm - f and g. i, Quantification of cyst size in iPSC-derived ADPKD organoids (PKD2 gene editing) treated with tolvaptan or DMSO. n = 88 vs n = 17 mean ± s.e.m., two-tailed unpaired t-test. j, Expression of AVPR1A, AVPR2 in tubuloids and published scRNA-seq datasets from iPSC-derived organoids. For details on statistics and reproducibility, see Methods.

Comment in

  • Tubuloid as an alternative model of ADPKD.
    Xia Y, De Chiara L, Drummond IA. Xia Y, et al. Kidney Int. 2023 Sep;104(3):409-411. doi: 10.1016/j.kint.2023.03.021. Epub 2023 Apr 5. Kidney Int. 2023. PMID: 37062357 No abstract available.

References

    1. Takasato M, et al. Kidney organoids from human iPS cells contain multiple lineages and model human nephrogenesis. Nature. 2015;526:564–568. - PubMed
    1. Morizane R, et al. Nephron organoids derived from human pluripotent stem cells model kidney development and injury. Nat Biotechnol. 2015;33:1193–1200. - PMC - PubMed
    1. Taguchi A, et al. Redefining the in vivo origin of metanephric nephron progenitors enables generation of complex kidney structures from pluripotent stem cells. Cell Stem Cell. 2014;14:53–67. - PubMed
    1. Freedman BS, et al. Modelling kidney disease with CRISPR-mutant kidney organoids derived from human pluripotent epiblast spheroids. Nat Commun. 2015;6:8715. - PMC - PubMed
    1. Wu H, et al. Comparative Analysis and Refinement of Human PSC-Derived Kidney Organoid Differentiation with Single-Cell Transcriptomics. Cell Stem Cell. 2018;23:869–881.:e8. - PMC - PubMed

Publication types