. 2022 Oct 27;23(1):728.
doi: 10.1186/s12864-022-08938-2.

Genome sequence of the entomopathogenic Serratia entomophila isolate 626 and characterisation of the species specific itaconate degradation pathway

Affiliations

Genome sequence of the entomopathogenic Serratia entomophila isolate 626 and characterisation of the species specific itaconate degradation pathway

Amy L Vaughan et al. BMC Genomics. .

Abstract

Background: Isolates of Serratia entomophila and S. proteamaculans (Yersiniaceae) cause disease specific to the endemic New Zealand pasture pest, Costelytra giveni (Coleoptera: Scarabaeidae). Previous genomic profiling has shown that S. entomophila isolates appear to have conserved genomes and, where present, conserved plasmids. In the absence of C. giveni larvae, S. entomophila prevalence reduces in the soil over time, suggesting that S. entomophila has formed a host-specific relationship with C. giveni. To help define potential genetic mechanisms driving retention of the chronic disease of S. entomophila, the genome of the isolate 626 was sequenced, enabling the identification of unique chromosomal properties, and defining the gain/loss of accessory virulence factors relevant to pathogenicity to C. giveni larvae.

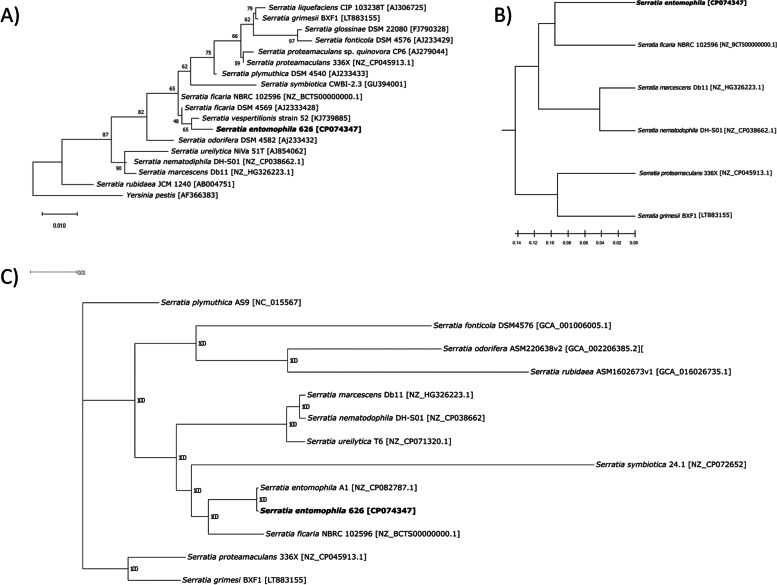
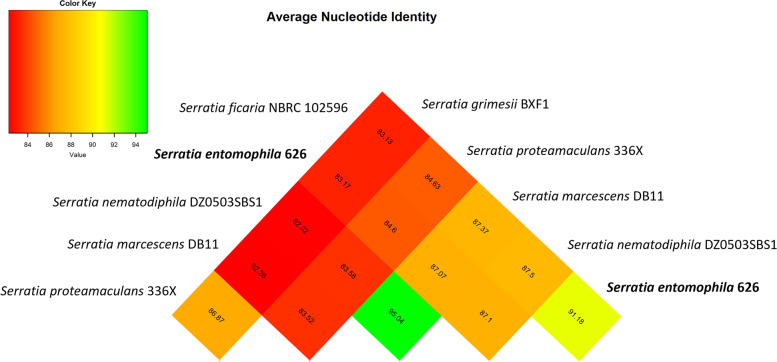
Results: We report the complete sequence of S. entomophila isolate 626, a causal agent of amber disease in C. giveni larvae. The genome of S. entomophila 626 is 5,046,461 bp, with 59.1% G + C content and encoding 4,695 predicted CDS. Comparative analysis with five previously sequenced Serratia species, S. proteamaculans 336X, S. marcescens Db11, S. nematodiphila DH-S01, S. grimesii BXF1, and S. ficaria NBRC 102596, revealed a core of 1,165 genes shared. Further comparisons between S. entomophila 626 and S. proteamaculans 336X revealed fewer predicted phage-like regions and genomic islands in 626, suggesting less horizontally acquired genetic material. Genomic analyses revealed the presence of a four-gene itaconate operon, sharing a similar gene order as the Yersinia pestis ripABC complex. Assessment of a constructed 626::RipC mutant revealed that the operon confer a possible metabolic advantage to S. entomophila in the initial stages of C. giveni infection.

Conclusions: Evidence is presented where, relative to S. proteamaculans 336X, S. entomophila 626 encodes fewer genomic islands and phages, alluding to limited horizontal gene transfer in S. entomophila. Bioassay assessments of a S. entomophila-mutant with a targeted mutation of the itaconate degradation region unique to this species, found the mutant to have a reduced capacity to replicate post challenge of the C. giveni larval host, implicating the itaconate operon in establishment within the host.

Keywords: Chromosome; Entomopathogen; Genome; Horizontal gene transfer; Itaconate; Virulence.


Conflict of interest statement

The authors declare that they have no competing interests.

Figures

Fig. 1
Fig. 1
Inferred phylogeny of Serratia entomophila within the Serratia genus. A 16S rDNA Maximum likelihood tree of 18 sequenced Serratia spp. Percentage of trees shown in which the associated taxa cluster together is shown next to the branches. Branch lengths measured in the number of substitutions per site. This analysis assessed 17 members of the Serratia genus with Yersinia pestis used as an outgroup. Accession numbers for each 16S sequenced used is shown in square brackets. Serratia entomophila 626 is indicated in bold. B Functional genome distribution (FGD) analysis of representative complete Serratia genomes. The predicted ORFeomes of all 6 genomes were subjected to an FGD analysis [24], and the resulting distance matrix was imported into MEGA11 [25]. The functional distribution was visualized using the UPGMA method [26]. C Nonrecombinant core phylogeny of S. entomophila 626 and 12 representatives of the Serratia genus including the S. entomophila A1 type strain
Fig. 2
Fig. 2
ANI values of all the comparative Serratia isolates used in this study displayed in a heat map derived from the comparative matrix. Green denotes nucleotide > 95% percentage similarity, red to yellow reflects lower nucleotide similarity values. Serratia entomophila 626 shown in bold
Fig. 3
Fig. 3
Genome atlas for Serratia entomophila 626. The genome atlas outermost circle shows BlastP similarities against the five Serratia isolates assessed in the study. Regions in blue represent unique proteins whereas red indicates high levels of conservation. Inner circle 2 shows GC content deviation, where dips below the average GC content are shown in green, and high spikes in orange. Circle 3 shows annotations of rRNA (Green) and tRNAs (Red) encoded on the forward and reverse strand. Circle 4 shows ORF orientation either in sense (+, Red) or antisense (-, Blue) orientation. Circle 5 shows the prediction of Signal peptide domains. Outer circle 6 shows assigned COG classification assigned into categories 1–5, 1) Information storage processing 2) cellular processes and signalling 3) metabolism 4) poor characterisation 5) uncharacterised or no assignment. The final innermost circle shows GC skew. Unique regions and phages are highlighted and numbered. Phage_1 denotes the DinI encoding phage. Unique_6 denotes position of the Itaconate degradation operon
Fig. 4
Fig. 4
Distribution of COG functional categories for Serratia spp. Percentage COG distributions of annotated genes and their functions in the complete chromosomes of species belonging to the Serratia genus. The cumulative stacked count shown for each species representative. Full COG breakdowns listed in Additional File 1
Fig. 5
Fig. 5
Total and unique genes for each Serratia isolate assessed. Minimum percentage of isolates a gene must reside to be defined as ‘core’ was set at the default of 95% amino acid similarity. Serratia entomophila 626 highlighted in bold
Fig. 6
Fig. 6
Roary alignments of Serratia entomophila 626 and closest related Serratia species. Peach denotes the presence and yellow the absence of a gene (95% cut off). S. entomophila 626 highlighted in bold
Fig. 7
Fig. 7
Genomic alignments of six Serratia spp. using MAUVE multiple genome alignment software. Blocks indicate orthologous regions- with colour maps showing the percentage nucleotide identity between each orthologous block. Blocks lying above the centre line are in the forward orientation. Blocks below the centre line are on the opposite strand and represent chromosomal rearrangements. 1) Genome location of the itaconate degradation operon in S. entomophila 626. 2) Location of the unique SeDIN. 3) Location of region encoding extracellular phospholipase A1. Parentheses denote inverted region in S. proteamaculans 336X relative to S. entomophila 626
Fig. 8
Fig. 8
Predicted genomic island using IslandViewer4 for Serratia entomophila chromosome and of the genomes of the selected Serratia isolates. A Putative genomic islands for S. entomophila 626. Numbers correspond to genomic island with predicted COG function presented in Table 2. B Putative islands for S. proteamaculans 336X. Red indicates where a genomic island has been predicted by one of the identification tools utilised by IslandViewer (IslandPath-DIMOB, SIGI-HMM, IslandPick, Islander) where blue, orange and green represent alternate prediction tool. Pink dots show the location of homologs of antimicrobial resistance genes identified in the chromosomes of S. proteamaculans 336X, S. marcescens Db11, and S. nematodiphila DH-S01, where prior described island results were available in the database. The S. entomophila 626 itaconate degradation encoding genomic island is identified by point 12
Fig. 9
Fig. 9
Amino acid alignment of predicted phospholipase A1 from across the Serratia genus. S. entomophila 626 (CP074347), S. ficaria NBRC 102596 (NZ_BCTS00000000.1), S. nematodiphila DH-S01 (NZ_CP038662.1), S. marcescens Db11 (NZ_HG326223.1), S. proteamaculans 336X (NZ_CP045913.1), S. grimesii BXF1 (LT883155). GenBank protein accessions shown in brackets
Fig. 10
Fig. 10
Gene synteny of the itaconate degradation pathway operon. A Maximum likelihood tree of RipC amino acid sequence from Serratia entomophila (bold) alongside seven other gene homologues found through BlastP. Scale bar represents 20% genetic variation. Bootstrap values above 50% are shown. B ripABC synteny and gene arrangement with the depicted itaconate operons- the three gene Yersinia pestis and six gene Pseudomonas aeruginosa operons. Colours indicate genes with the same functional prediction as S. entomophila, refer Table 8 for annotations. Red arrow under ripC denotes the mutated gene. C S. proteamaculans co-location of pip and DNA polymerase III subunit theta, where in S. entomophila 626 the itaconate degradation region is positioned. GenBank protein accessions shown in brackets
Fig. 11
Fig. 11
Growth of WT 626, 626::RipC and complemented ripC gene in optimal and stress conditions. 48 h growth curves in triplicate with standard error shown. A) growth of wildtype 626, the 626::RipC mutant and its trans-complemented derivative 626::RipC pACRipC on itaconate agar.B) in LB broth and C) M9 minimal (glucose) broth
Fig. 12
Fig. 12
In vivo competitive growth experiment. In vivo growth curve of a 12 day of 50:50 inoculants of WT 626 and its itaconate mutant derivative 626::RipC in challenged C. giveni larvae, represented on a log10 scale. CFU log10 results for each isolate recorded in triplicate for three-day intervals

References

    1. Petersen LM, Tisa LS. Friend or foe? A review of the mechanisms that drive Serratia towards diverse lifestyles. Can J Microbiol. 2013;59(9):627–640. - PubMed
    1. Kurz CL, Chauvet S, Andres E, Aurouze M, Vallet I, Michel GP, et al. Virulence factors of the human opportunistic pathogen Serratia marcescens identified by in vivo screening. EMBO J. 2003;22(7):1451–1460. - PMC - PubMed
    1. Jones JD, Grady KL, Suslow TV, Bedbrook JR. Isolation and characterization of genes encoding two chitinase enzymes from Serratia marcescens. EMBO J. 1986;5(3):467–473. - PMC - PubMed
    1. Costa MAA, Owen RA, Tammsalu T, Buchanan G, Palmer T, Sargent F. Controlling and co-ordinating chitinase secretion in a Serratia marcescens population. Microbiology. 2019;165(11):1233–1244. - PubMed
    1. Jackson T. Biological control of grass grub in Canterbury. Proc NZ Grassl Assoc. 1990;52:217–20.

Supplementary concepts

LinkOut - more resources