. 2022 Oct 27;21(1):109.
doi: 10.1186/s12944-022-01718-7.

Adeno-associated virus-based caveolin-1 delivery via different routes for the prevention of cholesterol gallstone formation

Affiliations

Adeno-associated virus-based caveolin-1 delivery via different routes for the prevention of cholesterol gallstone formation

Sha Li et al. Lipids Health Dis. .

Abstract

Background: Hepatic caveolin-1 (CAV1) is reduced in cholesterol gallstone disease (CGD). Mice with CAV1 deficiency were prone to develop CGD. However, it remains unknown whether restored hepatic CAV1 expression prevents the development of CGD.

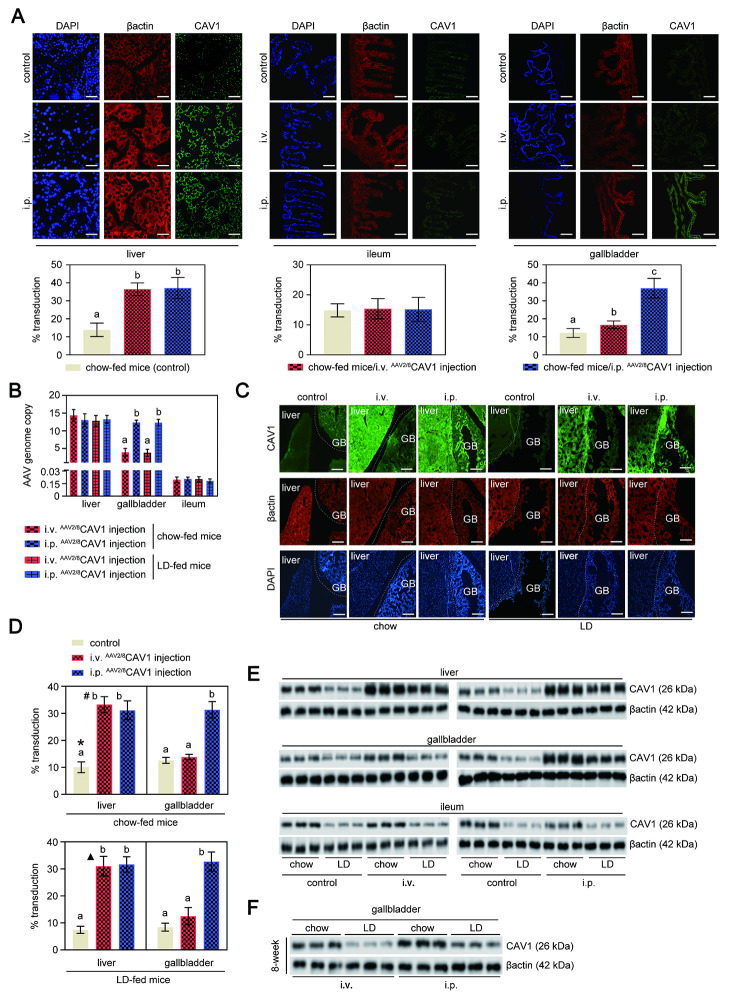
Methods: C57BL/6 mice were injected with adeno-associated virus 2/8 (AAV2/8) vectors carrying the CAV1 gene (AAV2/8CAV1) via intravenous (i.v.) or intraperitoneal (i.p.) route and then subjected to a lithogenic diet (LD) for 8 weeks. Uninjected mice were used as controls. The functional consequences of rescuing CAV1 expression by either i.v. or i.p. AAV2/8CAV1 treatment for CGD prevention and its subsequent molecular mechanisms were examined.

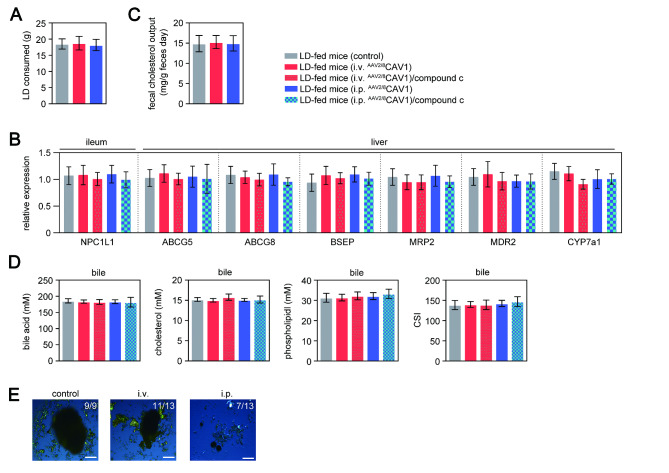
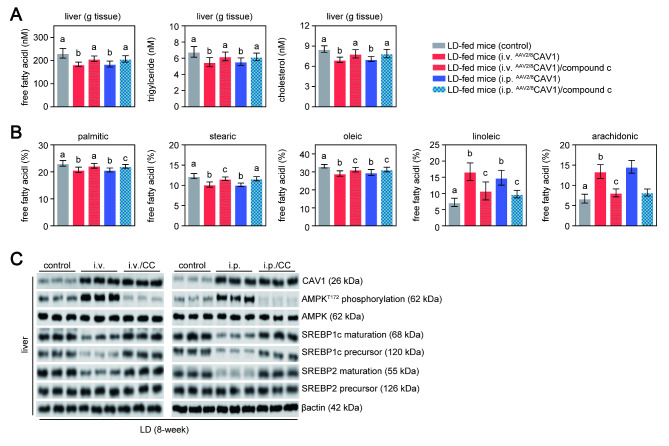
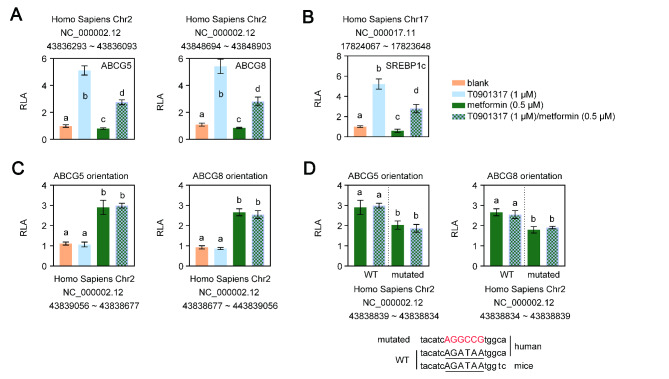
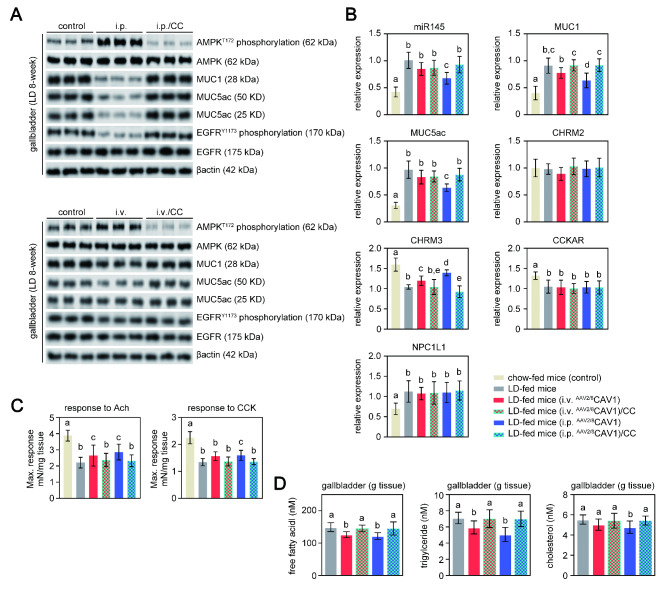
Results: CAV1 expression was reduced in the liver and gallbladder of LD-fed CGD mice. We discovered that AAV2/8CAV1 i.p. delivery results in higher transduction efficiency in the gallbladder than tail vein administration. Although either i.v. or i.p. injection of AAV2/8CAV1 improved liver lipid metabolic abnormalities in CGD mice but did not affect LD feeding-induced bile cholesterol supersaturation. In comparison with i.v. administration route, i.p. administration of AAV2/8CAV1 obviously increased CAV1 protein levels in the gallbladder of LD-fed mice, and i.p. delivery of AAV2/8CAV1 partially improved gallbladder cholecystokinin receptor (CCKAR) responsiveness and impeded bile cholesterol nucleation via the activation of adenosine monophosphate-activated protein kinase (AMPK) signaling, which induced a reduction in gallbladder mucin-1 (MUC1) and MUC5ac expression and gallbladder cholesterol accumulation.

Conclusion: CGD prevention by i.p. AAV2/8CAV1 injection in LD-fed mice was associated with the improvement of gallbladder stasis, which again supported the notion that supersaturated bile is required but not sufficient for the formation of cholesterol gallstones. Additionally, AAV treatment via the local i.p. injection offers particular advantages over the systemic i.v. route for much more effective gallbladder gene delivery, which will be an excellent tool for conducting preclinical functional studies on the maintenance of normal gallbladder function to prevent CGD.

Keywords: Adenosine monophosphate-activated protein kinase; Cholesterol gallstone disease; caveolin-1; mucin-1; mucin-5ac.


Conflict of interest statement

The authors do not have any disclosures to report.

Figures

Fig. 1
Fig. 1
The i.p. injection improves the delivery of AAV2/8 CAV1 to the mouse gallbladder compared with i.v. injection Mice were injected (either via the i.v. or i.p. route) with or without AAV2/8CAV1 at 1 × 1011 vg/animal and then assigned to chow or LD (8-week) The letters on each bar are provided for statistical purposes, and different letters indicate significance (P < 0.05). If there are no significant differences between two bars, they have the same letter. The individual P values are described in Supplementary Table 3. A. Serial sections of frozen (5 μm) liver, gallbladder, and ileum tissues collected from mice were stained for β-actin (red) to quantify cell-specific CAV1 (green) transduction percentages. Representative images are shown. Blue: DAPI staining for nuclei. Scale bar: 20 μm. Quantification of liver, gallbladder, and ileum transduction was determined by the percentage of CAV1 staining-positive area. The fluorescence intensities of CAV1 expression areas were normalized to the fluorescence intensities of the β-actin-stained area. The results in the lower panel are shown as the mean ± SD (three sections from each animal were analyzed). n = 13 for each group, mice with either i.v. or i.p. administration of AAV2/8CAV1; n = 5 for control (uninjected) mice. B. qRT‒PCR analysis of AAV genomes in liver, gallbladder, and ileum collected from chow-fed (n = 9 each group, mice with either i.v. or i.p. administration of AAV2/8CAV1) or LD-fed (n = 13 for each group, mice with either i.v. or i.p. administration of AAV2/8CAV1) mice. C. Cryosections (5 μm) of liver and gallbladder tissues collected from mice were stained for β-actin (red) to quantify cell-specific CAV1 (green) transduction percentages. Representative images are shown. Blue: DAPI staining for nuclei. Scale bar: 100 μm. GB, gallbladder. D. Quantification of liver and gallbladder transduction was determined by the percentage of CAV1 staining-positive area. The fluorescence intensities of CAV1 expression areas were normalized to the fluorescence intensities of β-actin-stained areas under the same fluorescence microscopic field. The results in the right panel are shown as the mean ± SD (three sections from each animal were analyzed). n = 13 for each group, mice with either i.v. or i.p. administration of AAV2/8CAV1; n = 5 for control (uninjected) mice. *, P = 0.047 for the fluorescence intensities of CAV1 expression areas in liver versus GB in chow-fed control mice; #, P = 5.7e-14 for the fluorescence intensities of CAV1 expression areas in liver versus GB in chow-fed i.v. AAV2/8CAV1-injected mice; ▲, P = 5.95e-13 for the fluorescence intensities of CAV1 expression areas in liver versus GB in LD-fed i.v. AAV2/8CAV1-injected mice. E. Western blotting analysis of CAV1 protein expression in the liver, gallbladder, and ileum of chow-fed or LD-fed mice. β-actin was used as a loading control. The data are representative of three samples for each protein. i.v., AAV2/8CAV1 injection (1 × 1011 vg/mice) via the i.v. route; i.p., AAV2/8CAV1 injection (1 × 1011 vg/mice) via the i.p. route. F. Western blotting analysis for the comparison of CAV1 protein expression in the gallbladder of chow-fed or LD-fed mice between i.v. (1 × 1011 vg/mouse) and i.p. (1 × 1011 vg/mouse) routes of administration of AAV2/8CAV1. β-actin was used as a loading control. The data are representative of three samples for each protein.
Fig. 2
Fig. 2
AAV2/8 CAV1 treatment via the i.p. route can partially prevent CGD in LD-fed mice through the biliary CSI-independent pathway Mice were injected (either via the i.v. or i.p. route) with or without AAV2/8CAV1 at 1 × 1011 vg/animal and then fed LD following PBS or compound c treatment (8 weeks). n = 13 for each group, LD-fed mice with either i.v. or i.p. administration of AAV2/8CAV1 with or without compound c treatment (10 mg/kg, i.p. injection once a day); n = 9 for LD-fed mice (control) with neither AAV2/8CAV1 administration nor compound c treatment The letters on each bar are provided for statistical purposes, and different letters indicate significance (P < 0.05). If there are no significant differences between two bars, they have the same letter. The individual P values are described in Supplementary Table 3. A. Lithogenic diet mass consumed by each group of mice. B. qRT‒PCR analysis of the liver, gallbladder, and ileum messenger RNA expression of cholesterol, phospholipid transporters, and bile acid transporters in each group of mice. 18 S rRNA was used as an internal control. Data represent the mean ± SD. C. Twenty-four-hour cumulative fecal samples collected from each group of mice were pooled and measured for total cholesterol contents. D. Biliary concentrations of cholesterol, phospholipids, bile acid, and CSI in each group of mice. E. Polarizing light microscopy examination of cholesterol crystals in the gallbladder of each group of mice. i.v., AAV2/8CAV1 injection (1 × 1011 vg/mice) via the i.v. route; i.p., AAV2/8CAV1 injection (1 × 1011 vg/mice) via the i.p. route.
Fig. 3
Fig. 3
AMPK inhibition hampered the protective effect of AAV2/8 CAV1 treatment on LD-induced hepatic lipid accumulation Mice were injected (either via the i.v. or i.p. route) with or without AAV2/8CAV1 at 1 × 1011 vg/animal and then fed LD. n = 13 for each group, LD-fed mice with either i.v. or i.p. administration of AAV2/8CAV1 with or without compound c treatment (10 mg/kg, i.p. injection once a day); n = 9 for LD-fed mice (control) with neither AAV2/8CAV1 administration nor compound c treatment The letters on each bar are provided for statistical purposes, and different letters indicate significance (P < 0.05). If there are no significant differences between two bars, they have the same letter. The individual P values are described in Supplementary Table 3. A. Quantitation of free fatty acids, triacylglycerol, and cholesterol in the liver of each group of mice. B. Proportion of each liver free fatty acid profile (palmitic acid, stearic acid, oleic acid, linoleic acid, and arachidonic acid) in each group of mice. C. Western blotting analysis of AMPK (and its phosphorylation), CAV1, and SREBP1c protein expression in the liver and gallbladder of each group of mice. β-actin was used as a loading control. Data are representative of three samples for each protein. T172, the activation marker of AMPK phosphorylation at threonine 172; i.v., AAV2/8CAV1 injection (1 × 1011 vg/mice) via the i.v. route; i.p., AAV2/8CAV1 injection (1 × 1011 vg/mice) via the i.p. route; CC, compound C injection (10 mg/kg/day) via the i.p. route.
Fig. 4
Fig. 4
AMPK and LXR transactivate the human ABCG5/G8 gene at different sites Data represent the mean ± SD of fold-independent experiments, expressed as fold-change vs. untreated cells The letters on each bar are provided for statistical purposes, and different letters indicate significance (P < 0.05). If there are no significant differences between two bars, they have the same letter. The individual P values are described in Supplementary Table 3. RLA, relative luciferase activity. A and B. HepG2 cells were cotransfected with the pGL3 reporter containing a DNA fragment from intron 2 of the human ABCG5 gene (A, left panel), a DNA fragment from intron 3 of the human ABCG8 gene (A, right panel), an intragenic region (in either the ABCG5 or ABCG8 orientation) of the human ABCG5/ABCG8 gene (B), and a control plasmid (the plasmid containing the β-galactosidase reporter gene). Six hours after transfection, cells were treated with 1 µM T0901317 (LXR agonist) plus 0.5 mM metformin (AMPK agonist). Untreated cells were used as a control. Twenty-four hours later, the cells were washed with 0.5 mL PBS, and luciferase and β-galactosidase activities were quantified using a luciferase assay kit. Normalized firefly luciferase activity by β-galactosidase activity without treatment was set as 1. C. HepG2 cells were cotransfected with the pGL3 reporter containing a 420 bp DNA fragment from the fragment of the human SREBP1c promoter and a control plasmid (the plasmid containing the β-galactosidase reporter gene). Six hours after transfection, cells were treated with 1 µM T0901317 (LXR agonist) plus 0.5 mM metformin (AMPK agonist). Untreated cells were used as a control. Twenty-four hours later, the cells were washed with 0.5 mL PBS, and luciferase and β-galactosidase activities were quantified using a luciferase assay kit. Normalized firefly luciferase activity by β-galactosidase activity without treatment was set as 1. D. HepG2 cells were cotransfected with the pGL3 reporter containing an intragenic region of the human ABCG5/ABCG8 gene (in either the ABCG5 or ABCG8 orientation) with a GATA-mutated binding site, or a wild-type intragenic region of the human ABCG5/ABCG8 gene (in either the ABCG5 or ABCG8 orientation), and a control plasmid (the plasmid containing the β-galactosidase reporter gene). Six hours after transfection, cells were treated with 0.5 mM metformin (AMPK agonist) or plus 1 µM T0901317 (LXR agonist). Untreated cells were used as a control. Twenty-four hours later, the cells were washed with 0.5 mL PBS, and luciferase and β-galactosidase activities were quantified using a luciferase assay kit. Normalized firefly luciferase activity by β-galactosidase activity without treatment was set as 1. WT, wild type; mutated, GATA binding site mutation; underlying uppercase letter, GATA binding sequence; uppercase letter in red, mutated GATA binding sequence.
Fig. 5
Fig. 5
CAV1-associated gallbladder AMPK activation protects mice from LD-induced CGD via the prevention of gallbladder stasis Mice were injected (either via the i.v. or i.p. route) with or without AAV2/8CAV1 at 1 × 1011 vg/animal and then fed LD following PBS or compound c treatment (8 weeks). n = 13 for each group, LD-fed mice with either i.v. or i.p. administration of AAV2/8CAV1 with or without compound c treatment (10 mg/kg, i.p. injection once a day); n = 9 for LD-fed mice with neither AAV2/8CAV1 administration nor compound c treatment. Chow-fed (8-week) mice (n = 5) were used as a control The letters on each bar are provided for statistical purposes, and different letters indicate significance (P < 0.05). If there are no significant differences between two bars, they have the same letter. The individual P values are described in Supplementary Table 3. A. Western blotting analysis of AMPK (and its phosphorylation), EGFR (and its phosphorylation), MUC1, and MUC5ac protein expression in the gallbladder of each group of mice. β-actin was used as a loading control. Data are representative of three samples for each protein. T172, the activation marker of AMPK phosphorylation at threonine 172; Y1173, the activation marker of EGFR phosphorylation at tyrosine 1173; i.v., AAV2/8CAV1 injection (1 × 1011 vg/mice) via the i.v. route; i.p., AAV2/8CAV1 injection (1 × 1011 vg/mice) via the i.p. route; CC, compound c injection (10 mg/kg/day) via the i.p. route. B. qRT‒PCR analysis of CCKAR, CHRM2, CHRM3, miR145-5p, MUC1, MUC5ac, and NPC1L1 expression in the gallbladder of each group of mice. 18 S rRNA was used as an internal control. Data represent the mean ± SD of three independent experiments. CC, compound c injection (10 mg/kg/day) via the i.p. route. C. The contractile force of gallbladder smooth muscle is generated in response to 10 µM acetylcholine or 10 nM cholecystokinin. Data represent the mean ± SD of three independent experiments. Ach, acetylcholine; CCK, cholecystokinin. D. Quantitation of free fatty acids, triacylglycerol, and cholesterol in the gallbladder of each group of mice.

Similar articles

Cited by

References

    1. Parton RG, del Pozo MA. Caveolae as plasma membrane sensors, protectors and organizers. Nat Rev Mol Cell Biol. 2013;14:98–112. - PubMed
    1. Sohn J, Lin H, Fritch MR, Tuan RS. Influence of cholesterol/caveolin-1/caveolae homeostasis on membrane properties and substrate adhesion characteristics of adult human mesenchymal stem cells. Stem Cell Res Ther. 2018;9:86. - PMC - PubMed
    1. Fernandez-Rojo MA, Ramm GA. Caveolin-1 Function in Liver Physiology and Disease. Trends Mol Med. 2016;22:889–904. - PubMed
    1. Hernandez-Nazara A, Curiel-Lopez F, Martinez-Lopez E, Hernandez-Nazara Z, Panduro A. Genetic predisposition of cholesterol gallstone disease. Ann Hepatol. 2006;5:140–9. - PubMed
    1. Bosch M, Mari M, Herms A, Fernandez A, Fajardo A, Kassan A, Giralt A, Colell A, Balgoma D, Barbero E, et al. Caveolin-1 deficiency causes cholesterol-dependent mitochondrial dysfunction and apoptotic susceptibility. Curr Biol. 2011;21:681–6. - PMC - PubMed

Supplementary concepts