. 2022 Oct 28;20(1):411.
doi: 10.1186/s12916-022-02614-8.

Combination of an autophagy inhibitor with immunoadjuvants and an anti-PD-L1 antibody in multifunctional nanoparticles for enhanced breast cancer immunotherapy

Affiliations

Combination of an autophagy inhibitor with immunoadjuvants and an anti-PD-L1 antibody in multifunctional nanoparticles for enhanced breast cancer immunotherapy

Yibin Cheng et al. BMC Med. .

Abstract

Background: The application of combination therapy for cancer treatment is limited due to poor tumor-specific drug delivery and the abscopal effect.

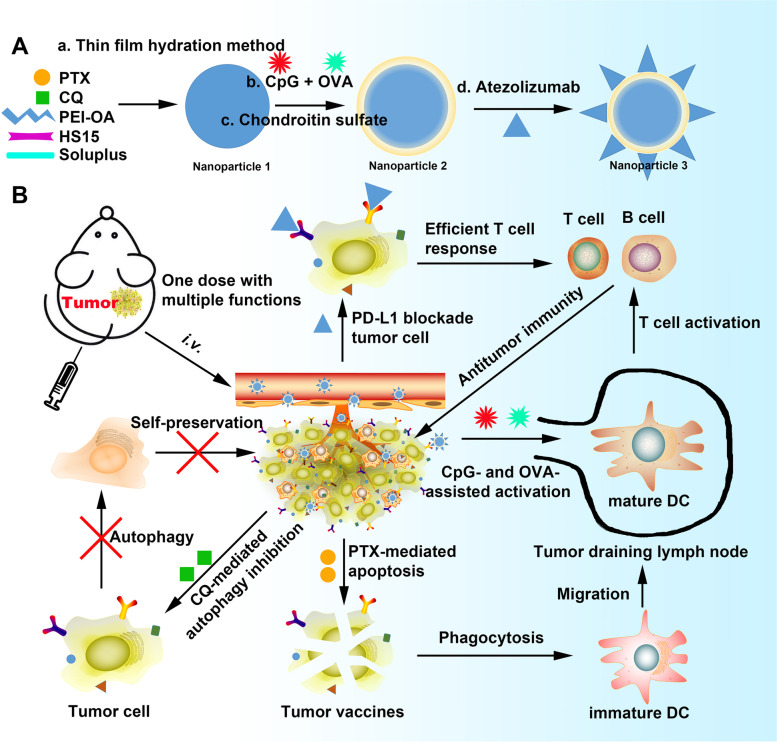
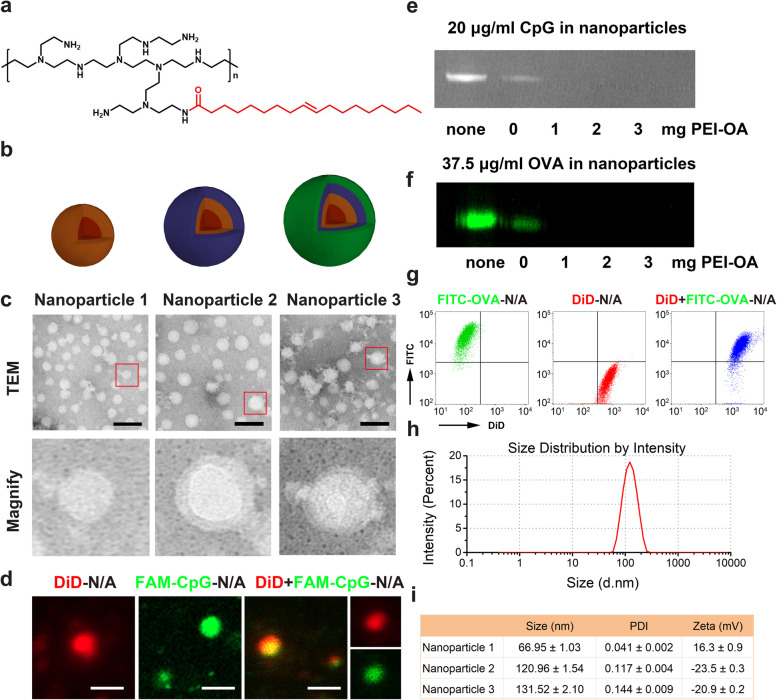
Methods: Here, PD-L1- and CD44-responsive multifunctional nanoparticles were developed using a polymer complex of polyethyleneimine and oleic acid (PEI-OA) and loaded with two chemotherapeutic drugs (paclitaxel and chloroquine), an antigen (ovalbumin), an immunopotentiator (CpG), and an immune checkpoint inhibitor (anti-PD-L1 antibody).

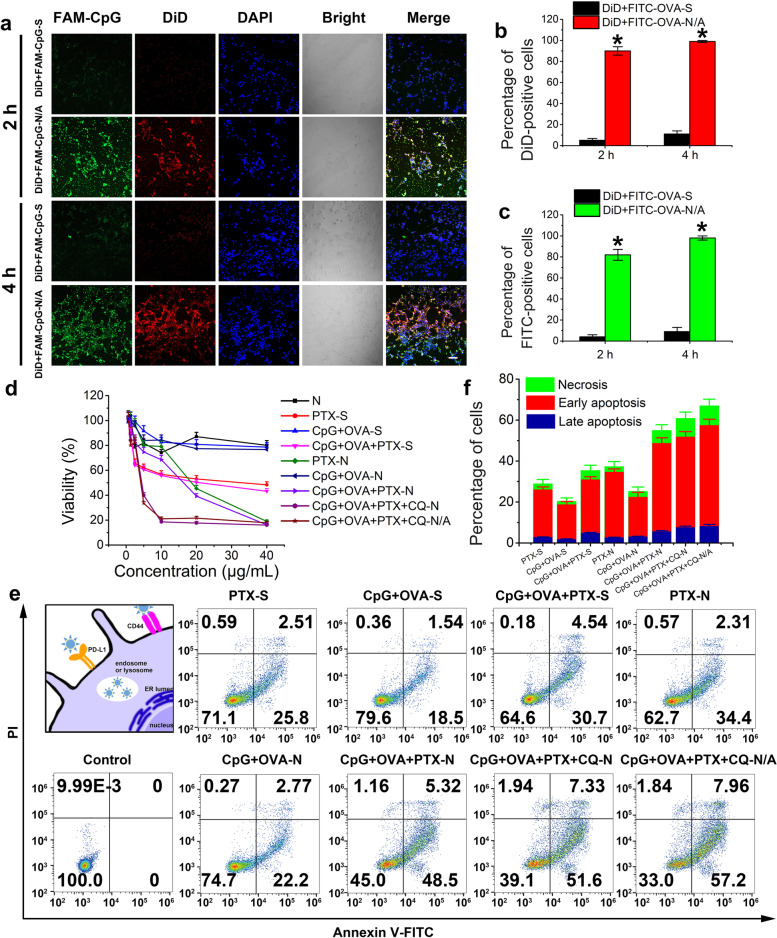
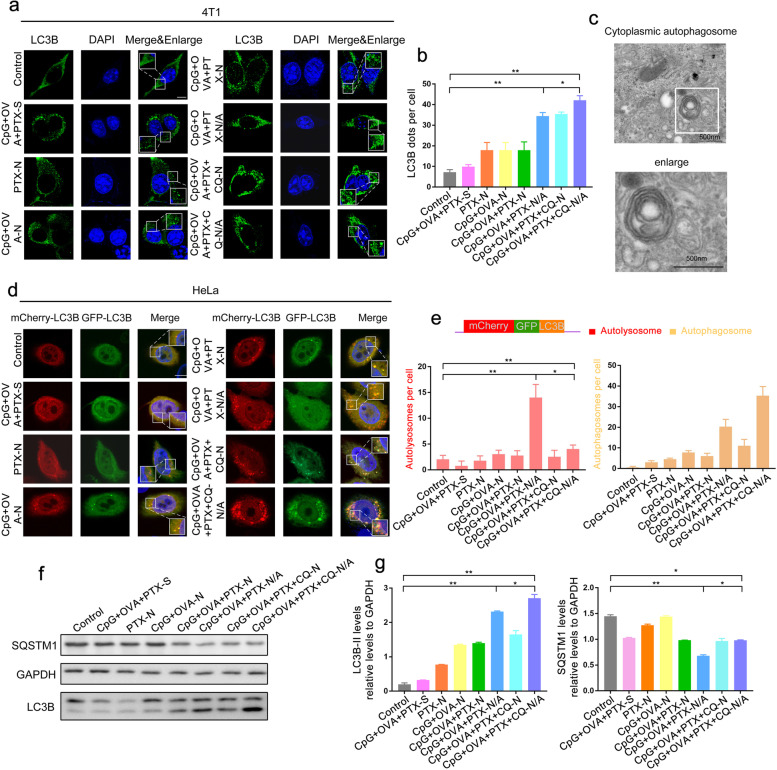
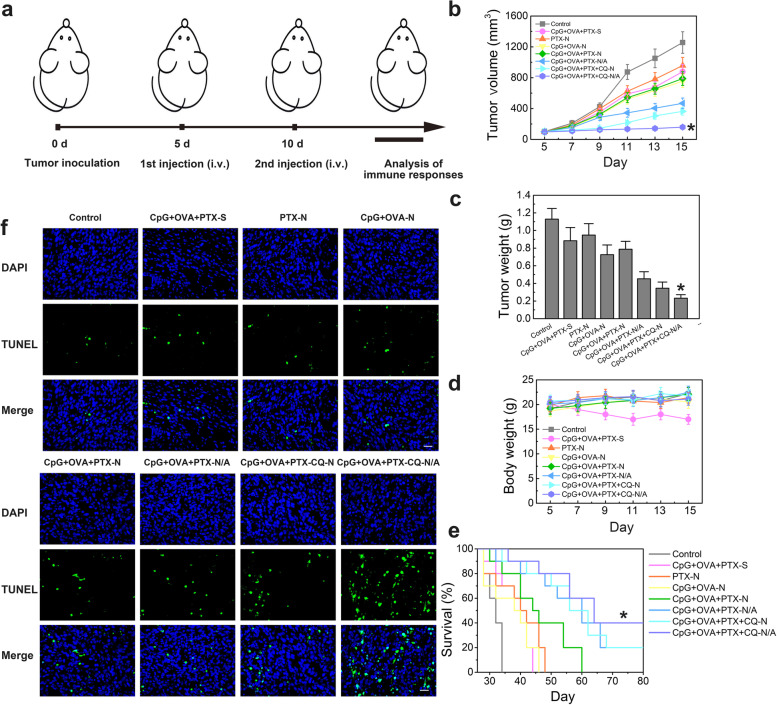
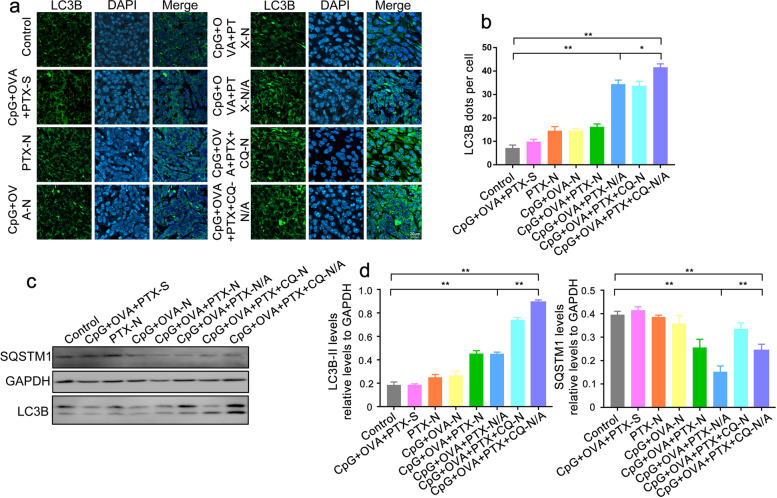
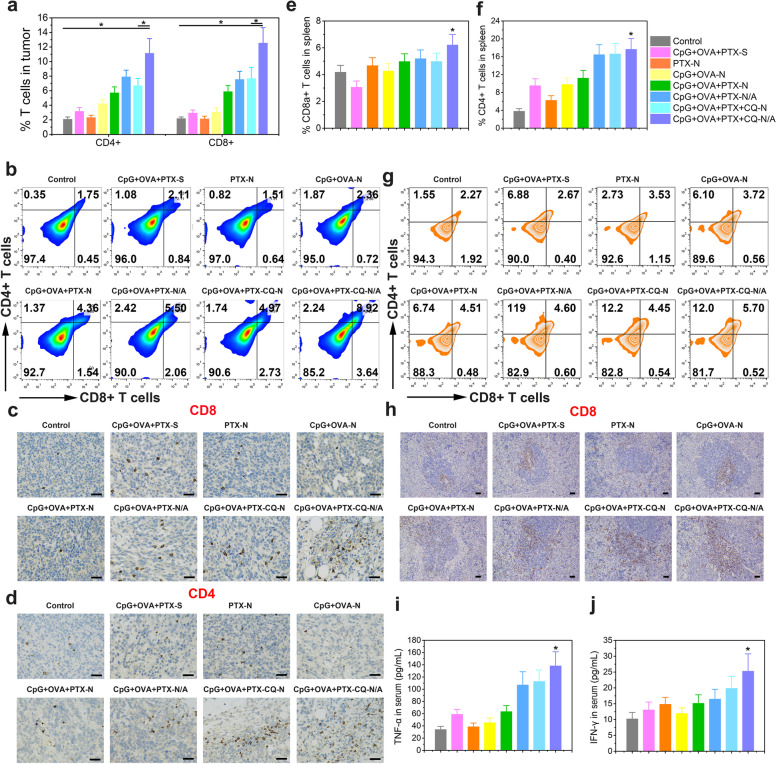
Results: PEI-OA greatly improved the drug loading capacity and encapsulation efficiency of the nanoplatform, while the anti-PD-L1 antibody significantly increased its cellular uptake compared to other treatment formulations. Pharmacodynamic experiments confirmed that the anti-PD-L1 antibody can strongly inhibit primary breast cancer and increase levels of CD4+ and CD8+ T cell at the tumor site. In addition, chloroquine reversed the "immune-cold" environment and improved the anti-tumor effect of both chemotherapeutics and immune checkpoint inhibitors, while it induced strong immune memory and prevented lung metastasis.

Conclusions: Our strategy serves as a promising approach to the rational design of nanodelivery systems for simultaneous active targeting, autophagy inhibition, and chemotherapy that can be combined with immune-checkpoint inhibitors for enhanced breast cancer treatment.

Keywords: Anti-PD-L1 antibody; Autophagy response; Immuno-chemotherapy; Multifunctional nanoparticles.


Conflict of interest statement

The authors declare that they have no competing interests.

Figures

Fig. 1
Fig. 1
Schematic illustration of the combined application of chemotherapy, immunotherapy, and PD-L1 blockade therapy in tumor-bearing mice. CpG, immunopotentiator; CQ, chloroquine, DC, dendritic cell; HS15, Solutol HS15®; OVA, ovalbumin; PEI-OA, polyethyleneimine-oleic acid polymer; PTX, paclitaxel
Fig. 2
Fig. 2
Construction and characterization of multifunctional nanoparticles (MNPs). a Chemical structure of the polyethyleneimine-oleic acid (PEI-OA) polymer. b Nanoparticles 1 were prepared by the thin-film hydration method. Encapsulation of an immunopotentiator (CpG) and ovalbumin (OVA) into 1 by electrostatic interactions, followed by surface coating with atezolizumab and chondroitin sulfate generated nanoparticles 3. c Transmission electron micrographs (TEM) of nanoparticles 1–3. Scale bar, 200 nm. d Confocal microscopic images of DiD-N/A, FAM-CpG-N/A, and DiD+FAM-CpG-N/A. Scale bar, 200 nm. e Agarose gel electrophoresis of DiD+FAM-CpG-N/A. f Western blot analysis of DiD-N/A, FITC-OVA-N/A, and DiD+FITC-OVA-N/A. Free FITC-OVA solution was used as control. g Flow cytometry of DiD-N/A, FITC-OVA-N/A, and DiD+FITC-OVA-N/A. h Representative size distribution of nanoparticles 3, as determined by dynamic light scattering. i Size, polydispersity index (PDI), and zeta potential of nanoparticles 1–3. Data are shown as mean ± SD (n = 4). DiD, 4-chlorobenzenesulfonate salt; FAM, fluorescein amidite; FITC, fluorescein; N, nanoparticles; S, solution
Fig. 3
Fig. 3
In vitro characterization of multifunctional nanoparticles (MNPs). a Confocal microscopy images of 4T1 cells incubated with various formulations for 2 and 4 h. Scale bar, 100 nm. b, c Number of b DiD-positive and c FITC-positive 4T1 cells after incubation with DiD+FITC-OVA-N/A and DiD+FITC-OVA-S for 2 and 4 h (DiD, 1 μg/mL). Student’s t-test was performed. *P < 0.05. d Cell viability of 4T1 cells after incubation with different formulations for 24 h, as determined by the MTT assay. Blank nanoparticles were used as control. e Apoptosis of 4T1 cells stained with FITC-Annexin V and propidium iodide (PI) after incubation with different formulations for 24 h. f Percentage of cells in the apoptotic or necrotic stage after treatment with different formulations. Data are shown as mean ± SD (n = 3). Cells without any treatment were set as control group. CpG, immunopotentiator; CQ, chloroquine; DAPI, 4′,6-diamidino-2-phenylindole; DiD, 4-chlorobenzenesulfonate salt; FAM, fluorescein amidite; FITC, fluorescein; N, nanoparticles, N/A, nanoparticles coated with atezolizumab; OVA, ovalbumin; PTX, paclitaxel; S, solution
Fig. 4
Fig. 4
Effect of multifunctional nanoparticles on autophagosome formation. a Signals of LC3B puncta detected in 4T1 cells cultured in RPMI-1640 medium with different formulations for 4 h (a 5% glucose solution was used as control), as determined by immunofluorescence assay with an anti-LC3B antibody, followed by confocal microscopy. LC3B-positive puncta were detected in the cytoplasm by fluorescein-conjugated ImmunoPure goat anti-rabbit IgG (green). Cell nuclei were stained with 4′,6-diamidino-2-phenylindole (DAPI). Enlarged boxes highlight LC3B signals. Scale bar: 5 μm. b Number of LC3B-positive puncta per cell quantified from ~20 cells treated with different formulations. The means ± SD are from 3 independent experiments. One-way ANOVA was performed. *P < 0.05; **P < 0.01. (n = 3 independent experiments.) c Transmission electron micrographs of autophagosomes in the cytoplasm of HeLa cells treated with CpG+OVA+PTX-N/A. Scale bar, 500 nm. d Confocal microscopy images of HeLa cells transfected with the autophagy dual fluorescent reporter mCherry-GFP-LC3B and cultured with different formulations in Dulbecco’s modified Eagle medium for 4 h. Scale bar: 5 μm. e Number of autophagosomes and autolysosomes in HeLa cells treated with different formulations (>15 cells/experiment). Co-localized dots were counted. Data are presented as means ± SD. * P < 0.05, ** P<0.01 (n = 3 independent experiments). f Representative Western blots for LC3B-II and SQSTM1. g Relative protein levels of LC3B-II and SQSTM1, normalized to levels of GAPDH. Cells without any treatment were set as the control group. Data are shown as mean ± SD (n = 3). *P < 0.05, **P < 0.01. CpG, immunopotentiator; CQ, chloroquine; N, nanoparticles; N/A, nanoparticles coated with atezolizumab; OVA, ovalbumin; PTX, paclitaxel; S, solution
Fig. 5
Fig. 5
In vivo targeted delivery of multifunctional nanoparticles (MNPs). a Fluorescence imaging of 4T1 breast tumor-bearing mice at 2, 4, 8, 24, and 48 h post-administration of DiD-loaded MNPs (N) or a solution of free DiD (S). b Nanoparticle distribution in tumors and major organs at 48 h post-injection of DiD-loaded MNPs (N) or a solution of free DiD (S). c Semiquantitation of total radiant efficiency in isolated tumors and major organs at 48 h post-injection of DiD-loaded MNPs (N) or a solution of free DiD (S). Data are shown as mean ± SD (n = 3). Student’s t-test was performed. *P < 0.05. d, e Confocal imaging of frozen tumor sections. Tumor cells were stained with d anti-CD44 antibody (green) or e anti-PD-L1 antibody (green). Cell nuclei were stained with 4′,6-diamidino-2-phenylindole (DAPI; blue). Red fluorescence (DiD) indicated MNPs. Mice injected with 5% glucose solution were set as control group. CQ, chloroquine; DiD, 4-chlorobenzenesulfonate salt
Fig. 6
Fig. 6
In vivo antitumor efficacy of multifunctional nanoparticles in 4T1 breast tumor-bearing Balb/c mice. a Establishment of a subcutaneous 4T1 breast cancer model of Balb/c mice. A 5% glucose solution was used as control. b Change in tumor volume over time after treatment with different formulations. Data are shown as mean ± SD (n = 5). c Weight of excised tumors after the completion of the experiment. Data are shown as mean ± SD (n = 5). d Body weight of 4T1-bearing mice treated with different formulations for up to 15 days. Data are shown as mean ± SD (n = 5). e Survival rates of mice over time after treatment with different formulations. Data are shown as mean ± SD (n = 10). f Tumor sections collected on day 15 after the indicated treatments and visualized by TUNEL labeling. Scale bar, 50 μm. Student’s t-test was performed. *P < 0.05 vs control. Mice injected with 5% glucose solution were set as control group. CpG, immunopotentiator; CQ, chloroquine; DAPI, 4′,6-diamidino-2-phenylindole; N, nanoparticles; N/A, nanoparticles coated with atezolizumab; OVA, ovalbumin; PTX, paclitaxel; S, solution; TUNEL, terminal deoxynucleotidyl transferase dUTP nick end-labeling
Fig. 7
Fig. 7
Autophagy inhibition in the tumor enhances the anticancer activity of MNPs. a LC3B-positive puncta, as detected by immunofluorescence assay with an anti-LC3B antibody, followed by confocal microscopy. Cell nuclei were stained with 4′,6-diamidino-2-phenylindole (DAPI; blue). Scale bar, 20 μm. b Number of LC3B-positive puncta per cell quantified from ~20 cells treated with different formulations. c Representative Western blots for SQSTM1 and LC3B-II. d Relative protein levels of LC3B-II and SQSTM1, normalized to levels of GAPDH. Data are shown as mean ± SD (n = 3). One-way ANOVA was performed. *P < 0.05, **P < 0.01. Mice injected with 5% glucose solution were set as the control group. CpG, immunopotentiator; CQ, chloroquine; N, nanoparticles; N/A, nanoparticles coated with atezolizumab; OVA, ovalbumin; PTX, paclitaxel; S, solution
Fig. 8
Fig. 8
CpG+OVA+PTX+CQ-N/A induce antitumor immune responses in vivo. a Levels of CD8+ and CD4+ T cells, as determined by flow cytometry on day 15 after the indicated treatments. b Representative flow cytometric plots of CD8+ and CD4+ T cells in tumors. c, d Immunohistochemistry on tumor biopsies. Brown regions indicate the presence of c CD8+ T cells and d CD4+ T cells. Scale bar, 100 μm. e, f Levels of e CD8+ T cells and f CD4+ T cells in the spleen of tumor-bearing mice, as determined by flow cytometry on day 15 after the indicated treatments. g Representative flow cytometric plots of CD8+ and CD4+ T cells in the spleen. h Immunohistochemical staining of the spleen. Brown regions indicate the presence of CD8+ T cells. Scale bar, 100 μm. i, j Serum levels of i tumor necrosis factor-α (TNF-α) and j interferon-γ (IFN-γ) on day 15 after the indicated treatments. Data are shown as ± SD (n = 5). One-way ANOVA was performed. *P < 0.05. CpG, immunopotentiator; CQ, chloroquine; N, nanoparticles; N/A, nanoparticles coated with atezolizumab; OVA, ovalbumin; PTX, paclitaxel; S, solution

Similar articles

Cited by

References

    1. Kuang J, Song W, Yin J, Zeng X, Han S, Zhao YP, et al. iRGD modified chemo-immunotherapeutic nanoparticles for enhanced immunotherapy against glioblastoma. Adv Func Mater. 2018;28:1800025.
    1. Du H, Zhao S, Wang Y, Wang Z, Chen B, Yan Y, et al. pH/Cathepsin B hierarchical-responsive nanoconjugates for enhanced tumor penetration and chemo-immunotherapy. Adv Funct Mater. 2020;30:2003757.
    1. Wang H, Liang Y, Yin Y, Zhang J, Su W, White AM, et al. Carbon nano-onion-mediated dual targeting of P-selectin and P-glycoprotein to overcome cancer drug resistance. Nat Commun. 2021;12:312. - PMC - PubMed
    1. Song C, Phuengkham H, Kim YS, Dinh VV, Lee I, Shin IW, et al. Syringeable immunotherapeutic nanogel reshapes tumor microenvironment and prevents tumor metastasis and recurrence. Nat Commun. 2019;10:3745. - PMC - PubMed
    1. Deng C, Zhang Q, Jia M, Zhao J, Sun X, Gong T, et al. Tumors and their microenvironment dual-targeting chemotherapy with local immune adjuvant therapy for effective antitumor immunity against breast cancer. Adv Sci. 2019;6:1801868. - PMC - PubMed

Publication types