. 2022 Oct 28;15(1):117.
doi: 10.1186/s13048-022-01051-8.

Alterations of bacteriome, mycobiome and metabolome characteristics in PCOS patients with normal/overweight individuals

Affiliations

Alterations of bacteriome, mycobiome and metabolome characteristics in PCOS patients with normal/overweight individuals

Guoshu Yin et al. J Ovarian Res. .

Abstract

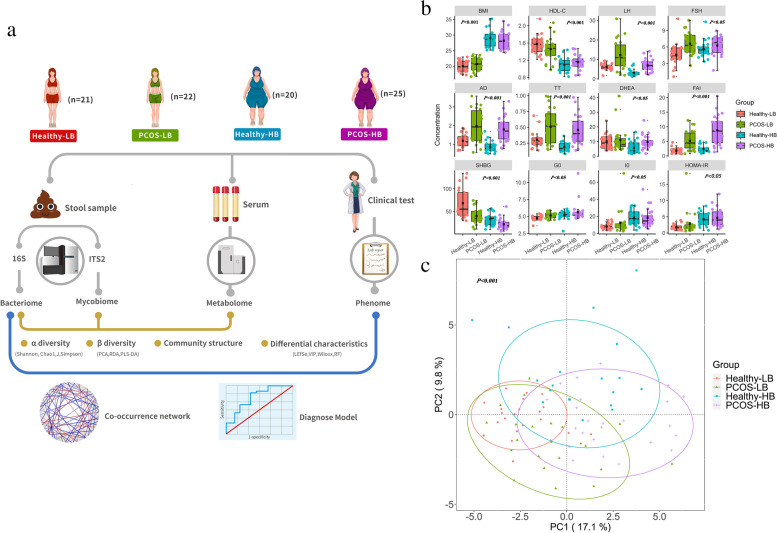
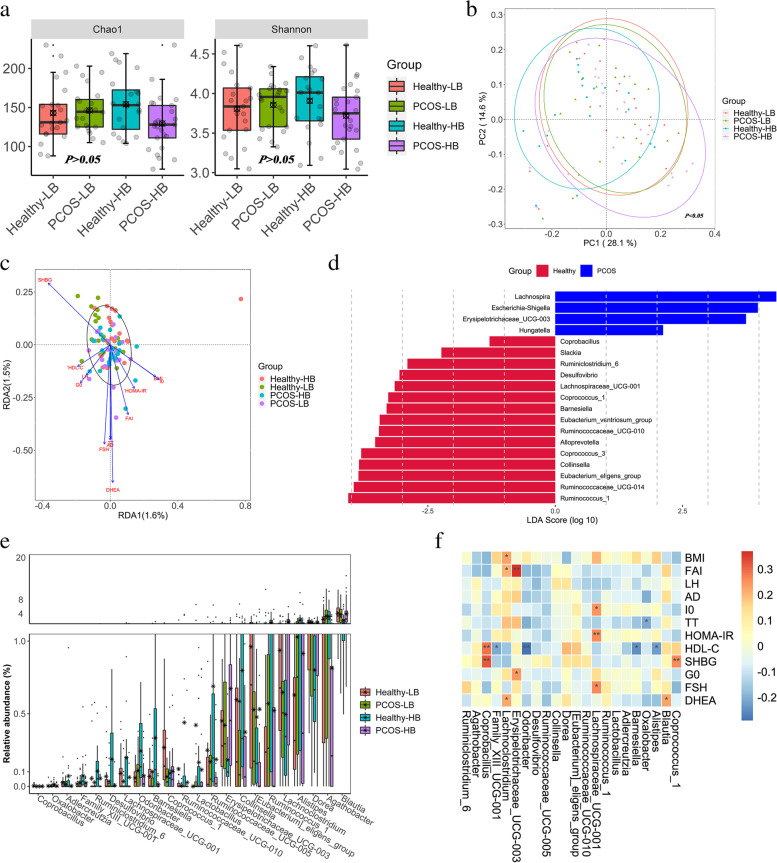
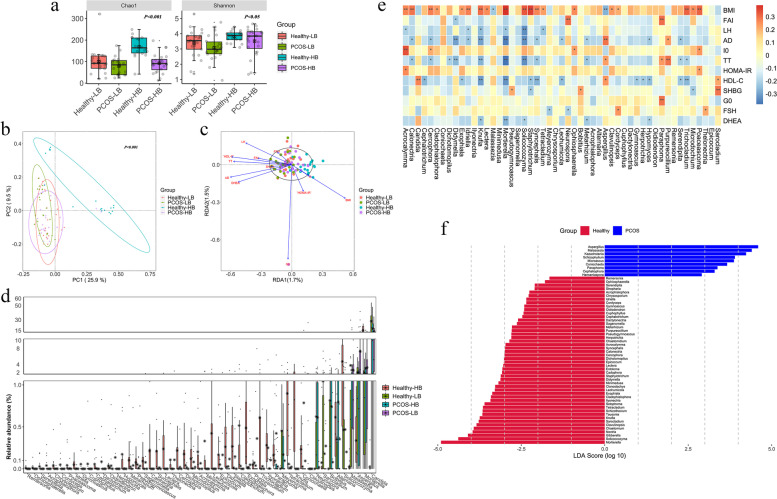
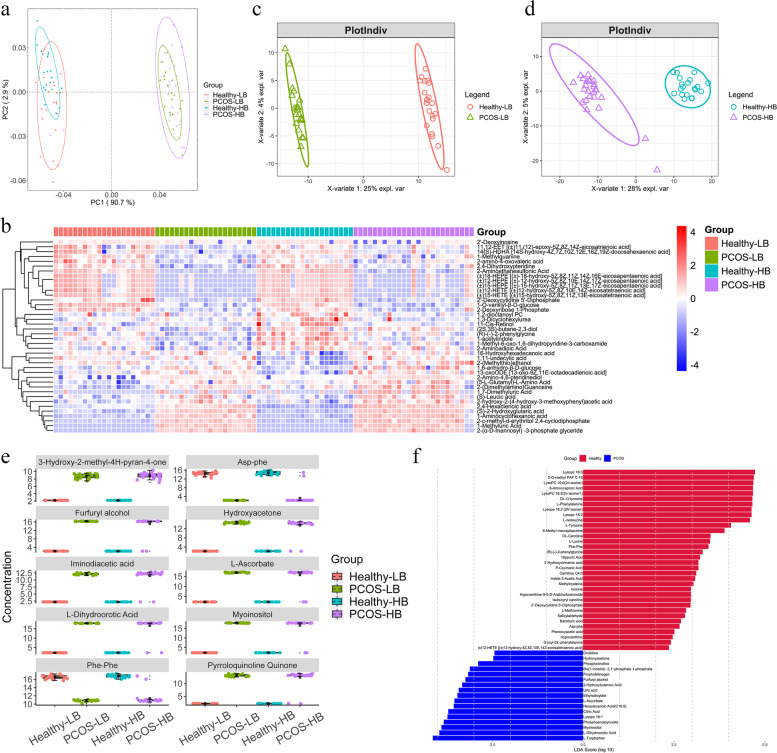
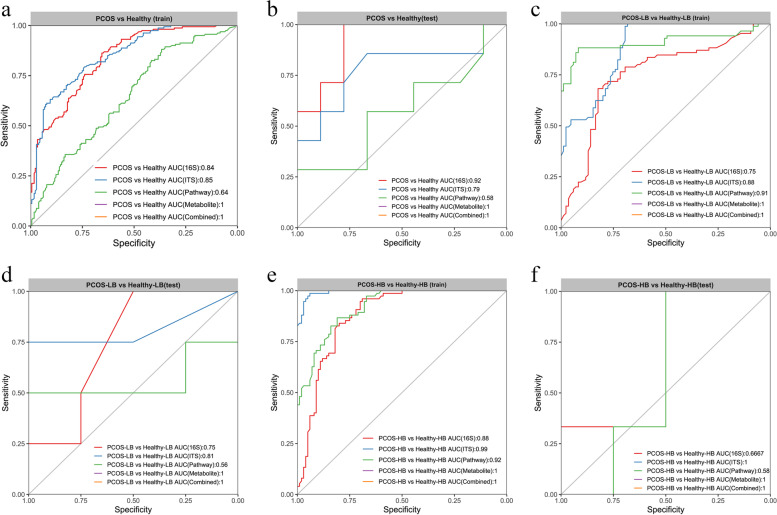
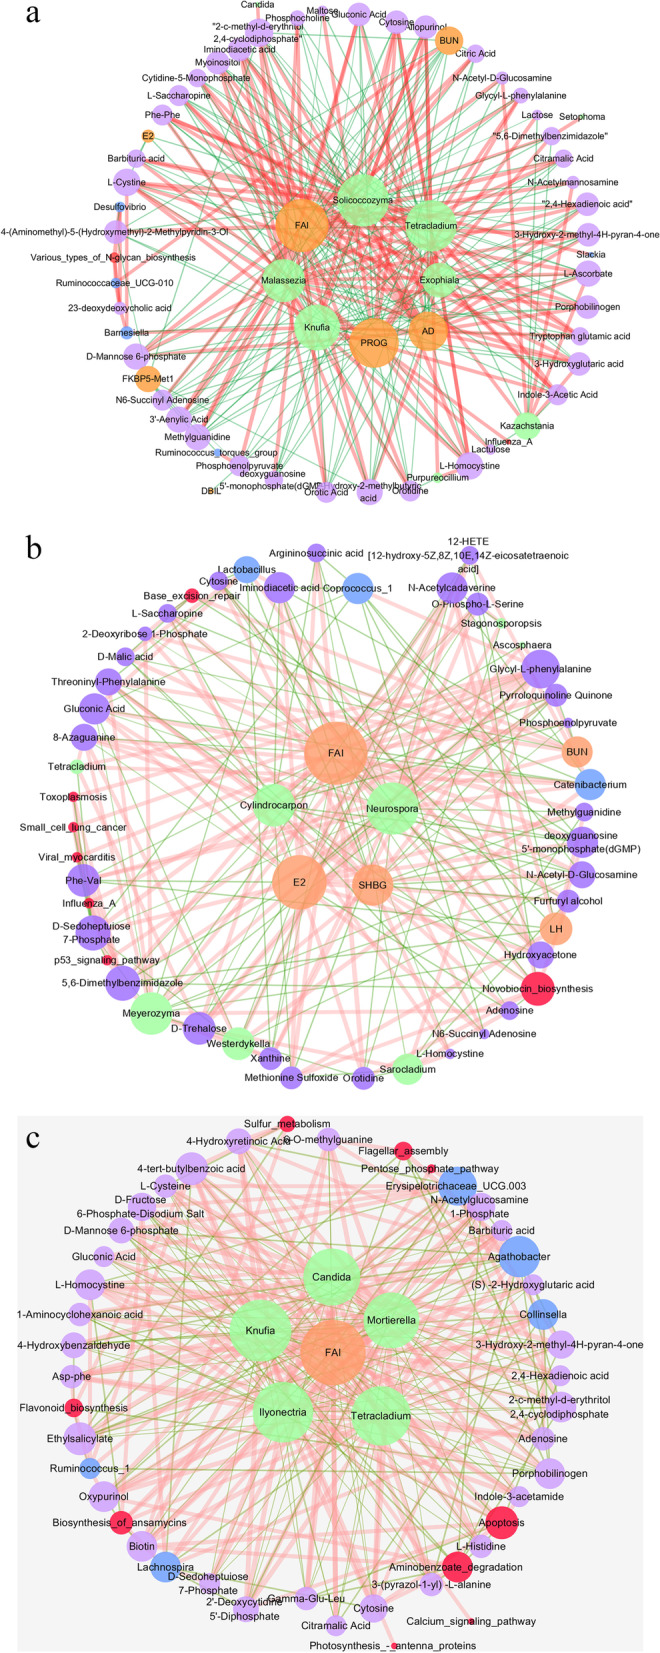
To characterize the gut bacteriome, mycobiome and serum metabolome profiles in polycystic ovary syndrome (PCOS) patients with normal/overweight individuals and evaluate a potential microbiota-related diagnostic method development for PCOS, 16S rRNA and ITS2 gene sequencing using 88 fecal samples and 87 metabolome analysis from serum samples are conducted and PCOS classifiers based on multiomics markers are constructed. There are significant bacterial, fungal community and metabolite differences among PCOS patients and healthy volunteers with normal/overweight individuals. Healthy individuals with overweight/obesity display less abnormal metabolism than PCOS patients and uniquely higher abundance of the fungal genus Mortierella. Nine bacterial genera, 4 predicted pathways, 11 fungal genera and top 30 metabolites are screened out which distinguish PCOS from healthy controls, with AUCs of 0.84, 0.64, 0.85 and 1, respectively. The metabolite-derived model is more accurate than the microbe-based model in discriminating normal BMI PCOS (PCOS-LB) from normal BMI healthy (Healthy-LB), PCOS-HB from Healthy-HB. Featured bacteria, fungi, predicted pathways and serum metabolites display higher associations with free androgen index (FAI) in the cooccurrence network. In conclusion, our data reveal that hyperandrogenemia plays a central role in the dysbiosis of intestinal microecology and the change in metabolic status in patients with PCOS and that its effect exceeds the role of BMI. Healthy women with high BMI showed unique microbiota and metabolic features.The priority of predictive models in discriminating PCOS from healthy status in this study were serum metabolites, fungal taxa and bacterial taxa.

Keywords: Diagnostic model; Metabolome; Mycobiome; Obesity; PCOS.


Conflict of interest statement

The authors declare no conflict of interest.

Figures

Fig. 1
Fig. 1
Clinical parameter distribution. a Overview of the study design. b Differences in clinical index. Data are shown as the mean ± SD, and an error bar is shown. p values denote the significance among groups. Letters indicate ANOVA grouping. c Differences in clinical index structures as revealed by principal co-ordinates analysis (PCoA)
Fig. 2
Fig. 2
Fecal bacterial characteristic variations associated with PCOS. a α diversity. p values denote the significance among groups. Letters indicate ANOVA grouping. b Differences in bacterial structures as revealed by PCoA analysis. c RDA analyses reflecting differences in gut microbiota structures fitted with significantly correlated clinical properties. d Characteristic bacterial taxa based on LDA effect size (LEfSe) analysis between PCOS patients and healthy individuals. e The distinguished bacterial genera screened by Kruskal–Wallis tests. f The heatmap depicts the relationship between distinguished bacterial genera (screened by Kruskal–Wallis tests) and key clinical parameters
Fig. 3
Fig. 3
Fecal fungal characteristic variations associated with PCOS. a α diversity measured by Chao1 and Shannon indices was highest in Healthy-HB. p values denote the significance among groups. Letters indicate ANOVA grouping. b Differences in fungal structures among Healthy-LB, Healthy-HB, PCOS-HB and PCOS-LB, as revealed by PCoA analysis. c RDA analyses reflecting differences in gut fungal structures fitted with significantly correlated clinical properties. d Distinguished fungal genera screened by Kruskal–Wallis tests. e Correlation between distinguished fungal genera and key clinical parameters. f Characteristic fungal taxa based on LDA effect size (LEfSe) analysis between PCOS patients and healthy individuals
Fig. 4
Fig. 4
Serum metabolite variations associated with PCOS. a Differences in fungal structures as revealed by PCoA analysis. b Heatmap showing the relative abundance of the 40 metabolites screened by Kruskal–Wallis tests. c PLS-DA plot revealing the differential metabolite pattern between Healthy-LB and PCOS-LB. d PLS-DA plot revealing the differential metabolite pattern between Healthy-HB and PCOS-HB. e The distribution of the top 10 metabolites as VIP values ranked as shared by comparison between Healthy-LB and PCOS-LB and between Healthy-HB and PCOS-HB. f Characteristic metabolites based on LDA effect size (LEfSe) analysis between PCOS patients and healthy controls
Fig. 5
Fig. 5
Disease status classification using disease-associated taxa and/or metabolites. (a, c, e) Random forest classifiers were constructed to discriminate PCOS and healthy, PCOS-LB and Healthy-LB, PCOS-HB and Healthy-HB, respectively, in the training dataset. (b, d, f) Random forest classifiers composed of bacterial and fungal genera, metabolites, predicted pathways and their combinations were constructed to discriminate PCOS and healthy, PCOS-LB and Healthy-LB, PCOS-HB and Healthy-HB in the test dataset. ROC, receiver operating characteristic curve. AUC, area under the curve. The input features were excavated on the basis of Wilcox test comparison and the mean decrease in Gini by random forest importance parameters. Data were assigned to training (80%) and test (20%) datasets after the whole dataset was shuffled
Fig. 6
Fig. 6
Integrative co-occurrence network reflecting multiomic-phenotype interactions. (a,b,c) Network revealed both significant (p < 0.05) and suggestive correlations (∣r∣ > 0.4, Spearman analysis) between differentially abundant bacterial, fungal, predicted pathway, metabolites and clinical indices in PCOS and healthy, PCOS-LB and Healthy-LB, PCOS-HB and Healthy-HB. Nodes represent characteristics. Purple, blue, red, green and yellow nodes denote metabolites, bacterial taxa, predicted pathways, fungal taxa and clinical parameters. Lines connecting nodes indicate positive (red) or negative (green) correlations

References

    1. Escobar-Morreale HF. Polycystic ovary syndrome: definition, aetiology, diagnosis and treatment. Nat Rev Endocrinol. 2018;14(5):270–284. - PubMed
    1. Chen F, Liao Y, Chen M, Yin H, Chen G, Huang Q, et al. Evaluation of the Efficacy of Sex Hormone-Binding Globulin in Insulin Resistance Assessment Based on HOMA-IR in Patients with PCOS. Reprod Sci. 2021;28(9):2504–2513. - PubMed
    1. Zhu T, Cui J, Goodarzi MO. Polycystic Ovary Syndrome and Risk of Type 2 Diabetes, Coronary Heart Disease, and Stroke. Diabetes. 2021;70(2):627–637. - PubMed
    1. Vallianou N, Stratigou T, Christodoulatos GS, Dalamaga M. Understanding the Role of the Gut Microbiome and Microbial Metabolites in Obesity and Obesity-Associated Metabolic Disorders: Current Evidence and Perspectives. Curr Obes Rep. 2019;8(3):317–332. - PubMed
    1. Hartstra AV, Bouter KE, Bäckhed F, Nieuwdorp M. Insights into the role of the microbiome in obesity and type 2 diabetes. Diabetes Care. 2015;38(1):159–165. - PubMed

Substances