

Aerosol physicochemical determinants of carbon black and ozone inhalation co-exposure induced pulmonary toxicity
- PMID: 36303316
- PMCID: PMC9887725
- DOI: 10.1093/toxsci/kfac113
Aerosol physicochemical determinants of carbon black and ozone inhalation co-exposure induced pulmonary toxicity
Abstract
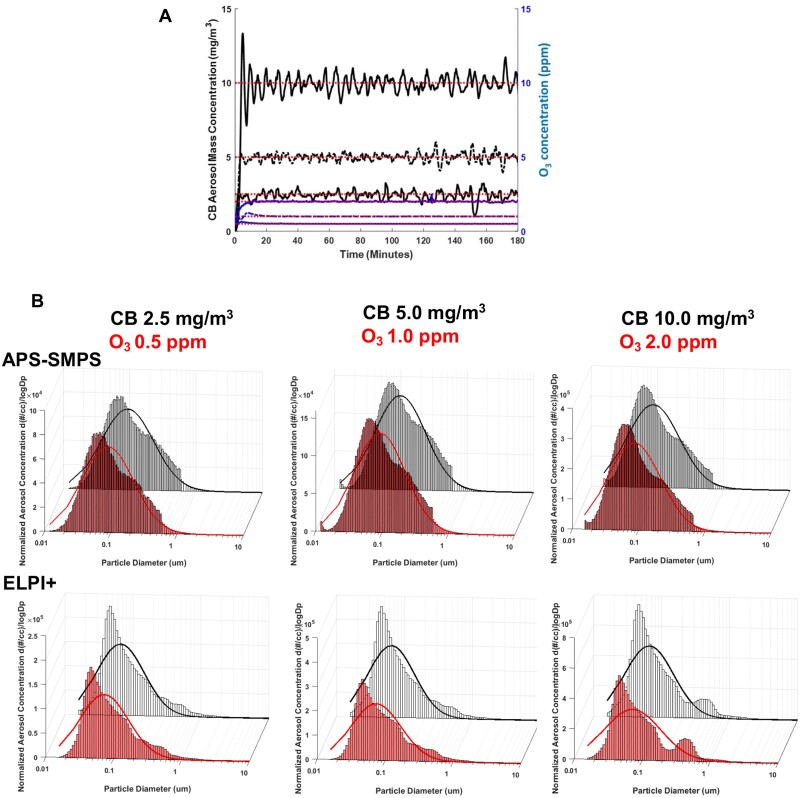
Air pollution accounts for more than 7 million premature deaths worldwide. Using ultrafine carbon black (CB) and ozone (O3) as a model for an environmental co-exposure scenario, the dose response relationships in acute pulmonary injury and inflammation were determined by generating, characterizing, and comparing stable concentrations of CB aerosols (2.5, 5.0, 10.0 mg/m3), O3 (0.5, 1.0, 2.0 ppm) with mixture CB + O3 (2.5 + 0.5, 5.0 + 1.0, 10.0 + 2.0). C57BL6 male mice were exposed for 3 h by whole body inhalation and acute toxicity determined after 24 h. CB itself did not cause any alteration, however, a dose response in pulmonary injury/inflammation was observed with O3 and CB + O3. This increase in response with mixtures was not dependent on the uptake but was due to enhanced reactivity of the particles. Benchmark dose modeling showed several-fold increase in potency with CB + O3 compared with CB or O3 alone. Principal component analysis provided insight into response relationships between various doses and treatments. There was a significant correlation in lung responses with charge-based size distribution, total/alveolar deposition, oxidant generation, and antioxidant depletion potential. Lung tissue gene/protein response demonstrated distinct patterns that are better predicted by either particle dose/aerosol responses (interleukin-1β, keratinocyte chemoattractant, transforming growth factor beta) or particle reactivity (thymic stromal lymphopoietin, interleukin-13, interleukin-6). Hierarchical clustering showed a distinct signature with high dose and a similarity in mRNA expression pattern of low and medium doses of CB + O3. In conclusion, we demonstrate that the biological outcomes from CB + O3 co-exposure are significantly greater than individual exposures over a range of aerosol concentrations and aerosol characteristics can predict biological outcome.
Keywords: co-exposure; inflammation; inhalation; ozone; physicochemical properties; ultrafine carbon black.
© The Author(s) 2022. Published by Oxford University Press on behalf of the Society of Toxicology. All rights reserved. For permissions, please e-mail: journals.permissions@oup.com.
Figures


Similar articles
-
Lung-gut axis of microbiome alterations following co-exposure to ultrafine carbon black and ozone.Part Fibre Toxicol. 2023 Apr 21;20(1):15. doi: 10.1186/s12989-023-00528-8. Part Fibre Toxicol. 2023. PMID: 37085867 Free PMC article.
-
Transcriptomics of single dose and repeated carbon black and ozone inhalation co-exposure highlight progressive pulmonary mitochondrial dysfunction.Part Fibre Toxicol. 2021 Dec 15;18(1):44. doi: 10.1186/s12989-021-00437-8. Part Fibre Toxicol. 2021. PMID: 34911549 Free PMC article.
-
Oxidant-induced epithelial alarmin pathway mediates lung inflammation and functional decline following ultrafine carbon and ozone inhalation co-exposure.Redox Biol. 2021 Oct;46:102092. doi: 10.1016/j.redox.2021.102092. Epub 2021 Aug 5. Redox Biol. 2021. PMID: 34418598 Free PMC article.
-
Significance of particle parameters in the evaluation of exposure-dose-response relationships of inhaled particles.Inhal Toxicol. 1996;8 Suppl:73-89. Inhal Toxicol. 1996. PMID: 11542496 Review.
-
Ozone-induced lung injury and inflammation: Pathways and therapeutic targets for pulmonary diseases caused by air pollutants.Environ Int. 2025 Apr;198:109391. doi: 10.1016/j.envint.2025.109391. Epub 2025 Mar 20. Environ Int. 2025. PMID: 40121788 Review.
Cited by
-
Maternal use of electronic cigarettes and impact on offspring: a double-hit model.J Appl Physiol (1985). 2024 Sep 1;137(3):690-704. doi: 10.1152/japplphysiol.00345.2024. Epub 2024 Aug 1. J Appl Physiol (1985). 2024. PMID: 39088647 Free PMC article.
-
Air Pollution and Effects of Tropospheric Ozone (O3) on Public Health.Int J Environ Res Public Health. 2025 Apr 30;22(5):709. doi: 10.3390/ijerph22050709. Int J Environ Res Public Health. 2025. PMID: 40427825 Free PMC article. Review.
-
Titanium Dioxide Nanoparticle Exposure Provokes Greater Lung Inflammation in Females Than Males in the Context of Obesity.Int J Nanomedicine. 2025 Apr 24;20:5321-5336. doi: 10.2147/IJN.S508676. eCollection 2025. Int J Nanomedicine. 2025. PMID: 40297406 Free PMC article.
-
Lung-gut axis of microbiome alterations following co-exposure to ultrafine carbon black and ozone.Part Fibre Toxicol. 2023 Apr 21;20(1):15. doi: 10.1186/s12989-023-00528-8. Part Fibre Toxicol. 2023. PMID: 37085867 Free PMC article.
-
Effects of Ambient O3 on Respiratory Mortality, Especially the Combined Effects of PM2.5 and O3.Toxics. 2023 Oct 30;11(11):892. doi: 10.3390/toxics11110892. Toxics. 2023. PMID: 37999544 Free PMC article.
References
-
- Ambroz A., Vlkova V., Rossner P. Jr., Rossnerova A., Svecova V., Milcova A., Pulkrabova J., Hajslova J., Veleminsky M. Jr., Solansky I., et al. (2016). Impact of air pollution on oxidative DNA damage and lipid peroxidation in mothers and their newborns. Int. J. Hyg. Environ. Health 219, 545–556. - PubMed
-
- Anderson H. A., Englert R., Gursel I., Shacter E. (2002). Oxidative stress inhibits the phagocytosis of apoptotic cells that have externalized phosphatidylserine. Cell Death Differ. 9, 616–625. - PubMed
-
- Anenberg S. C., West J. J., Yu H. B., Chin M., Schulz M., Bergmann D., Bey I., Bian H. S., Diehl T., Fiore A., et al. (2014). Impacts of intercontinental transport of anthropogenic fine particulate matter on human mortality. Air Qual. Atmos. Health 7, 369–379.
-
- Apte J. S., Marshall J. D., Cohen A. J., Brauer M. (2015). Addressing global mortality from ambient PM2.5. Environ. Sci. Technol. 49, 8057–8066. - PubMed
-
- Birnbaum H. G., Carley C. D., Desai U., Ou S., Zuckerman P. R. (2020). Measuring the impact of air pollution on health care costs. Health Aff. (Millwood) 39, 2113–2119. - PubMed
Publication types
MeSH terms
Substances
Grants and funding
LinkOut - more resources
Full Text Sources
Medical
