. 2023 Nov;53(11):e2249816.
doi: 10.1002/eji.202249816. Epub 2022 Oct 27.

Guidelines for mouse and human DC generation

Affiliations

Guidelines for mouse and human DC generation

Manfred B Lutz et al. Eur J Immunol. 2023 Nov.

Abstract

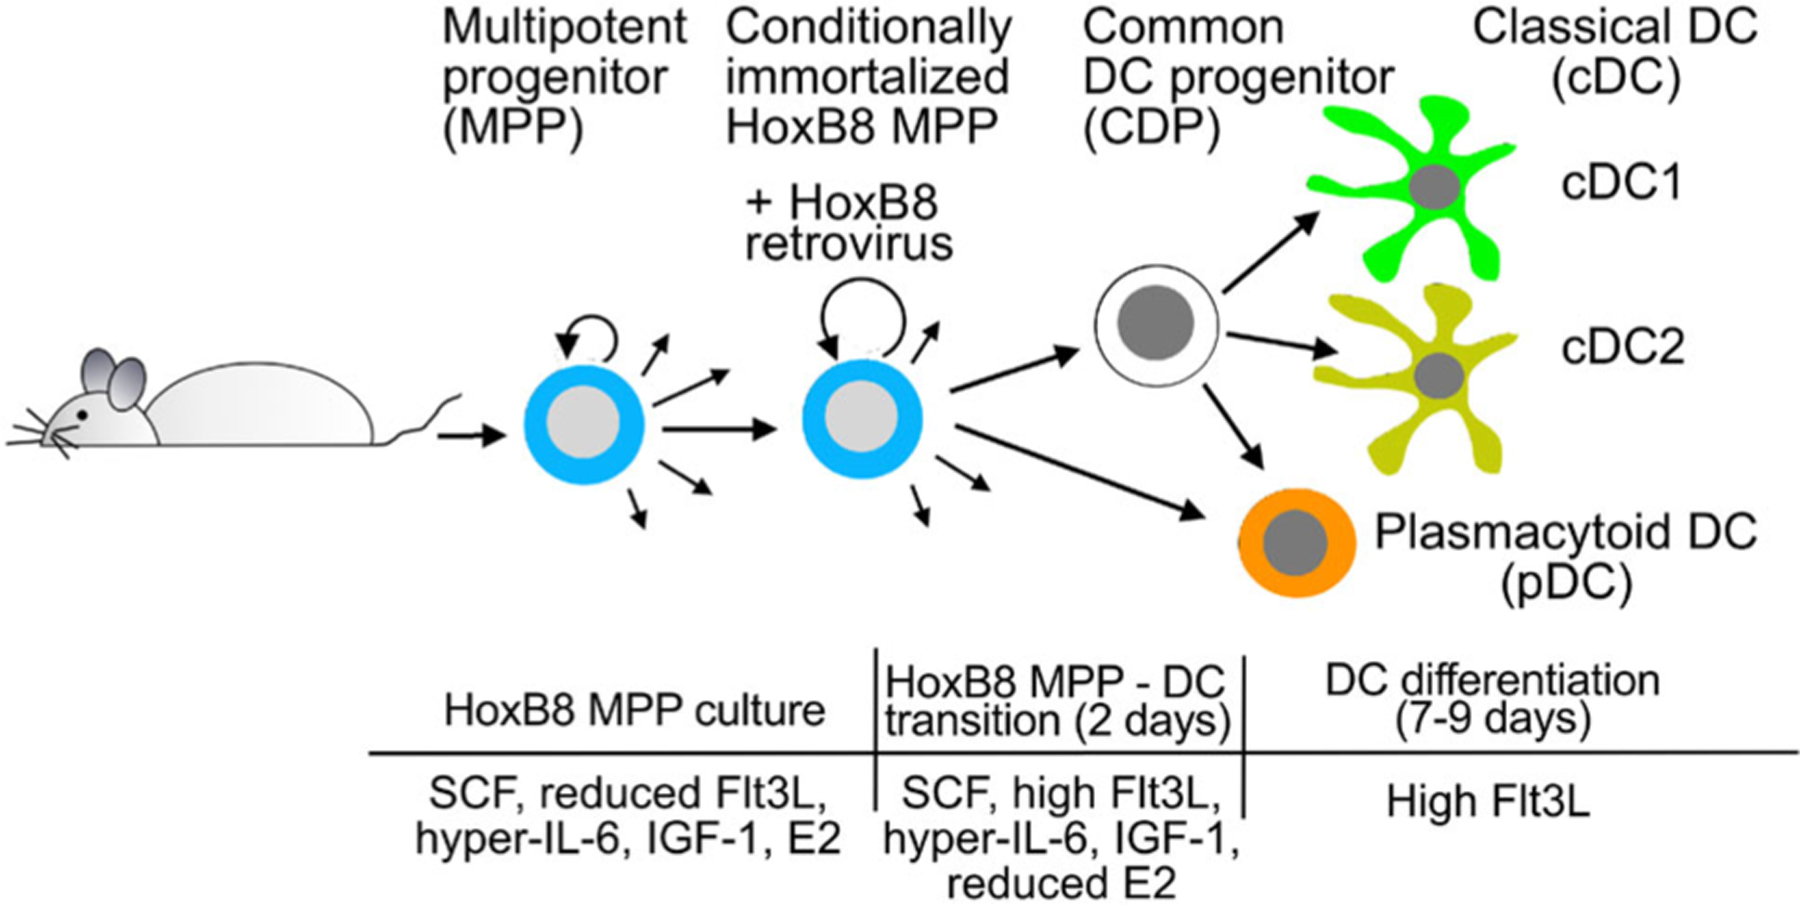
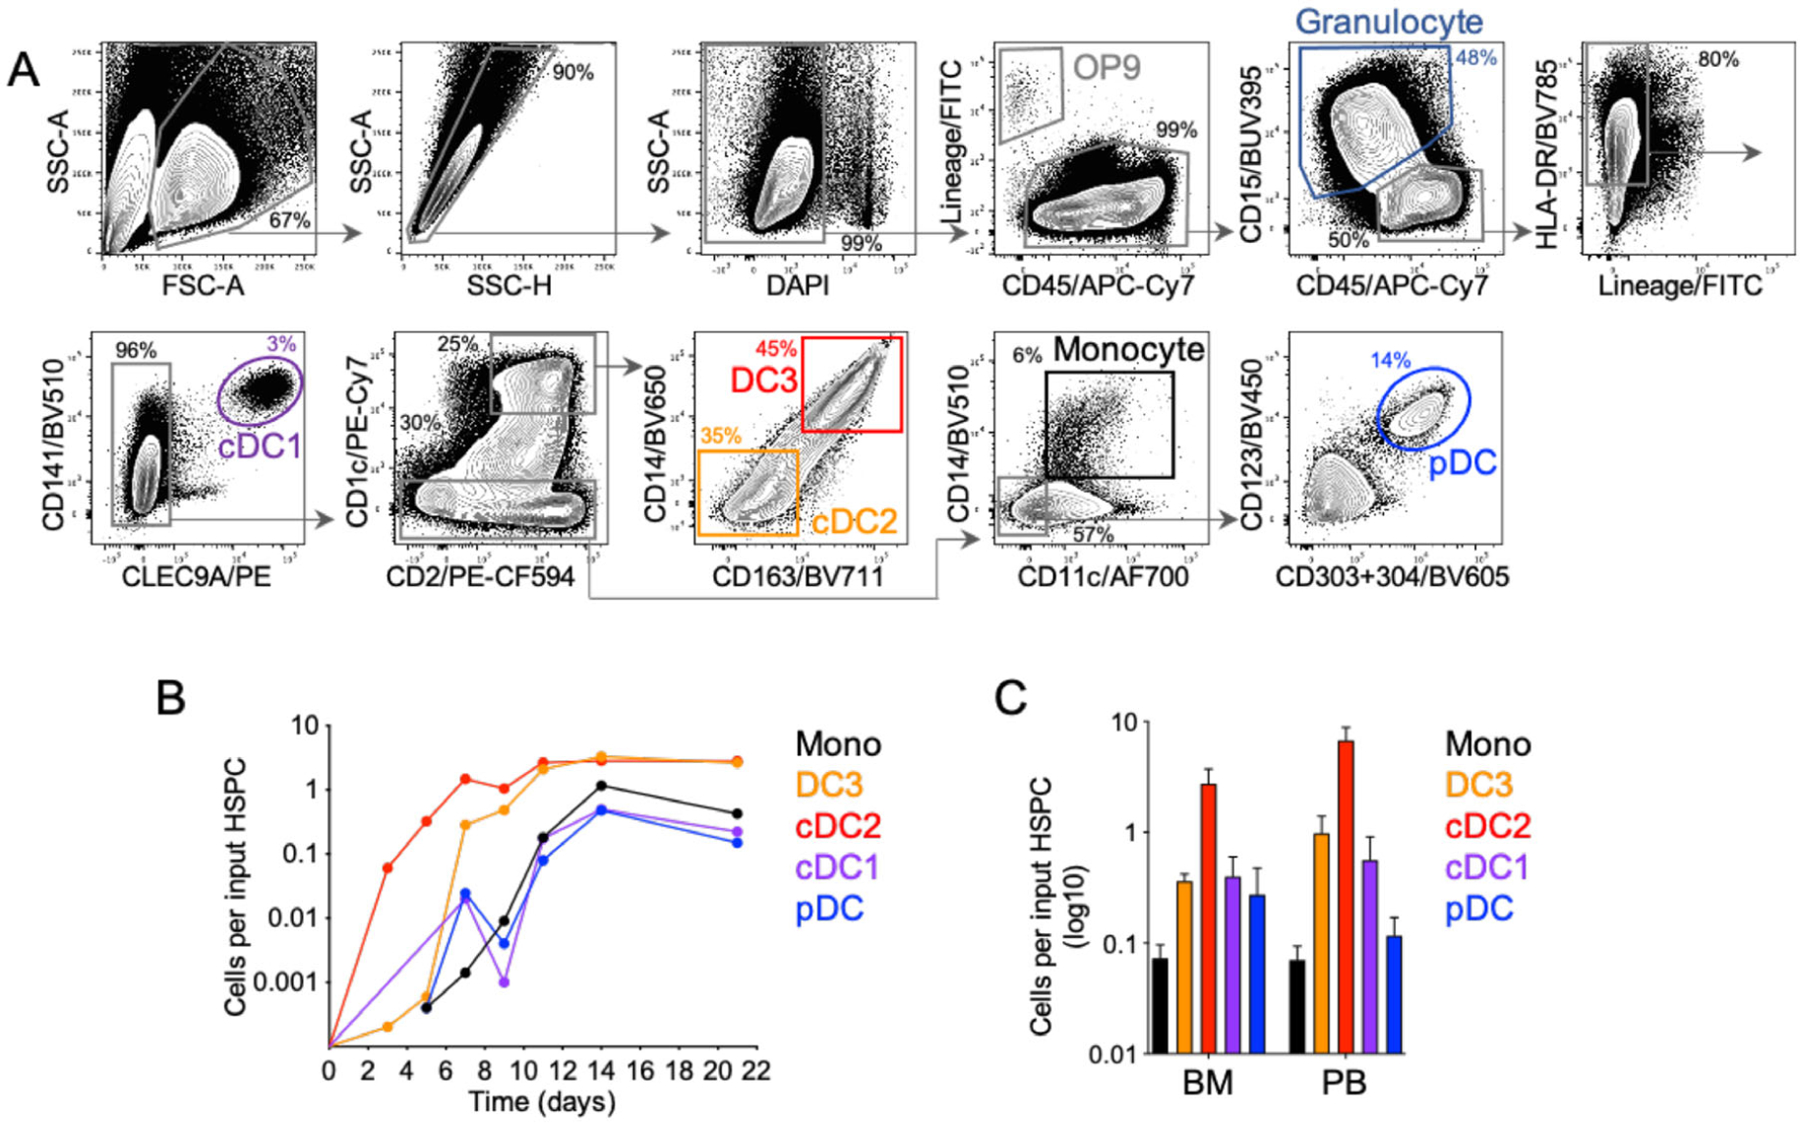
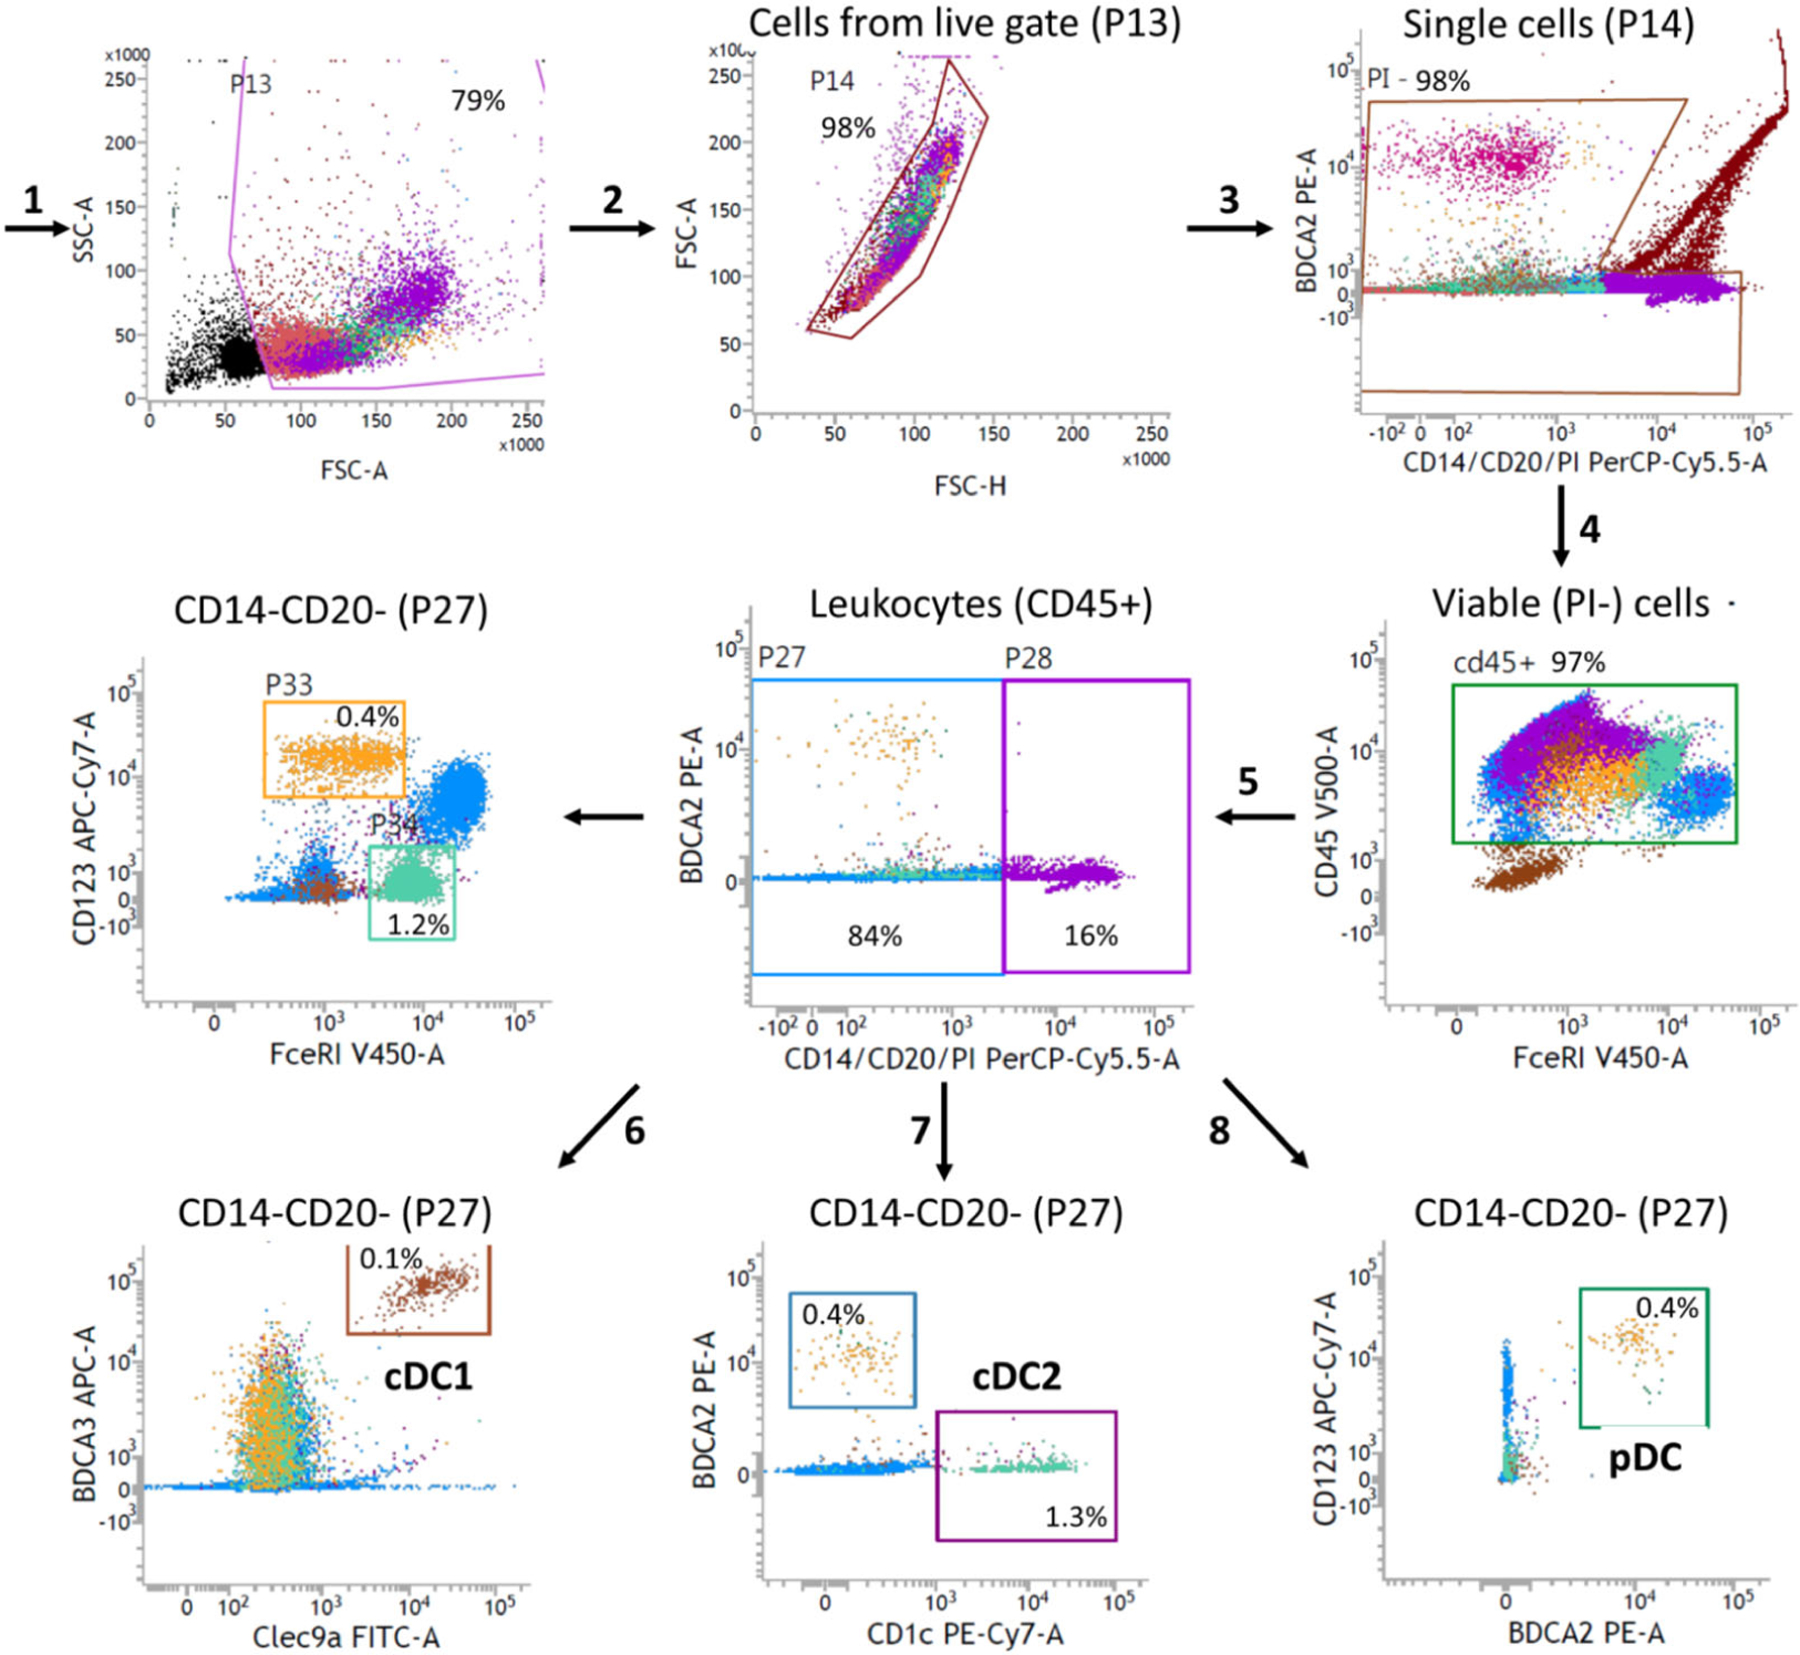
This article is part of the Dendritic Cell Guidelines article series, which provides a collection of state-of-the-art protocols for the preparation, phenotype analysis by flow cytometry, generation, fluorescence microscopy, and functional characterization of mouse and human dendritic cells (DC) from lymphoid organs and various non-lymphoid tissues. This article provides protocols with top ticks and pitfalls for preparation and successful generation of mouse and human DC from different cellular sources, such as murine BM and HoxB8 cells, as well as human CD34+ cells from cord blood, BM, and peripheral blood or peripheral blood monocytes. We describe murine cDC1, cDC2, and pDC generation with Flt3L and the generation of BM-derived DC with GM-CSF. Protocols for human DC generation focus on CD34+ cell culture on OP9 cell layers for cDC1, cDC2, cDC3, and pDC subset generation and DC generation from peripheral blood monocytes (MoDC). Additional protocols include enrichment of murine DC subsets, CRISPR/Cas9 editing, and clinical grade human DC generation. While all protocols were written by experienced scientists who routinely use them in their work, this article was also peer-reviewed by leading experts and approved by all co-authors, making it an essential resource for basic and clinical DC immunologists.

Keywords: Dendritic cells; Generation; In vitro; Isolation.


Conflict of interest statement

Conflict of interest: The authors declare no commercial or financial conflict of interest.

Figures

Figure 1.
Figure 1.
Schematic representation of HoxB8 cell generation and their differentiation into DC. Multipotent progenitors (MPP) from mouse BM are infected with HoxB8 retrovirus to yield conditionally immortalized HoxB8 MPP. HoxB8 MPP are grown with SCF, reduced Flt3L, IL-6/soluble IL-6 receptor fusion protein (hyper-IL-6), IGF-1, and β-estradiol (E2). HoxB8 MPP are induced to differentiate into DC via a HoxB8 MPP – DC transition phase with high Flt3L and reduced E2, and subsequent high Flt3L culture to obtain the cDC1, cDC2, and pDC subsets. Modified after [5].
Figure 2.
Figure 2.
Representative flow cytometry analysis of HoxB8 MPP. HoxB8 MPP were cultured in basic HoxB8 culture medium and subjected to flow cytometry analysis with specific antibodies. MPP: Gr1 CD117+ CD135; CDP: Gr1 CD117int/low CD135+ CD115+.
Figure 3.
Figure 3.
Schematic representation of HoxB8 MPP cloning by limiting dilution.
Figure 4.
Figure 4.
Schematic representation of HoxB8 MPP expansion after cloning by limiting dilution.
Figure 5.
Figure 5.
Representative flow cytometry analysis of HoxB8 MPP differentiation into CDP and DC subsets. (A) HoxB8 MPP are cultured in HoxB8 growth medium without E2 for 3 days and analyzed by flow cytometry (section 1.1.2.3.3, step 5). MPP: Gr1 CD117+ CD135; CDP: Gr1 CD117int/low CD135+ CD115+. (B) HoxB8 MPP are cultured in HoxB8 growth medium without E2 for 8 days and analyzed by flow cytometry (see below section 1.1.2.3.5.2, step 7). cDC1: Gr1 CD11c+ CD11blow/− XCR1+; cDC2: Gr1 CD11c+ CD11b+ XCR1; pDC: Gr1 CD11c+ CD11b B220+.
Figure 6.
Figure 6.
HoxB8 MPP differentiate into cDC1, cDC2, and pDC. HoxB8 MPP were differentiated into DC with Flt3L for 5 and 9 days (panels a and B, respectively) and analyzed by flow cytometry. cDC1: CD11c+ CD11blow/− XCR1+; cDC2: CD11c+ CD11b+ XCR1 and MHCIIlow/− B220+ pDC. Representative flow cytometry analysis is shown. MHCIIhigh B220 CD11c+ cDC and MHCIIlow/− B220+ pDC were separated and MHCIIhigh CD11c+ cDC were further divided into CD11blow/− XCR1+ cDC1 and CD11b+ XCR1 cDC2.
Figure 7.
Figure 7.
Representative phase contrast image of Flt3L-driven DC differentiation of HoxB8 MPP on days 0, 7, and 9. Scale bar: 200 μm.
Figure 8.
Figure 8.
Phase contrast microscopy images of BM-MoDC cultures with GM-CSF at day 8. (A) Cultures show cluster formation of proliferating progenitors and developing immature DC (arrows). (B) Cluster formation besides adherent macrophages, round cells with smooth surface presumably representing neutrophilic granulocytes, and immature DC appearing with few spine-like surface protrusions and mature DC with several protrusions. (C) Suspension cells representing spontaneously matured BM-MoDC with many veil-like surface protrusions.
Figure 9.
Figure 9.
GMP are the major expanding cell type in GM-CSF cultures. Fresh BM cells were labeled with the proliferation dye Cell Trace Violet (CTV) and either analyzed directly or after 3 days of GM-CSF culture by flow cytometry. (A) Gating strategy of GM-CSF cultured cells. Staining with Sca-1, c-kit (CD117) and CD16/32 allowed further gating for hematopoietic stem cells (HSC), common DC progenitors (CDP), granulocyte macrophage progenitors (GMP) or monocyte DC progenitors (MDP). Percentages of gates are indicated. (B) Example staining of CTV fluorescence after 3 days of GM-CSF culture indicates preferential GMP proliferation. CTV dilution was analyzed by FACS and GEO-MFI values are indicated. Dotted line separated proliferating from non-proliferating cells. (C) Frequencies of fresh BM or 3d GM-CSF cultured cells were calculated on the basis of FACS analyses and gated as in (A). n = 4 independent experiments. Insert shows rare HSC at a different scale.
Figure 10.
Figure 10.
Cultures of d8 GM-CSF BM cultures contain immature and spontaneously matured MoDC. Further maturation by LPS. (A) D8 GM-CSF BM cultures were analyzed by flow cytometry and gated according to FCS and SSC parameters as indicated and stained for MHC II and CD11c. (B) Cells were pre-gated as shown in (A). Upper row represent data from CD11c+ MHC IIhigh gated mature DC and lower row CD11c+ MHC IIlow gated immature DC. Surface staining of the indicated marker with quadrant statistics in red is overlaid with the FMO staining in blue. (C) Separate FACS analysis of the d8 cultures with immature CD11c+ MHC IIlow CD86low and spontaneously matured CD11c+ MHC IIhigh CD86high DC. To obtain mature DC transfer at d8 to fresh dishes/wells and addition of proinflammatory cytokines or TLR ligands (here 100 ng/ml LPS) is recommended.
Figure 11.
Figure 11.
Contaminating monocytes but only a few myeloid progenitors and no T and B cells in day 8 GM-CSF BM cultures. All data pre-gated as shown in Fig. 10A for FSC-A/SSC-A and single cells. (A) Surface staining was performed for the indicated markers. Mature MHC IIhigh cells are larger (FSC-A), express similar levels CD11c but lower CD11b. (B) Surface staining of the indicated markers in red is overlaid with the FMO staining in blue. (C) For surface staining of myeloid progenitor markers, a lineage marker exclusion was performed to identify MDP, cMoP, and differentiated monocyte (Mono) subsets.
Figure 12.
Figure 12.
Monocytes and neutrophils represent the major non-DC in the non-adherent fraction of day 8 GM-CSF cultures. (A–D) D8 GM-CSF BM cultures were stained for the indicated markers. Pre-gating was performed like in Fig. 10A. Cell types are indicated in red. Percentages within quadrants are shown in black or are in magenta when calculated for the whole culture cellularity. (E) CD117 expression is detectable on MHC IIneg progenitor cells but also on mature MHC IIhigh BM-MoDC.
Figure 13.
Figure 13.
Phase contrast image of DC differentiated from BM with Flt3L. 0.3 × 10⁶ total BM cells were seeded in a well of a 96-well round bottom plate and cultured with Flt3L. The image is acquired after 7 days of culture.
Figure 14.
Figure 14.
Two gating strategies for DC subsets generated from murine BM with Flt3L. Total BM cells were cultured for 7 (A) or 10 (B) days in a complete medium supplemented with Flt3L. (A) Before harvesting of the cells, calibration beads were added. Cells were then collected and processed for flow cytometry. Cells are first identified based on size and granularity by plotting the forward (FSC-A) versus side scatter (SSC-A). Doublets are then exclude based on the FSC-W and FSC-H, and live cells are identified as PI-negative. On single living cells, populations are determined as follows: CDP are CD11c Siglec-H; pre-DC are CD11c+ MHC-II Siglec-H; pDC are CD11cint Siglec-H+ CCR9+; cDC are CD11chi MHC-II+ Siglec-Hlow/− and can be further divided into cDC1 (XCR1+ Sirp-α) and cDC2 (XCR1 Sirp-α+). (B) Cells were collected and processed for flow cytometry. Living, single cells are selected (not shown) and analyzed for CD11c expression. CD11c+ cells are next split into pDC (B220hi CD11b) and cDC (B220). cDC are further subdivided into cDC1 (Sirp-α CD11blo CD24hi) and cDC2 (Sirp-α+ CD11b+ CD24lo). Numbers near the gates represent percentage of parent gate.
Figure 15.
Figure 15.
Yield and microscopic appearance of iCD103-DC cultures. (A) Scatter plot showing the absolute yield of live CD11c+B220Clec9A+CD103hi cells obtained per 1×10⁶ input BM cells. iCD103-DC were harvested on d16 and the cell yield evaluation was performed by using Trypan Blue stain. Results represent 10 independent experiments, each involving 1 culture from individual donor mice. (B) Typical bright-field micrograph of iCD103-DC cultures. Cells were harvested on day 16. Black arrows indicate the presence of floating cell aggregates. Scale bars represent 50 μm. Image was acquired on an inverted microscope (Olympus).
Figure 16.
Figure 16.
Gating strategy for identification of iCD103-DC. (A) Representative flow cytometry (FC) analysis of the gating strategy applied for the identification of iCD103-DC obtained on day 16. BM-DC were first gated based on forward and side scatter area (FSC-A and SSC-A) and doublets and debris were excluded by gating on area vs the height of SSC (SSC-A and SSC-H). Dead cells were excluded using fixable live-dead aqua dead cell dye. (B) Representative dot plots showing frequencies of Clec9A+CD103+ and Clec9A+SIRP-α cells. Gates were performed on live CD11c+B220 iCD103-DC as shown in (A). (C) Representative histograms were obtained by FC of live CD11c+B220 cells. Histograms represent the expression levels of SIRP-α, CD103, Clec9A, and CCR7 on d16 (black lines) and the respective control staining (grey overlay). In this example, 2 different staining panels were used.
Figure 17.
Figure 17.
Maturation status of differentiated iCD103-DC. (A) iCD103-DC were harvested on d16 and stimulated in a 96-well F-bottom cell culture plate overnight in the presence or absence of CpG-1826 ODN (1μM). Representative flow cytometry dot plots showing the frequencies of MHC-II+CD86+ cells among live CD11c+B220CD103+Clec9a+ cells. (B). The expression of CD40, CD80, CD86, and MHC-II were analyzed by flow cytometry among live CD11c+B220CD103+Clec9a+ cells in the presence (solid red line) or absence (solid black line) of overnight CpG-1826 ODN stimulation. In this example, 2 different staining panels were used.
Figure 18.
Figure 18.
The gating strategy for sorting pDC from BM-Flt3L cultures. The assay was performed following the protocol described in the text. The data was recoded using BD FACS Aria III. The FACS blots shown above are generated using FlowJo 10. Follow the gating from left to right. Cells were gated as cell-sized events according to FSC-A versus SSC-A profile, followed by single-cell events based on their FSC-A and FSC-H features. From the single events, the cells negative for the expression of B (CD19), T (CD3) cell surface markers and remained unstained for 7AAD (dead cell marker) were gated as live non-B/T cells. From this live non-B/T cell population CD11c+ cells were discriminated and analyzed for the expression of CD11b versus B220 (CD45R). pDC were defined as CD11bB220+ cells which further express SiglecH and mPDCA1 (CD317, Bst2).
Figure 19.
Figure 19.
Flow cytometry data of BM-MNC after CD34+ bead separation/pre-sort (upper row) and after sorting CD34+ HSC (lower row; reanalysis).
Figure 20.
Figure 20.
Phenotype of GM-CSF and M-CSF-generated DC. DC were generated in presence of GM-CSF and IL-4 (upper row) or M-CSF, IL-4, and TNF-α (lower row) from CD14+ monocytes. Then the cells were stained with antibodies specific for the indicated markers and analyzed by flow cytometry as described in [79]. Expression of the indicated proteins was categorized in 5 levels of expression (0 to 4). The corresponding histograms, except for CD1c and CD11c, were published previously by Goudot et al. [85].
Figure 21.
Figure 21.
Flow cytometric analysis and DC output of CD34+ differentiation. (A) Flow cytometric analysis of the culture at Day 21, using LSR-Fortessa X20 (BD biosciences) and the panel described in Table 12. Debris, doublets, and dead cells are first excluded, followed by OP9 (GFP+ in the FITC channel and CD45) and CD45lowCD15+ granulocyte precursors. Selecting lineage (CD3, 16, 19, 20, 34, 56) negative HLA-DR+ cells excludes lymphoid lineages and undifferentiated cells and selects antigen-presenting cells. DC subsets may then be identified by sequential gating: cDC1, CLEC9A+CD141+; cDC2, CD1c+CD2+(CD163CD14), DC3, CD1c+CD2+CD14+CD163+; Monocytes, CD11c+CD14+ (CD1c-CD2); pDC, CD123+CD303/304+. Dimensionality reduction analyses (such as tSNE or UMAP) may also be used to visualize the discrete populations. (B) DC generation in culture at Days 3, 5, 7, 9, 11, 14, and 21, expressed as the number of subset-specific DC generated per CD34+ HSPC seeded at Day 0. Cells were identified phenotypically as shown in (A). (C) Number of DC generated from CD34+ HSPC isolated from BM or peripheral blood (PB), expressed as the number of subset-specific DC generated per CD34+ HSPC seeded at Day 0.
Figure 22.
Figure 22.
Gating strategy for purity analysis of naturally circulating DC subsets. In this example, the staining was performed on aphaeresis material before DC isolation.
Figure 23.
Figure 23.
Gating strategy for phenotype analysis of cultured DC subsets. An example is given for cDC2. The same gating strategy can be followed for cDC1 or pDC.

References

    1. Redecke V, Wu R, Zhou J, Finkelstein D, Chaturvedi V, High AA and Häcker H, Hematopoietic progenitor cell lines with myeloid and lymphoid potential. Nat. Methods 2013. 10: 795–803. - PMC - PubMed
    1. Wang GG, Calvo KR, Pasillas MP, Sykes DB, Häcker H and Kamps M .P., Quantitative production of macrophages or neutrophils ex vivo using conditional Hoxb8. Nat. Methods 2006. 3: 287–293. - PubMed
    1. Hammerschmidt SI, Werth K, Rothe M, Galla M, Permanyer M, Patzer GE, Bubke A et al., CRISPR/Cas9 immunoengineering of HoxB8-immortalized progenitor cells for revealing CCR7-mediated dendritic cell signaling and migration mechanisms in vivo. Front. Immunol 2018. 9. - PMC - PubMed
    1. Leithner A, Renkawitz J, De Vries I, Hauschild R, Häcker H and Sixt M, Fast and efficient genetic engineering of hematopoietic precursor cells for the study of dendritic cell migration. Eur. J. Immunol 2018. 48: 1074–1077. - PubMed
    1. Xu H, Look T, Prithiviraj S, Lennartz D, Cáceres MD, Götz K, Wanek P et al. CRISPR/Cas9 editing in conditionally immortalized HoxB8 cells for studying gene regulation in mouse dendritic cells. Eur. J. Immunol 2021. 52: 1859–1862. - PubMed

Publication types