

Editorial
doi: 10.3389/fbinf.2021.669186.
eCollection 2021.
Grand Challenges in Bioinformatics Data Visualization
Affiliations
- PMID: 36303723
- PMCID: PMC9581027
- DOI: 10.3389/fbinf.2021.669186
Item in Clipboard
Editorial
Grand Challenges in Bioinformatics Data Visualization
Front Bioinform.
.
No abstract available
Keywords: bioinformatics; computational biology; data science; data visualization; science communication; visual analytics.
Conflict of interest statement
The author declares that the research was conducted in the absence of any commercial or financial relationships that could be construed as a potential conflict of interest.
Figures
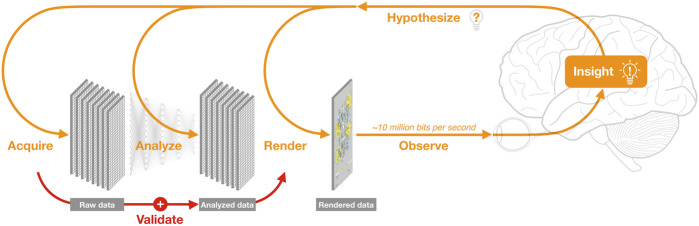
The data science cycle. Analysis of newly acquired data increasingly relies on integration with large, accumulating volumes of complex, pre-existing data, and requires frequent re-analysis and re-rendering. Visualization is the main way researchers observe both raw and analysed data; an overarching grand challenge of data visualization is to leverage human visual capabilities—which involve most of the brain and can process ∼10 million bits per second (Koch et al., 2006) to recognize patterns within ∼100 ms (Healey and Enns, 2012) — thereby transforming data into insight. These insights, in turn, lead to new hypotheses, thus continuing the cycle. Unfortunately, the critical step of manually validating derived models by visually comparing raw vs. analysed data (Anscombe, 1973) is often overlooked.
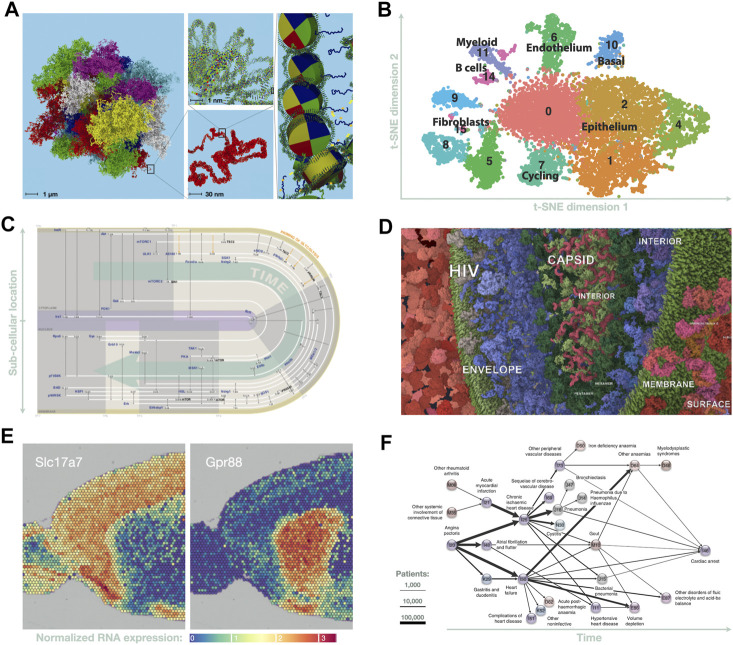
Six data visualization methods currently used in bioinformatics grand challenges. (A) A molecular-scale, 3D model of the human genome may soon be feasible; in preparation, visualization tools are being developed to enable interactive, multiscale exploration of such models (adapted from Asbury et al. (2010)). (B) t-SNE analysis of scRNA-seq data on breast cancer metastasis (adapted from Valdes-Mora et al. (2019)). (C) Spatiotemporal graph of phosphorylation events in fat cells following insulin stimulation (adapted from Ma et al. (2015), by Jenny Vuong). (D) Here, an interactive, web-based data integration environment is used to explore and curate a molecular-scale model of a subcellular landscape showing HIV-host interactions (Klein et al., 2018; Autin et al., 2020). (E) Portion of spatial transcriptomics analysis showing expression of two genes in an anterior slice from mouse brain (adapted from Vandenbon and Diez (2020)). (F) Disease trajectory graph showing progression from heart pain to cardiac arrest across the entire Danish population (adapted from Jensen et al. (2014)).
Similar articles
-
A global initiative on addressing bioinformatics' grand challenges.Brief Bioinform. 2024 May 23;25(4):bbae278. doi: 10.1093/bib/bbae278. Brief Bioinform. 2024. PMID: 38881075 Free PMC article.
-
From Virtual Reality to Immersive Analytics in Bioinformatics.J Integr Bioinform. 2018 Jul 9;15(2):20180043. doi: 10.1515/jib-2018-0043. J Integr Bioinform. 2018. PMID: 29982237 Free PMC article.
-
Selected articles from the Third International Workshop on Semantics-Powered Data Analytics (SEPDA 2018).BMC Med Inform Decis Mak. 2019 Aug 8;19(Suppl 4):148. doi: 10.1186/s12911-019-0855-3. BMC Med Inform Decis Mak. 2019. PMID: 31391050 Free PMC article.
-
A survey of urban visual analytics: Advances and future directions.Comput Vis Media (Beijing). 2023;9(1):3-39. doi: 10.1007/s41095-022-0275-7. Epub 2022 Oct 18. Comput Vis Media (Beijing). 2023. PMID: 36277276 Free PMC article. Review.
-
Bioinformatics approaches and big data analytics opportunities in improving fisheries and aquaculture.Int J Biol Macromol. 2023 Apr 1;233:123549. doi: 10.1016/j.ijbiomac.2023.123549. Epub 2023 Feb 4. Int J Biol Macromol. 2023. PMID: 36740117 Review.
Cited by
-
escheR: unified multi-dimensional visualizations with Gestalt principles.Bioinform Adv. 2023 Dec 6;3(1):vbad179. doi: 10.1093/bioadv/vbad179. eCollection 2023. Bioinform Adv. 2023. PMID: 38107654 Free PMC article.
-
Mixed Reality as a Digital Visualisation Solution for the Head and Neck Tumour Board: Application Creation and Implementation Study.Cancers (Basel). 2024 Mar 31;16(7):1392. doi: 10.3390/cancers16071392. Cancers (Basel). 2024. PMID: 38611070 Free PMC article.
-
Visualization of the individual blood microbiome to study the etiology of sarcoidosis.Comput Struct Biotechnol J. 2023 Oct 20;22:50-57. doi: 10.1016/j.csbj.2023.10.027. eCollection 2023. Comput Struct Biotechnol J. 2023. PMID: 37928975 Free PMC article.
-
escheR: Unified multi-dimensional visualizations with Gestalt principles.bioRxiv [Preprint]. 2023 Jun 8:2023.03.18.533302. doi: 10.1101/2023.03.18.533302. bioRxiv. 2023. Update in: Bioinform Adv. 2023 Dec 06;3(1):vbad179. doi: 10.1093/bioadv/vbad179. PMID: 36993732 Free PMC article. Updated. Preprint.
-
Naview: A d3.js Based JavaScript Library for Drawing and Annotating Voltage-Gated Sodium Channels Membrane Diagrams.Front Bioinform. 2022 Feb 11;2:774417. doi: 10.3389/fbinf.2022.774417. eCollection 2022. Front Bioinform. 2022. PMID: 36304314 Free PMC article.
References
-
- Aerts J., Gehlenborg N., Marai G. E., Nieselt K. K. (2018). Visualization of Biological Data - Crossroads (Dagstuhl Semin. 18161). Dagstuhl Rep. 8 (4), 32–71. 10.4230/DAGREP.8.4.32 - DOI
-
- Altman R. B., Levitt M. (2018). What Is Biomedical Data Science and Do We Need an Annual Review of it? Annu. Rev. Biomed. Data Sci. 1, i–iii. 10.1146/annurev-bd-01-041718-100001 - DOI
-
- Anscombe F. J. (1973). Graphs in Statistical Analysis. Am. Stat. 27, 17–21. 10.1080/00031305.1973.1047896610.2307/2682899 - DOI
Publication types
LinkOut - more resources
Full Text Sources