

Intracellular and Intercellular Gene Regulatory Network Inference From Time-Course Individual RNA-Seq
- PMID: 36303726
- PMCID: PMC9580923
- DOI: 10.3389/fbinf.2021.777299
Intracellular and Intercellular Gene Regulatory Network Inference From Time-Course Individual RNA-Seq
Abstract
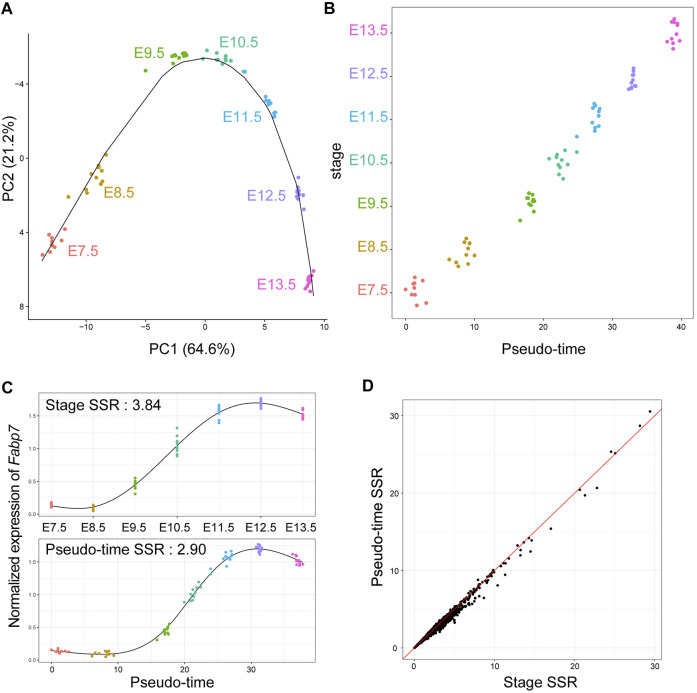
Gene regulatory network (GRN) inference is an effective approach to understand the molecular mechanisms underlying biological events. Generally, GRN inference mainly targets intracellular regulatory relationships such as transcription factors and their associated targets. In multicellular organisms, there are both intracellular and intercellular regulatory mechanisms. Thus, we hypothesize that GRNs inferred from time-course individual (whole embryo) RNA-Seq during development can reveal intercellular regulatory relationships (signaling pathways) underlying the development. Here, we conducted time-course bulk RNA-Seq of individual mouse embryos during early development, followed by pseudo-time analysis and GRN inference. The results demonstrated that GRN inference from RNA-Seq with pseudo-time can be applied for individual bulk RNA-Seq similar to scRNA-Seq. Validation using an experimental-source-based database showed that our approach could significantly infer GRN for all transcription factors in the database. Furthermore, the inferred ligand-related and receptor-related downstream genes were significantly overlapped. Thus, the inferred GRN based on whole organism could include intercellular regulatory relationships, which cannot be inferred from scRNA-Seq based only on gene expression data. Overall, inferring GRN from time-course bulk RNA-Seq is an effective approach to understand the regulatory relationships underlying biological events in multicellular organisms.
Keywords: bulk RNA-seq; gene regulatory network; intracellular; mouse; time course.
Copyright © 2021 Kashima, Shida, Yamashiro, Hirata and Kurosaka.
Conflict of interest statement
The authors declare that the research was conducted in the absence of any commercial or financial relationships that could be construed as a potential conflict of interest.
Figures


Similar articles
-
MICRAT: a novel algorithm for inferring gene regulatory networks using time series gene expression data.BMC Syst Biol. 2018 Dec 14;12(Suppl 7):115. doi: 10.1186/s12918-018-0635-1. BMC Syst Biol. 2018. PMID: 30547796 Free PMC article.
-
DeepGRNCS: deep learning-based framework for jointly inferring gene regulatory networks across cell subpopulations.Brief Bioinform. 2024 May 23;25(4):bbae334. doi: 10.1093/bib/bbae334. Brief Bioinform. 2024. PMID: 38980373 Free PMC article.
-
Predicting gene regulatory links from single-cell RNA-seq data using graph neural networks.Brief Bioinform. 2023 Sep 22;24(6):bbad414. doi: 10.1093/bib/bbad414. Brief Bioinform. 2023. PMID: 37985457 Free PMC article.
-
A review on gene regulatory network reconstruction algorithms based on single cell RNA sequencing.Genes Genomics. 2024 Jan;46(1):1-11. doi: 10.1007/s13258-023-01473-8. Epub 2023 Nov 30. Genes Genomics. 2024. PMID: 38032470 Review.
-
Unraveling Root Development Through Single-Cell Omics and Reconstruction of Gene Regulatory Networks.Front Plant Sci. 2021 May 4;12:661361. doi: 10.3389/fpls.2021.661361. eCollection 2021. Front Plant Sci. 2021. PMID: 34017350 Free PMC article. Review.
Cited by
-
tomoseqr: A Bioconductor package for spatial reconstruction and visualization of 3D gene expression patterns based on RNA tomography.PLoS One. 2025 Jan 8;20(1):e0311296. doi: 10.1371/journal.pone.0311296. eCollection 2025. PLoS One. 2025. PMID: 39774435 Free PMC article.
-
Activation of XBP1 but not ATF6α rescues heart failure induced by persistent ER stress in medaka fish.Life Sci Alliance. 2023 May 9;6(7):e202201771. doi: 10.26508/lsa.202201771. Print 2023 Jul. Life Sci Alliance. 2023. PMID: 37160311 Free PMC article.
-
Expression analysis of genes including Zfhx4 in mice and zebrafish reveals a temporospatial conserved molecular basis underlying craniofacial development.Dev Dyn. 2025 Mar;254(3):257-271. doi: 10.1002/dvdy.740. Epub 2024 Sep 25. Dev Dyn. 2025. PMID: 39320016 Free PMC article.
References
-
- Akyol T. Y. (2019). RVenn: An R Package for Set Operations on Multiple Sets. Available at: https://cran.r-project.org/web/packages/RVenn/vignettes/vignette.html .
LinkOut - more resources
Full Text Sources
Miscellaneous