GeneCloudOmics: A Data Analytic Cloud Platform for High-Throughput Gene Expression Analysis
- PMID: 36303746
- PMCID: PMC9581002
- DOI: 10.3389/fbinf.2021.693836
GeneCloudOmics: A Data Analytic Cloud Platform for High-Throughput Gene Expression Analysis
Abstract
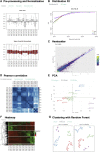
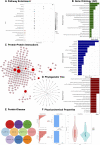
Gene expression profiling techniques, such as DNA microarray and RNA-Sequencing, have provided significant impact on our understanding of biological systems. They contribute to almost all aspects of biomedical research, including studying developmental biology, host-parasite relationships, disease progression and drug effects. However, the high-throughput data generations present challenges for many wet experimentalists to analyze and take full advantage of such rich and complex data. Here we present GeneCloudOmics, an easy-to-use web server for high-throughput gene expression analysis that extends the functionality of our previous ABioTrans with several new tools, including protein datasets analysis, and a web interface. GeneCloudOmics allows both microarray and RNA-Seq data analysis with a comprehensive range of data analytics tools in one package that no other current standalone software or web-based tool can do. In total, GeneCloudOmics provides the user access to 23 different data analytical and bioinformatics tasks including reads normalization, scatter plots, linear/non-linear correlations, PCA, clustering (hierarchical, k-means, t-SNE, SOM), differential expression analyses, pathway enrichments, evolutionary analyses, pathological analyses, and protein-protein interaction (PPI) identifications. Furthermore, GeneCloudOmics allows the direct import of gene expression data from the NCBI Gene Expression Omnibus database. The user can perform all tasks rapidly through an intuitive graphical user interface that overcomes the hassle of coding, installing tools/packages/libraries and dealing with operating systems compatibility and version issues, complications that make data analysis tasks challenging for biologists. Thus, GeneCloudOmics is a one-stop open-source tool for gene expression data analysis and visualization. It is freely available at http://combio-sifbi.org/GeneCloudOmics.
Keywords: OMICS data; RNA-seq; bioinformatics; data analytics; gene expression analysis; microarray; transcriptomics.
Copyright © 2021 Helmy, Agrawal, Ali, Soudy, Bui and Selvarajoo.
Conflict of interest statement
The authors declare that the research was conducted in the absence of any commercial or financial relationships that could be construed as a potential conflict of interest.
Figures


Similar articles
-
Application of GeneCloudOmics: Transcriptomic Data Analytics for Synthetic Biology.Methods Mol Biol. 2023;2553:221-263. doi: 10.1007/978-1-0716-2617-7_12. Methods Mol Biol. 2023. PMID: 36227547
-
NASQAR: a web-based platform for high-throughput sequencing data analysis and visualization.BMC Bioinformatics. 2020 Jun 29;21(1):267. doi: 10.1186/s12859-020-03577-4. BMC Bioinformatics. 2020. PMID: 32600310 Free PMC article.
-
ABioTrans: A Biostatistical Tool for Transcriptomics Analysis.Front Genet. 2019 May 31;10:499. doi: 10.3389/fgene.2019.00499. eCollection 2019. Front Genet. 2019. PMID: 31214245 Free PMC article.
-
Chipster: user-friendly analysis software for microarray and other high-throughput data.BMC Genomics. 2011 Oct 14;12:507. doi: 10.1186/1471-2164-12-507. BMC Genomics. 2011. PMID: 21999641 Free PMC article.
-
Flapjack: Data Management and Analysis for Genetic Circuit Characterization.Methods Mol Biol. 2024;2760:413-434. doi: 10.1007/978-1-0716-3658-9_23. Methods Mol Biol. 2024. PMID: 38468101 Review.
Cited by
-
STAGEs: A web-based tool that integrates data visualization and pathway enrichment analysis for gene expression studies.Sci Rep. 2023 May 2;13(1):7135. doi: 10.1038/s41598-023-34163-2. Sci Rep. 2023. PMID: 37130913 Free PMC article.
-
Epigallocatechin-3-gallate: a multi-target bioactive molecule derived from green tea against Oropouche virus-a computational approach to host-pathogen network modulation.Front Chem. 2025 Jul 3;13:1590498. doi: 10.3389/fchem.2025.1590498. eCollection 2025. Front Chem. 2025. PMID: 40678119 Free PMC article.
-
DElite: a tool for integrated differential expression analysis.Front Genet. 2024 Nov 20;15:1440994. doi: 10.3389/fgene.2024.1440994. eCollection 2024. Front Genet. 2024. PMID: 39634274 Free PMC article.
-
Perspective: Multiomics and Machine Learning Help Unleash the Alternative Food Potential of Microalgae.Adv Nutr. 2023 Jan;14(1):1-11. doi: 10.1016/j.advnut.2022.11.002. Epub 2022 Dec 23. Adv Nutr. 2023. PMID: 36811582 Free PMC article.
-
CAP-RNAseq: an integrated pipeline for functional annotation and prioritization of co-expression clusters.Brief Bioinform. 2024 Jan 22;25(2):bbad536. doi: 10.1093/bib/bbad536. Brief Bioinform. 2024. PMID: 38279653 Free PMC article.
References
-
- Beal J. (2017). Biochemical Complexity Drives Log‐normal Variation in Genetic Expression. Eng. Biol. 1, 55–60. 10.1049/enb.2017.0004 - DOI
LinkOut - more resources
Full Text Sources

