. 2022 Jan 26:1:774300.
doi: 10.3389/fbinf.2021.774300. eCollection 2021.

Interactive, Visual Simulation of a Spatio-Temporal Model of Gas Exchange in the Human Alveolus

Affiliations

Interactive, Visual Simulation of a Spatio-Temporal Model of Gas Exchange in the Human Alveolus

Kerstin Schmid et al. Front Bioinform. .

Abstract

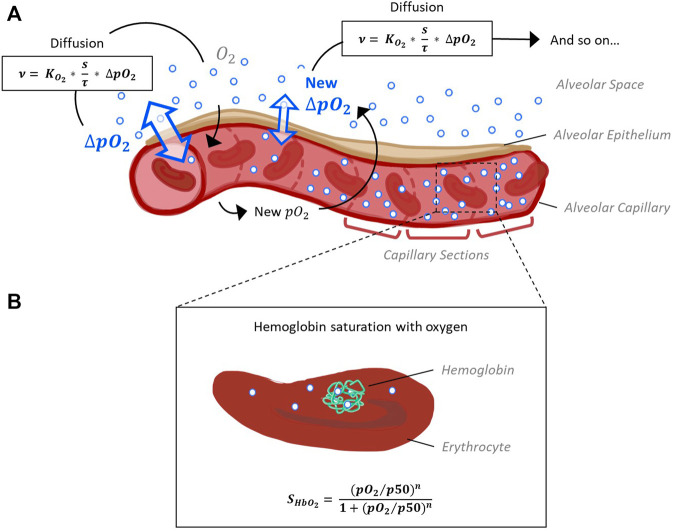
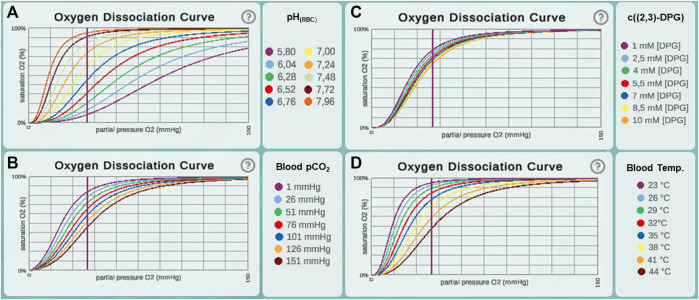
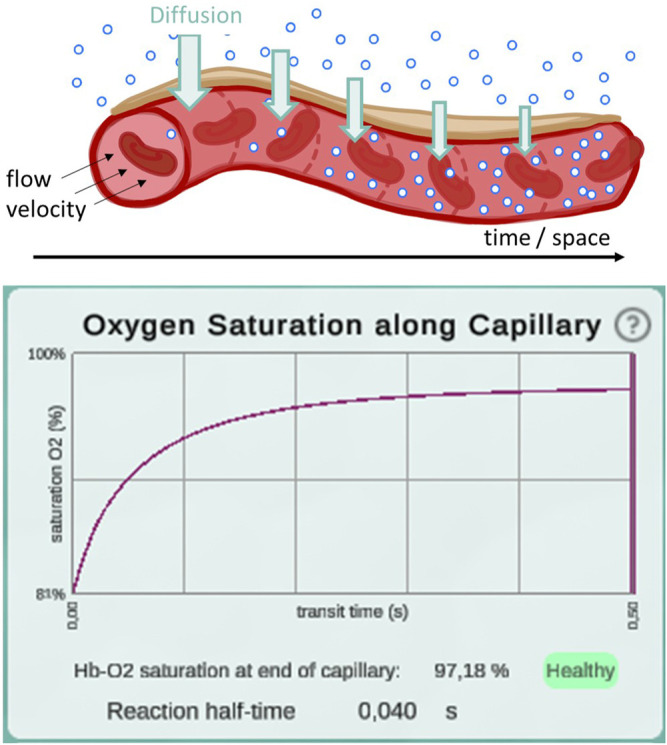
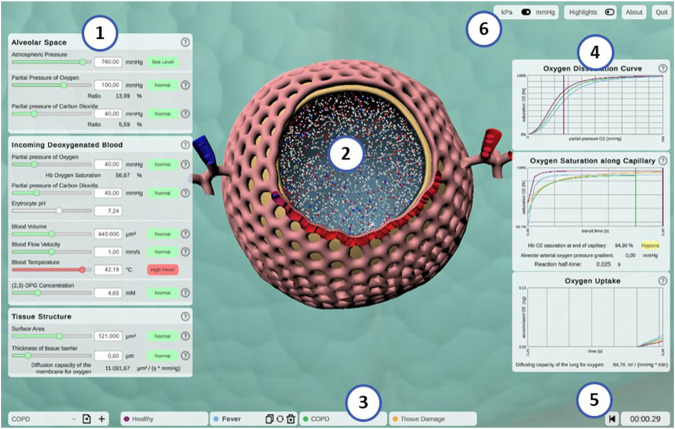
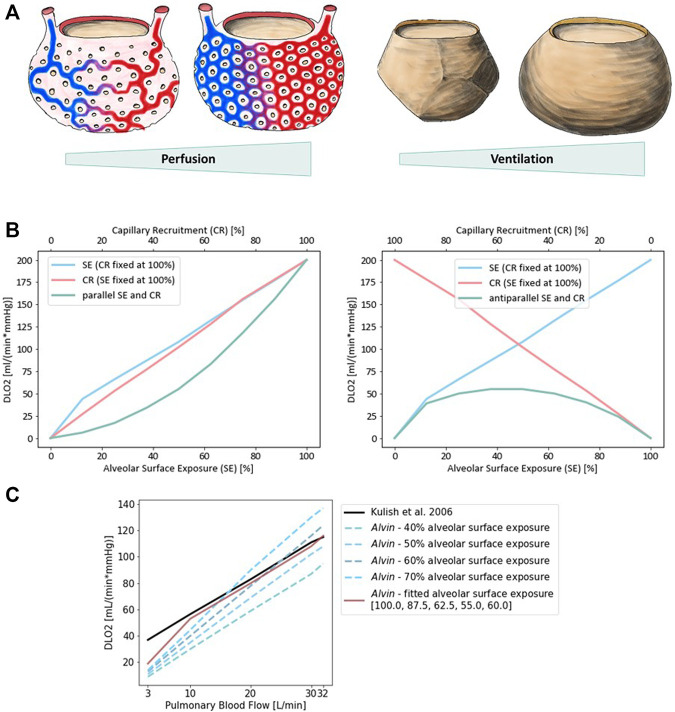
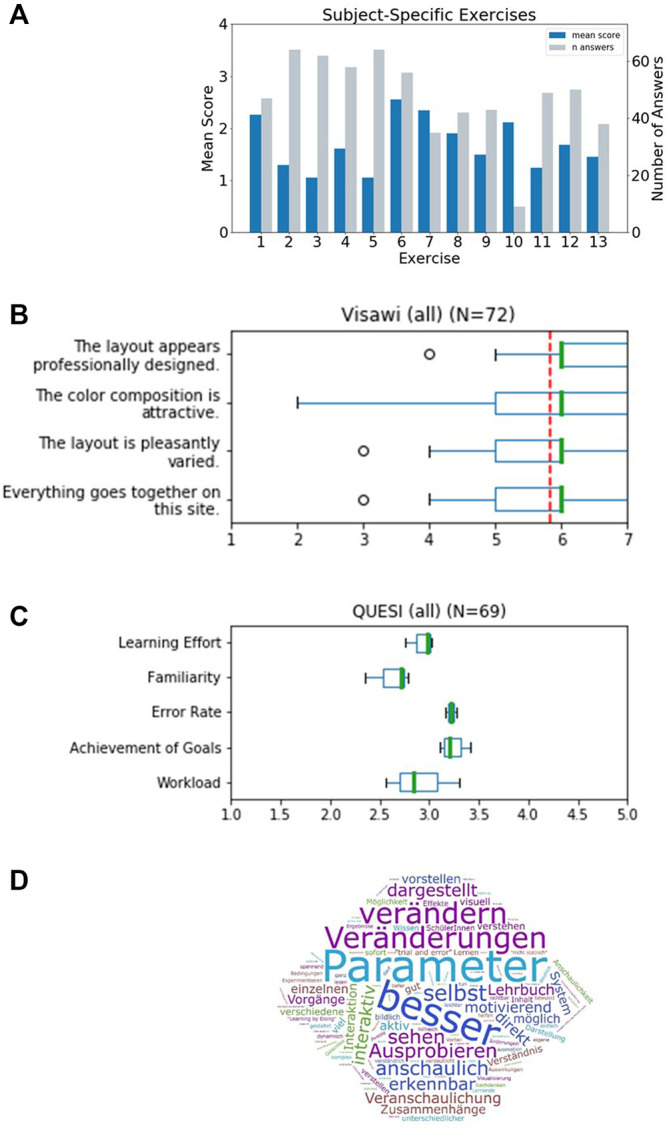
In interdisciplinary fields such as systems biology, good communication between experimentalists and theorists is crucial for the success of a project. Theoretical modeling in physiology usually describes complex systems with many interdependencies. On one hand, these models have to be grounded on experimental data. On the other hand, experimenters must be able to understand the interdependent complexities of the theoretical model in order to interpret the model's results in the physiological context. We promote interactive, visual simulations as an engaging way to present theoretical models in physiology and to make complex processes tangible. Based on a requirements analysis, we developed a new model for gas exchange in the human alveolus in combination with an interactive simulation software named Alvin. Alvin exceeds the current standard with its spatio-temporal resolution and a combination of visual and quantitative feedback. In Alvin, the course of the simulation can be traced in a three-dimensional rendering of an alveolus and dynamic plots. The user can interact by configuring essential model parameters. Alvin allows to run and compare multiple simulation instances simultaneously. We exemplified the use of Alvin for research by identifying unknown dependencies in published experimental data. Employing a detailed questionnaire, we showed the benefits of Alvin for education. We postulate that interactive, visual simulation of theoretical models, as we have implemented with Alvin on respiratory processes in the alveolus, can be of great help for communication between specialists and thereby advancing research.

Keywords: education; interactive simulation; lung physiology; requirements analysis; spatio-temporal resolution; theoretical modeling; visualization.


Conflict of interest statement

The authors declare that the research was conducted in the absence of any commercial or financial relationships that could be construed as a potential conflict of interest.

Figures

FIGURE 1
FIGURE 1
Schematic representation of the model capillary with erythrocytes, separated from alveolar space by a single cell layer of alveolar epithelium. (A) In order to reconstruct O2 and CO2 pressure gradients along the capillary, it is divided into sections of equal size. The pressure gradient between alveolar space and blood (ΔpO2) and the resulting flow of oxygen along this gradient is calculated for each section subsequently, as oxygen flow into one section affects pO2 and thus ΔpO2 of the next section. Calculation of oxygen diffusion depending on ΔpO2 is based on Fick’s law (Weibel et al., 1993). (B) According to the pO2 and pCO2 gradients along the capillary sections determined in step 1, hemoglobin oxygen saturation (SHbO2) is calculated for each section. The corresponding Hill equation has been defined and fitted to experimental data (Dash et al., 2016).
FIGURE 2
FIGURE 2
Oxygen dissociation curves recreated in Alvin for different ranges of parameter values from the original paper (Dash et al., 2016). This includes value ranges for the parameters (A) pH in erythrocytes (pHrbc), (B) blood pCO2, (C) concentration of [2,3]-DPG and (D) blood temperature.
FIGURE 3
FIGURE 3
Illustration of the diffusion gradient along the model capillary (top) and a screenshot of the plot displaying oxygen saturation along capillary between 81 and 97% (bottom). This screenshot was taken from a simulation with pO2 values of 97 mmHg in the alveolar space and 46 mmHg in the deoxygenated blood. All other parameters remained at their default settings. Reaction half-time is defined as the time point at which 50% of the oxygenation that blood undergoes during its transit along the alveolus is reached.
FIGURE 4
FIGURE 4
Screenshot of the interactive application Alvin. (1) Model parameters are grouped in categories and can be configured by the user. Colors and information text provide possible real-world interpretation of the values. (2) Animated simulation of an alveolus for the active parameter set provides visualization of the effect of the model parameter values. (3) To increase exploratory value, multiple simulation instances can be compared. (4) Quantitative simulation output is displayed with plots color-coded for each active instance of the simulation. (5) Simulation time is displayed and can be reset. (6) Utility functions and settings are available.
FIGURE 5
FIGURE 5
Diffusion capacity of the lung for oxygen (DLO2) strongly depends on perfusion and ventilation. (A) Illustration of capillary recruitment (left) and alveolar expansion (right). (B) Diffusion capacity of the lung for oxygen (DLO2) depending on capillary recruitment and alveolar expansion for a parallel (left) and antiparallel combination (right). Alveolar expansion and the ensuing surface exposure are simulated in Alvin by increasing alveolar surface area from 0 (0%) to 207,000 μm2 (100%) in steps of 12.5%. Capillary recruitment is represented by capillary blood volume increase from 0 (0%) to 808,000 μm3 (100%) in steps of 12.5% in Alvin. (C) Comparison to published DLO2 estimates (Kulish, 2006) (black). Pulmonary blood flow was interpreted as blood volume in Alvin, assuming a flow velocity of 1.5 mm/s and morphological features (mean capillary length of 500 μm (Weibel et al., 1993) and maximum volume of alveolar capillary bed 808,000 μm3 (Gehr et al., 1978; Ochs et al., 2004)). Alveolar surface exposure was fixed at constant values (blue dashed lines) and adjusted with increasing pulmonary blood flow (red line).
FIGURE 6
FIGURE 6
Results of a survey for undergraduate students that worked with Alvin in a physiology lab course. (A) Evaluation of thirteen subject-specific exercises. Responses were scored 1 - correct, 2 - partially correct (e.g., subsequent faults), 3 - unclear to 4 - incorrect. The mean score for every exercise was determined. The individual exercises were answered by different numbers of participants (grey bars). (B) The standardized Visawi-s survey (Moshagen and Thielsch, 2021) addresses design features. The 72 participants rated from 1 (strongly disagree) to 7 (strongly agree). The mean score over all four categories was 5.8 (red, dashed line). (C) Results on usability from the standardized survey QUESI (Hurtienne and Naumann, 2010). Five subscales are assessed, with higher scores obtained the more intuitive the use of the system was perceived to be. The mean overall QUESI score from 69 forms was 2.98. (D) Participants were asked “which benefits do you see in this system compared to a traditional text book?“. A frequency analysis on the answers was performed. The most recurrent terms were (translated from German): “parameter”, “better”, “modifiy”, “changes”, “by oneself”, “illustrative”, “testing”, “see”, “illustrated”, “apparent”, “interactive” and “immediate”.

References

    1. Bachofen H., Schürch S., Urbinelli M., Weibel E. R. (1987). Relations Among Alveolar Surface Tension, Surface Area, Volume, and Recoil Pressure. J. Appl. Physiol. (1985) 62, 1878–1887. 10.1152/jappl.1987.62.5.1878 - DOI - PubMed
    1. Byrne H. M., Alarcon T., Owen M. R., Webb S. D., Maini P. K. (2006). Modelling Aspects of Cancer Dynamics: a Review. Philos. Trans. A. Math. Phys. Eng. Sci. 364, 1563–1578. 10.1098/rsta.2006.1786 - DOI - PubMed
    1. Carney D. E., Bredenberg C. E., Schiller H. J., Picone A. L., McCANN U. G., Gatto L. A., et al. (1999). The Mechanism of Lung Volume Change during Mechanical Ventilation. Am. J. Respir. Crit. Care Med. 160, 1697–1702. 10.1164/ajrccm.160.5.9812031 - DOI - PubMed
    1. Chao E. Y. (2003). Graphic-based Musculoskeletal Model for Biomechanical Analyses and Animation. Med. Eng. Phys. 25, 201–212. 10.1016/S1350-4533(02)00181-9 - DOI - PubMed
    1. Conover T., Hlavacek A. M., Migliavacca F., Kung E., Dorfman A., Figliola R. S., et al. (2018). An Interactive Simulation Tool for Patient-specific Clinical Decision Support in Single-Ventricle Physiology. J. Thorac. Cardiovasc. Surg. 155, 712–721. 10.1016/j.jtcvs.2017.09.046 - DOI - PubMed

LinkOut - more resources