. 2022 Oct 10:13:934706.
doi: 10.3389/fendo.2022.934706. eCollection 2022.

Integrative analysis reveals novel associations between DNA methylation and the serum metabolome of adolescents with type 2 diabetes: A cross-sectional study

Affiliations

Integrative analysis reveals novel associations between DNA methylation and the serum metabolome of adolescents with type 2 diabetes: A cross-sectional study

Prasoon Agarwal et al. Front Endocrinol (Lausanne). .

Abstract

Objective: Rates of type 2 diabetes (T2D) among adolescents are on the rise. Epigenetic changes could be associated with the metabolic alterations in adolescents with T2D.

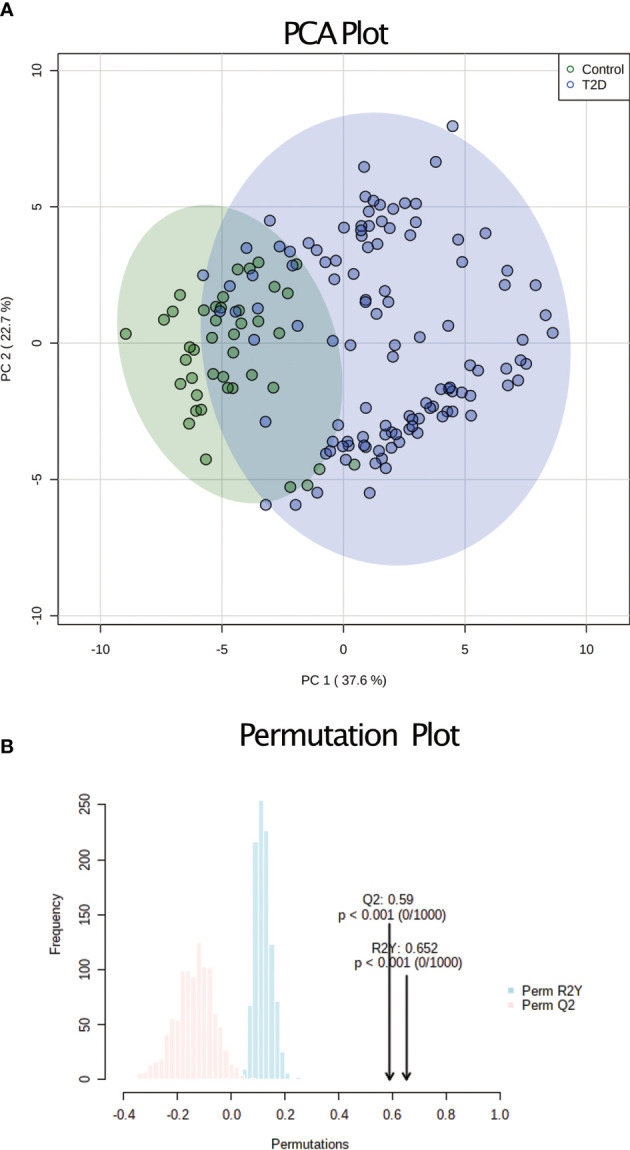
Methods: We performed a cross sectional integrated analysis of DNA methylation data from peripheral blood mononuclear cells with serum metabolomic data from First Nation adolescents with T2D and controls participating in the Improving Renal Complications in Adolescents with type 2 diabetes through Research (iCARE) cohort study, to explore the molecular changes in adolescents with T2D.

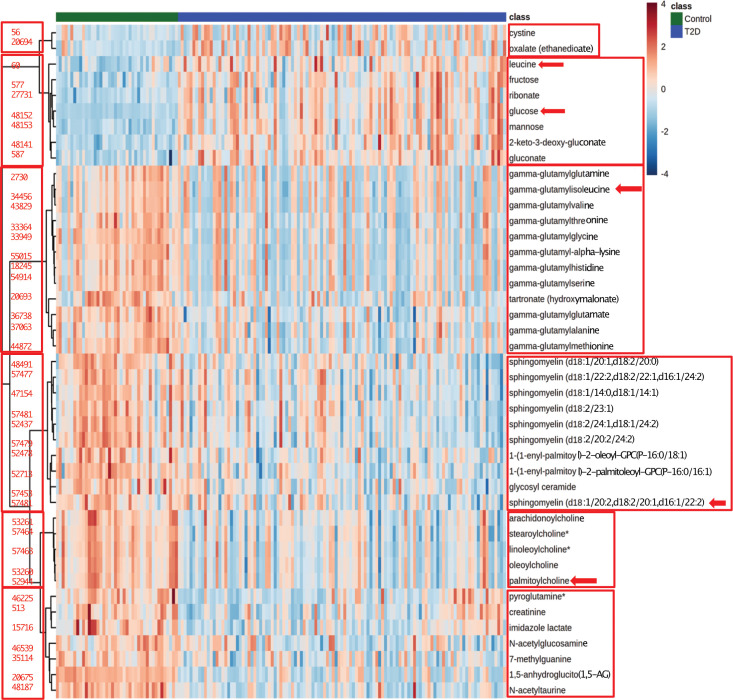
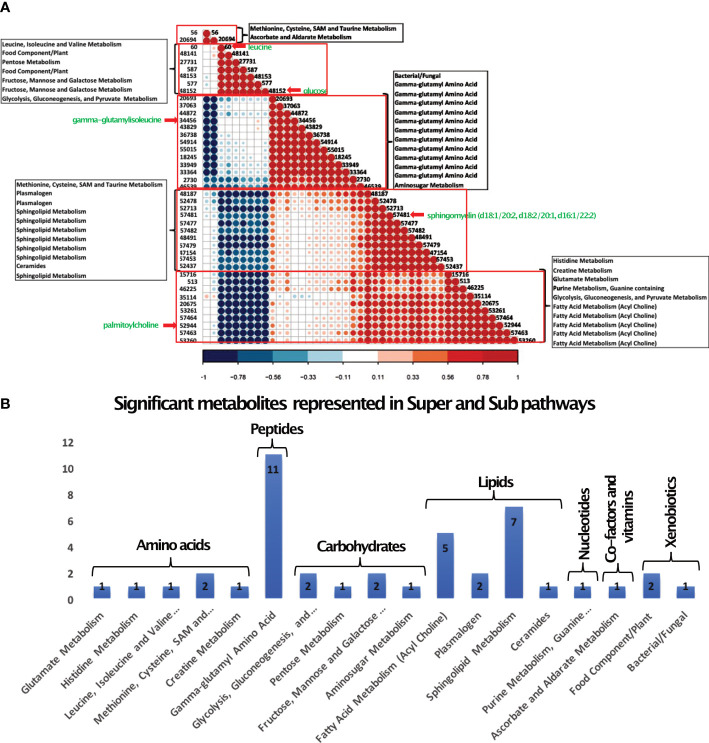
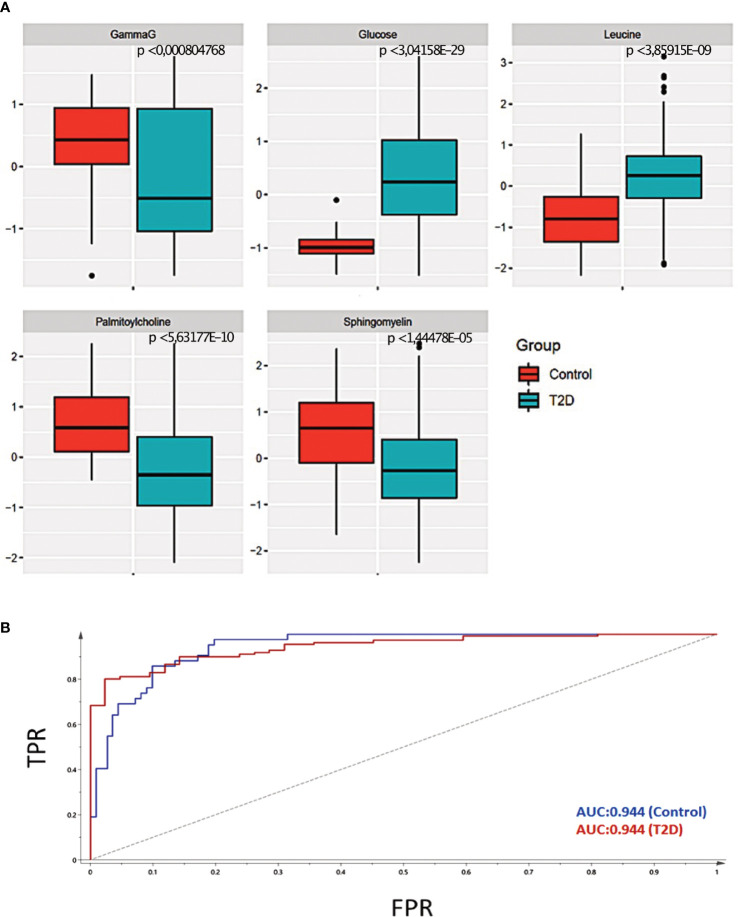
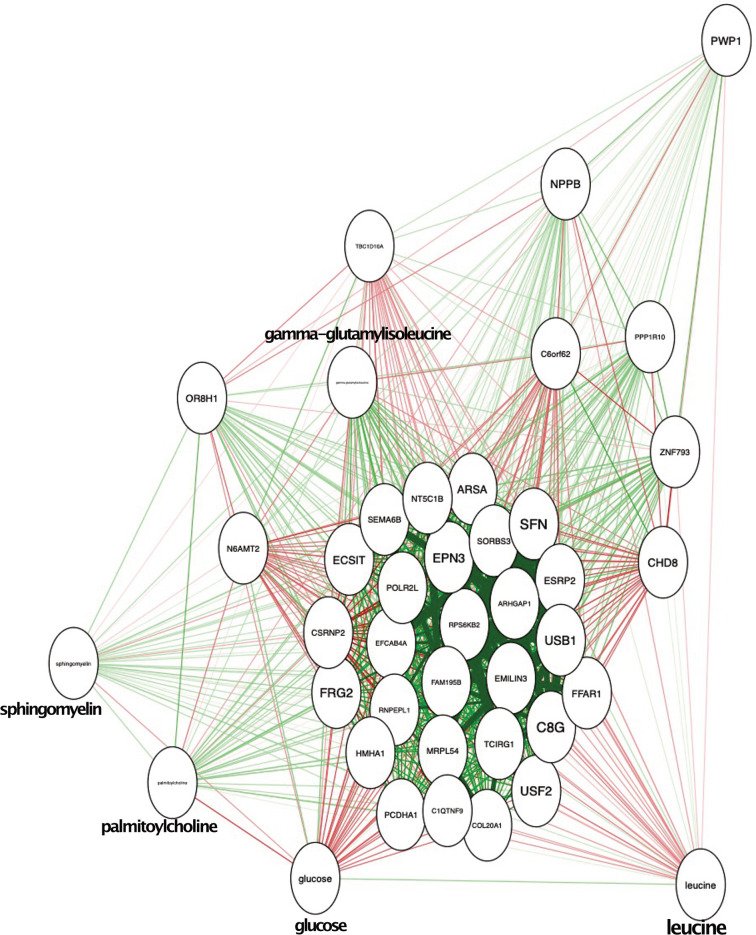
Results: Our analysis showed that 43 serum metabolites and 36 differentially methylated regions (DMR) were associated with T2D. Several DMRs were located near the transcriptional start site of genes with established roles in metabolic disease and associated with altered serum metabolites (e.g. glucose, leucine, and gamma-glutamylisoleucine). These included the free fatty acid receptor-1 (FFAR1), upstream transcription factor-2 (USF2), and tumor necrosis factor-related protein-9 (C1QTNF9), among others.

Conclusions: We identified DMRs and metabolites that merit further investigation to determine their significance in controlling gene expression and metabolism which could define T2D risk in adolescents.

Keywords: DNA methylation; integration of data; metabolomics; pediatrics; type 2 diabetes mellitus.


Conflict of interest statement

The authors declare that the research was conducted in the absence of any commercial or financial relationships that could be construed as a potential conflict of interest.

Figures

Figure 1
Figure 1
Unsupervised analysis of serum metabolomics. (A) PCA analysis based on the 43 metabolites and all 155 samples. The controls are shown in green and the T2D samples in blue (B) Permutation conducted to validate the variation obtained during the PCA. The R2 (shown in blue) and Q2 (shown in red) values indicate the robustness of the PCA model.
Figure 2
Figure 2
Heatmap of differential levels of 43 serum metabolites. 43 metabolites that were significantly different between T2D adolescents (blue color class) and control adolescents (green color class). Red color indicates the increased and the blue indicates reduced levels. The red boxes show the six major clusters formed. On the left of cluster is shown the compound identification for the respective metabolite. The red arrows show the five metabolites that were used for data integration.
Figure 3
Figure 3
Pathway analysis of Serum Metabolites. (A) Pearson correlation-based clustering of the significant metabolites. Five major clusters obtained are shown in red boxes. Each metabolite is represented by their compound identification ( Table 2 shows the respective metabolites). The sub pathways of the metabolites are represented in the boxes. The five metabolites chosen for data integration are indicated by a red arrow. (B) 43 metabolites were categorized into seven super pathways, including lipids (35%), peptides (26% gamma-glutamyl amino acids), amino acids (10%), carbohydrates (17%), nucleotide (2% purine metabolism), cofactors and vitamins (2% ascorbate and aldarate metabolism), and xenobiotics (7%).
Figure 4
Figure 4
Selection of representative metabolites for data integration. (A) Statistical significance of the five selected metabolites for data integration. The p-value is estimated using an unpaired t-test. The p-value < 0.05 is considered to the significant. (B) The Area Under the Curve (AUC) of the five selected metabolites was 0.94, demonstrating a high accuracy of prediction.
Figure 5
Figure 5
Integration of metabolic and epigenomic data. The red lines indicate the positive correlation and green lines indicate the negative correlation. The five metabolites and the genes are shown in the circles.

References

    1. Bullock A, Sheff K. Incidence trends of type 1 and type 2 diabetes among youth-2012. N Engl J Med (2017) 377:301. doi: 10.1056/NEJMc1706291 - DOI - PubMed
    1. Pinhas-Hamiel O, Zeitler P. Acute and chronic complications of type 2 diabetes mellitus in children and adolescents. Lancet (2007) 369:1823–31. doi: 10.1016/S0140-6736(07)60821-6 - DOI - PubMed
    1. Ruth C, Sellers E, Chartrand C, Mcleod L, Prior H, Sirski M, et al. . Type 2 diabetes in manitoba. Manitoba centre for health policy autumn (2020). Available at: http://mchp-appserv.cpe.umanitoba.ca/reference/T2DM_Report_web.pdf.
    1. Bacha F, Gungor N, Lee S, Arslanian SA. Progressive deterioration of beta-cell function in obese youth with type 2 diabetes. Pediatr Diabetes (2013) 14:106–11. doi: 10.1111/j.1399-5448.2012.00915.x - DOI - PMC - PubMed
    1. Manolio TA, Collins FS, Cox NJ, Goldstein DB, Hindorff LA, Hunter DJ, et al. . Finding the missing heritability of complex diseases. Nature (2009) 461:747–53. doi: 10.1038/nature08494 - DOI - PMC - PubMed

Publication types