. 2022 Oct 26;9(10):220716.
doi: 10.1098/rsos.220716. eCollection 2022 Oct.

The voice of few, the opinions of many: evidence of social biases in Twitter COVID-19 fake news sharing

Affiliations

The voice of few, the opinions of many: evidence of social biases in Twitter COVID-19 fake news sharing

Piergiorgio Castioni et al. R Soc Open Sci. .

Abstract

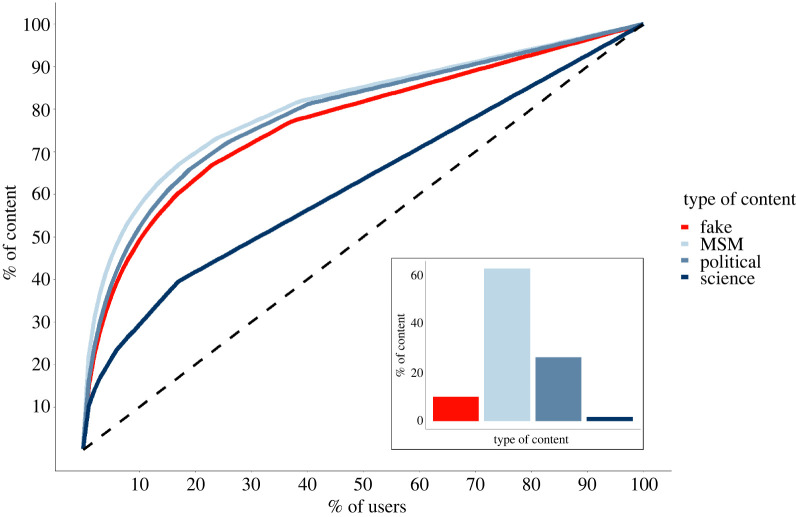
Online platforms play a relevant role in the creation and diffusion of false or misleading news. Concerningly, the COVID-19 pandemic is shaping a communication network which reflects the emergence of collective attention towards a topic that rapidly gained universal interest. Here, we characterize the dynamics of this network on Twitter, analysing how unreliable content distributes among its users. We find that a minority of accounts is responsible for the majority of the misinformation circulating online, and identify two categories of users: a few active ones, playing the role of 'creators', and a majority playing the role of 'consumers'. The relative proportion of these groups (approx. 14% creators-86% consumers) appears stable over time: consumers are mostly exposed to the opinions of a vocal minority of creators (which are the origin of 82% of fake content in our data), that could be mistakenly understood as representative of the majority of users. The corresponding pressure from a perceived majority is identified as a potential driver of the ongoing COVID-19 infodemic.

Keywords: computational social science; data analysis; fake news; social networks; social psychology.


Conflict of interest statement

We declare we have no competing interests.

Figures

Figure 1.
Figure 1.
Characterizing the share of content with respect to the share of users who produce them. The x-axis indicates the fraction of users ordered from most active to least active, while the y-axis displays the share of the overall content (tweets and retweets) that those users are responsible for. The content is divided into four types: fake, mainstream media (or MSM), political and science (see Methods). Different content types are encoded by distinct colours: note the red one, corresponding to content identified as fake news. Black dashed lines correspond to the distribution one would observe if all users were responsible for the same fraction of total content, to highlight the highly heterogeneous activity of content production from different users, regardless of content type.
Figure 2.
Figure 2.
Schematic illustration of the separation between creators and consumers. The arrows represent the endorsements (i.e. retweets in Twitter) and go from the retweeting to the retweeted individuals. Values indicate the ratio between the observed number of links and the number one would expect if the links were randomly assigned, i.e. the number of links between groups were compared with that of an Erdös–Rényi model with the same number of total links. Note that the illustration is not at scale with numbers.
Figure 3.
Figure 3.
Do users engage always with the same accounts? To answer to this question, we computed the ratio of retweets per retweeted (retweeting) accounts in the case of consumers (creators), which are shown in (a,b), respectively. The acronym RpRA stands for what appears on the x-axis of each figure. In both cases, the distribution of this ratio among users is heavily skewed towards one, as shown by the black dashed line representing the median (1.2 and 1.04, respectively). This means that the majority of the users interacts with different people every time they retweet or are retweeted, therefore confirming the idea that on average people cannot understand what group (creators or consumers) they are interacting with. In the analysis users involved in less than 10 retweets are excluded because they would have further skewed the distribution without adding significant information.
Figure 4.
Figure 4.
Fluid transitions between creators’ and consumers’ groups. Let us consider first-return times: (a) schematic example of the behaviour of a user (the circle), who might change his/her group at every time step (e.g. 1 day). Red, blue and black circles represent creators, consumers and non-spreaders, respectively. The return times are the number of black circles that separate coloured circles from one another, so in this example, they are 3, 0, 1 and 0 days, in chronological order from left- to right-hand side. The two histograms display the probability of returning, after a certain time, to a fake news spreading group (creators in orange, consumers in blue) for users that just stopped being (b) creators or (c) consumers.
Figure 5.
Figure 5.
Unravelling causal relationships between group dynamics and fake news volume. (a) Comparison between the time series of the fraction of fake retweets (black line), the fraction of consumers (blue line) and the fraction of creators (red line). The latter were rescaled to ease the comparison between trends. The time step is of 1 day, while the lines are obtained through a 10 days moving average. (b) Cross-map signal computed for different time-delays with the convergent cross-mapping algorithm (see Methods). For the null hypothesis, we used surrogates obtained by randomly reshuffling empirical observations. The null hypothesis is rejected at 95% confidence level (CL), equivalent to an a priori test size of 5%, only at time delay equal to 0 and 1 day, with the strongest signal at the former.
Figure 6.
Figure 6.
Analysis of the separation between creators and consumers for different definitions of these groups. The height of the bars indicates the ratio between the observed number of links between two groups and the number we would expect if the links were randomly distributed among the network (as in an Erdös–Rényi network). The dashed horizontal line corresponds to the case where the number of observed links is compatible with those of a random network (y = 1). The red and blue colours indicate if the tweet was originally from the creators’ or from the consumers’ group, respectively. The figures differ because of the threshold in the percentage of most active fake news spreaders used to define creators and consumers. However, it can be seen that the densities of the connections between these groups do not depend strongly on such a threshold.

References

    1. Hoehl S, et al. 2020. Evidence of SARS-CoV-2 infection in returning travelers from Wuhan, China. N. Engl. J. Med. 382, 1278-1280. (10.1056/NEJMc2001899) - DOI - PMC - PubMed
    1. Kraemer MUG, et al. Open COVID-19 Data Working Group. 2020. The effect of human mobility and control measures on the COVID-19 epidemic in China. Science 368, 493-497. (10.1126/science.abb4218) - DOI - PMC - PubMed
    1. Aleta A, et al. 2020. Modelling the impact of testing, contact tracing and household quarantine on second waves of COVID-19. Nat. Hum. Behav. 4, 964-971. (10.1038/s41562-020-0931-9) - DOI - PMC - PubMed
    1. Roozenbeek J, Schneider CR, Dryhurst S, Kerr J, Freeman ALJ, Recchia G, van der Bles AM, van der Linden S. 2020. Susceptibility to misinformation about COVID-19 around the world. R. Soc. Open Sci. 7, 201199. (10.1098/rsos.201199) - DOI - PMC - PubMed
    1. Rapp DN, Salovich NA. 2018. Can’t we just disregard fake news? The consequences of exposure to inaccurate information. Policy Insights Behav. Brain. Sci. 5, 232-239. (10.1177/2372732218785193) - DOI